
Published: March 2020 | Last Updated:September 2026
© Copyright 2026, Reddog Consulting Group.

Lowering ACoS is popular advice, but it's often the wrong first objective. A campaign can look efficient while sales slow, organic demand weakens, and contribution margin disappears under fulfillment, referral, storage, and logistics costs. To optimize Amazon ads profitably, you need to decide what each advertising dollar is allowed to accomplish, then evaluate that decision against the fully loaded economics of the SKU.
Amazon's scale makes this discipline more important. Its advertising business reached $19.8 billion in Q2 2026, up 26% year over year, while industry reporting placed its advertising revenue at roughly $70 billion on a trailing-12-month basis by late April 2026 (PPC Land reports on Amazon's advertising growth). This is a mature auction, not an inexpensive discovery channel. Your job isn't to buy the cheapest click. It's to buy profitable demand at a cost your product, price, and operating model can support.
Amazon advertising does not own the P&L. The ad account controls bids, budgets, targeting, and creative. The business pays for product cost, referral fees, FBA charges, promotions, returns, storage, freight, and the working capital needed to keep the listing in stock.
That distinction changes the objective. Ask, “What contribution margin remains after this order is acquired and fulfilled?” rather than treating lower ACoS as the definition of success. Cutting profitable non-branded traffic, starving a hero SKU, or letting organic demand decline can improve the dashboard while shrinking the business.
Amazon's published 2026 benchmark ranges put average CPC around $1.18 to $1.22, CTR around 0.4% to 0.6%, and conversion rate around 10% to 12%, with stronger accounts reaching 12% to 18% conversion rates (PPC Land's Amazon advertising coverage). At a click price of roughly $1.20, conversion efficiency carries more weight than cosmetic bid reductions. A stronger product page turns the same traffic into more orders. A weak listing makes cheaper clicks a poor fix.
ACoS compares ad spend with attributed ad sales. Use it to manage campaign efficiency, then assess what the campaign is doing for incremental demand, branded demand, and the product mix. A low ratio can hide overreliance on brand searches or sales that would have happened without the ad.
Set an allowable ACoS by SKU and objective. A high-margin hero product may support discovery spend. A low-margin multipack may require strict efficiency. A launch SKU can justify temporary investment while the team validates demand, provided that spend has a defined limit and review date.
Practical rule: Never approve a bid increase without checking the SKU's contribution margin, inventory position, and price architecture.
FBA economics can change that decision quickly. Amazon says its 2026 U.S. FBA fulfillment fees will increase by an average of $0.08 per unit sold, which it describes as less than 0.5% of an average item's selling price (Amazon's 2026 U.S. FBA fee update). Amazon also states that, starting April 17, 2026, a 3.5% fuel and logistics-related surcharge applies to FBA fulfillment fees in the U.S. and Canada and to specified Remote Fulfillment movements (Amazon's FBA fuel and logistics surcharge guidance).
The unit impact may appear modest, but CPG brands often operate with narrow contribution margins. A fee increase can consume the profit from a minor ACoS improvement. Protecting margin may require a price adjustment, pack-size change, tighter promotion, different fulfillment configuration, or a budget shift toward SKUs with healthier economics. Scaling ads without those checks just buys revenue at a weaker return.
Bid changes should follow diagnosis, not substitute for it. Amazon's benchmark system uses ad-spend-weighted calculations at the brand level and exposes metrics including CTR, CPC, purchase rate, completion rate, and new-to-brand metrics (Amazon's advertising benchmark guidance). That matters because a simple account average can make weak campaigns look acceptable when spend is concentrated elsewhere.
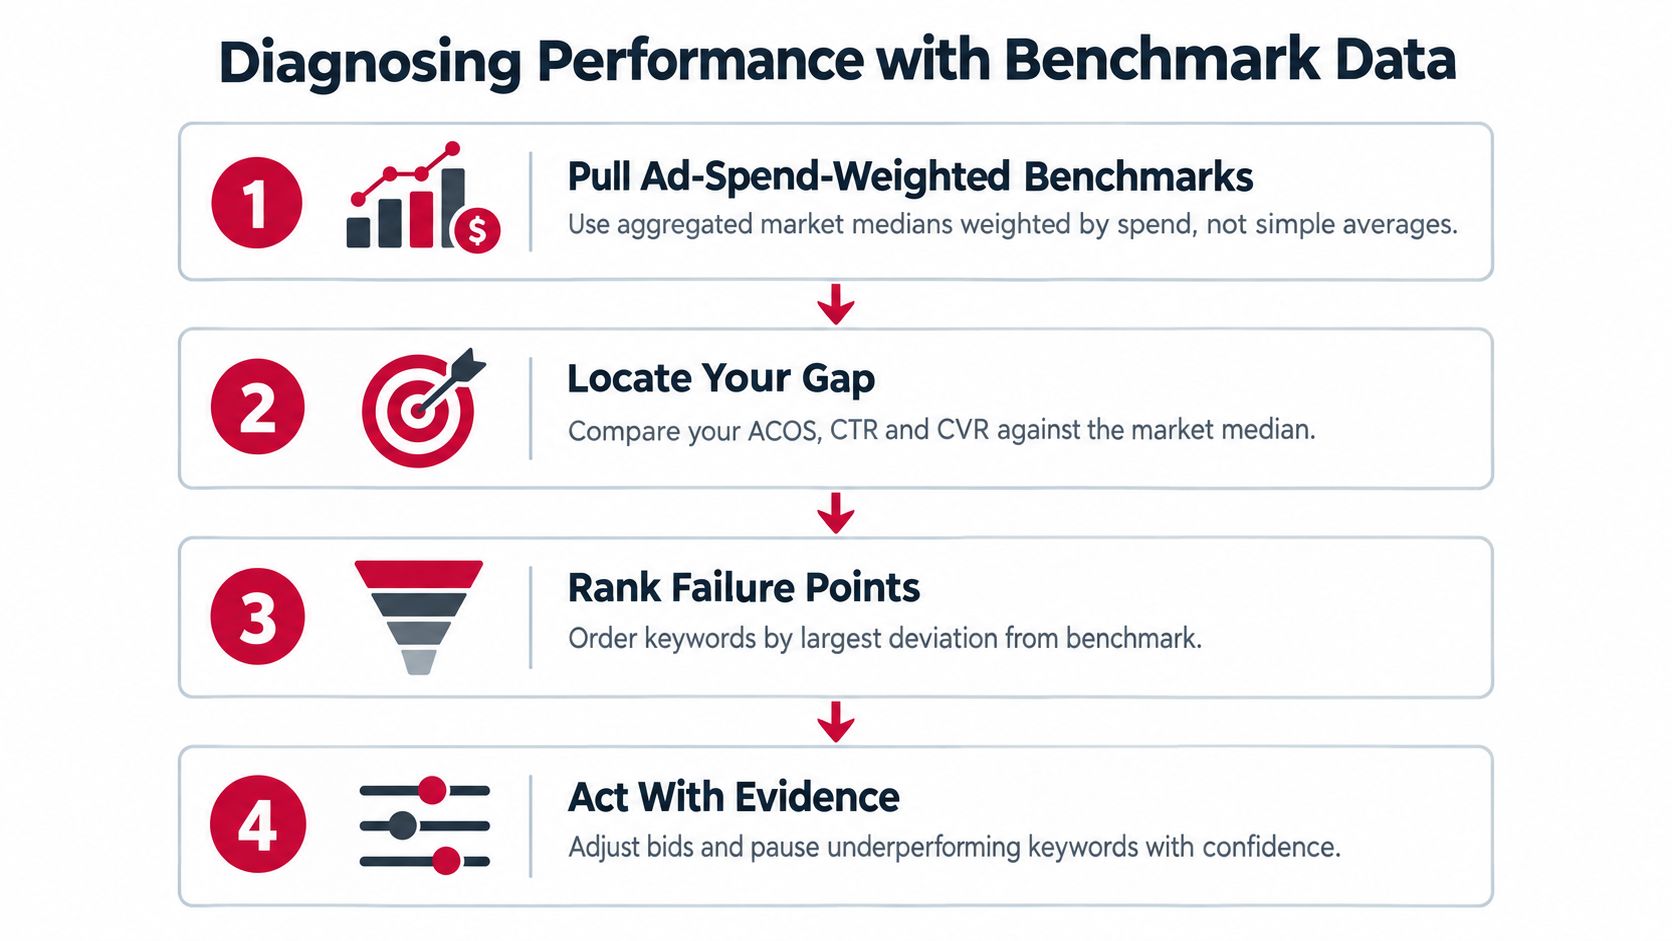
Start by separating campaigns by format, objective, SKU, and targeting intent. Then compare the relevant segments with Amazon's benchmark percentiles.
Amazon displays rate-based metrics such as CTR and purchase rate from low to high, while cost-based metrics such as CPC are shown from high to low. Use that presentation to identify the bottleneck before editing bids. A campaign with strong purchase rate and budget exhaustion needs funding. A campaign with weak CTR needs relevance work. A campaign with strong CTR but poor purchase rate needs retail readiness work.
For broader market context, a marketplace scraping benchmark can help operators inspect visible marketplace conditions, competitor assortment, pricing, and listing patterns. It shouldn't replace Amazon's account-level benchmarks, but it can explain why a once-competitive offer is losing clicks or conversions.
Pull benchmark data on a consistent schedule, then rank segments by deviation rather than by absolute spend. Isolate search terms, placements, and ASIN targets that create the largest gap. Apply one meaningful change at a time, such as a negative keyword, a bid correction, stronger copy, or a budget transfer.
Budget exhaustion deserves special attention. Amazon notes that depleted budgets can hide missed impressions, clicks, and sales. A profitable campaign with limited delivery may be misclassified as weak only because it never had enough opportunity to generate volume.
For the mechanics behind the core efficiency metric, use this guide to calculating ACoS, then add contribution margin and total channel revenue to the decision. ACoS tells you what the ad did. Your margin model tells you whether the business should do more of it.
A useful campaign structure separates what the shopper wants from how much control the operator needs. Combining discovery, branded defense, competitor targeting, and multiple SKUs in one campaign creates blurred data. You can't tell whether performance comes from strong intent, a cheap placement, a high-margin product, or branded demand that would have converted anyway.
Use separate campaigns for exact, phrase, and broad discovery where the data supports distinct bids and budgets. Keep branded defense separate from non-branded acquisition. Split hero SKUs from products that have different margins or conversion behavior. Treat Sponsored Products, Sponsored Brands, and Sponsored Display as different jobs, not interchangeable inventory.
Recent benchmark reporting shows a meaningful divergence across formats in Q2 2025 (Tinuiti's Q2 2025 digital advertising benchmark report):
| Ad Format | Spend Trend | Click Trend | CPC Trend |
|---|---|---|---|
| Sponsored Products | Up 18% year over year | Up 19% year over year | Pricing growth slowed |
| Sponsored Brands | Opposite pattern from Sponsored Products | Down 20% year over year | Up 18% year over year |
| Sponsored Display | Down 24% year over year, sixth straight quarter of declines | Not specified in the verified data | Not specified in the verified data |
The implication isn't that Sponsored Brands or Sponsored Display should be shut off. Upper-funnel formats can support discovery, branded demand, and audience development. The issue is role clarity. If Sponsored Brands costs more while generating fewer clicks, protect only the campaigns with a measurable strategic purpose. If Sponsored Display is consuming budget without a clear contribution to profitable demand, reduce exposure or move the money into a format with stronger purchase intent.
Amazon's advertising history helps explain why this structure matters. Sponsored listings appeared in earlier forms before Amazon Marketing Services was commonly associated with 2012, and Amazon described Sponsored Products as a generalized second-price auction by 2014. The system matured into the Amazon Ads Console in 2018, but the operating fundamentals remain relevance, auction efficiency, and product-market fit (PPC Land's history of Sponsored Products).
Teams managing a large account can use an Amazon Ads Manager resource to reinforce the operating workflow, but the tool doesn't replace judgment. Structure the account so a human can see where the money goes and why.
Video can improve performance, but it can't rescue an irrelevant product or a weak offer. Scaling creative before proving targeting creates a measurement problem. You won't know whether the new asset improved engagement or just received better traffic.
Amazon reports that campaigns with video achieved 67% higher CTR and 9% higher CVR than campaigns without video (Amazon Sponsored Products guidance). Those are meaningful lifts, but they're not a license to put every SKU into video. The comparison supports a sequence, not a shortcut.
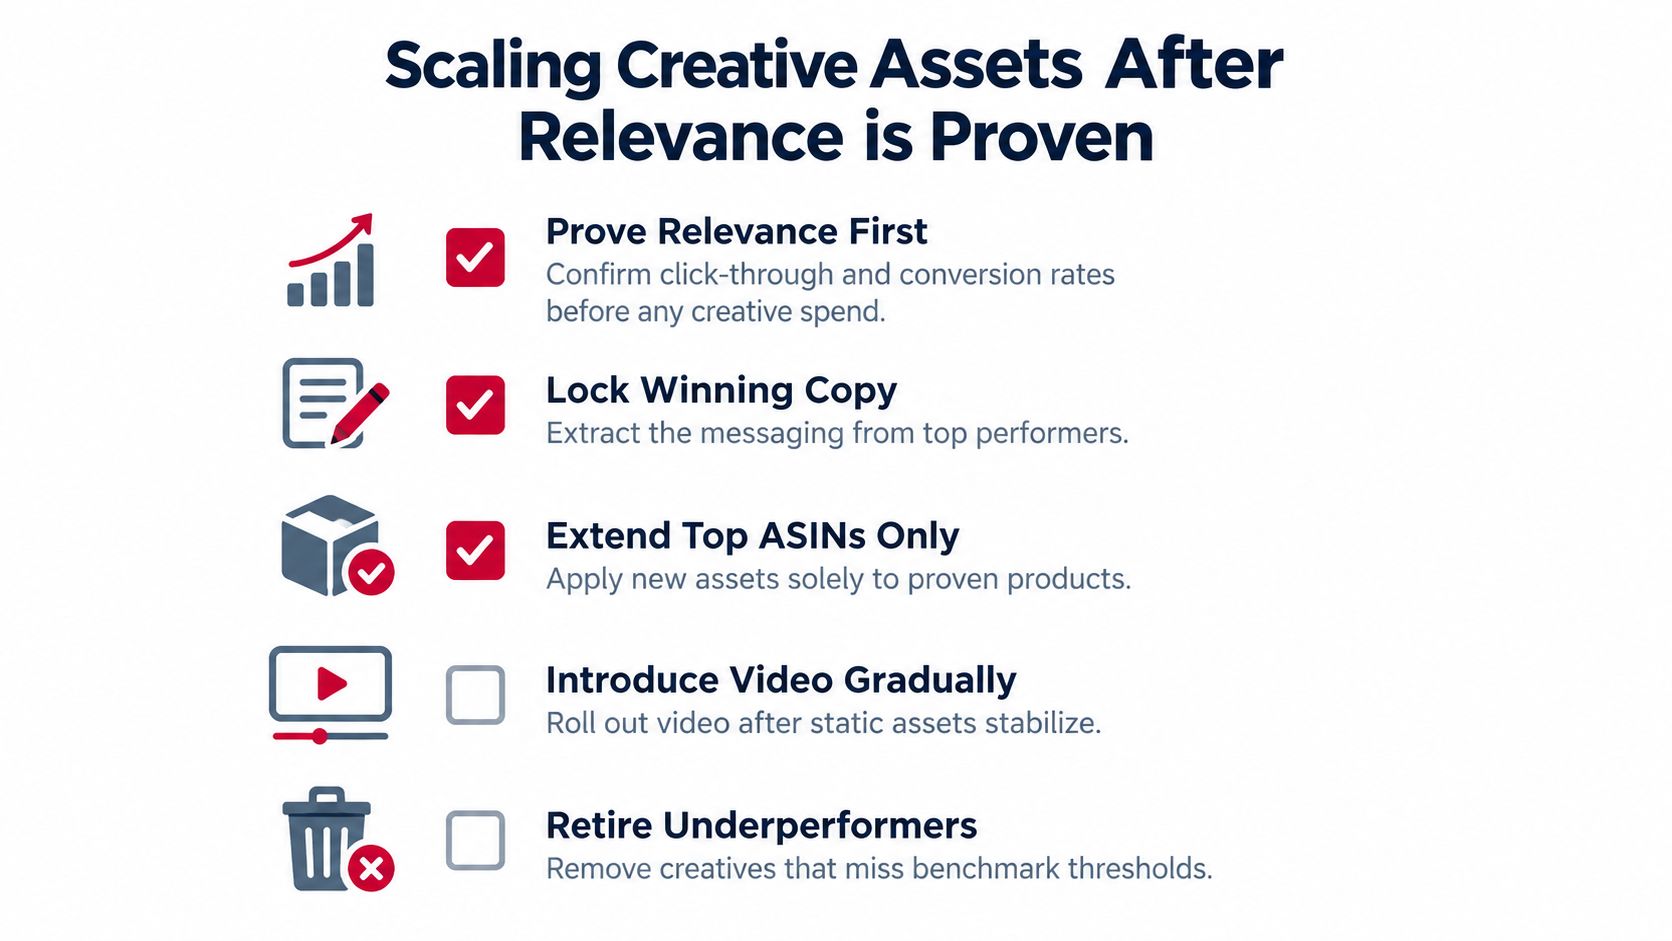
Start with the commercial promise. Does the main image communicate the pack and use case? Does the title match the query? Do the bullets answer the shopper's objections? Is the price credible against comparable products? Creative testing should build on a listing that already earns qualified attention and converts at a defensible rate.
Use benchmark data to validate CTR and purchase rate by category and region. Amazon says benchmark reporting is generally available worldwide for CTR, CPC, video completion rate, and new-to-brand purchase metrics. That gives multinational brands a more consistent measurement language instead of using one market as a proxy for another.
A disciplined creative progression looks like this:
For practical inspiration, review these Veo3 AI video ad examples, then evaluate each concept against the actual product promise. A polished video that exaggerates the use case may lift clicks and damage conversion, returns, and reviews. Good creative makes the decision easier for the right shopper. It doesn't manufacture product-market fit.
Brands that need a deeper production and testing workflow can also reference product video for Amazon. The operating standard remains simple: test the asset where relevance is already established, measure both attention and purchase, and scale only when the economics hold.
Amazon advertising belongs inside a fully loaded unit model, not in an isolated ACoS report. For each SKU, account for selling price, product cost, referral fee, FBA fulfillment, inbound freight, promotional funding, expected returns, ad spend, and applicable storage or logistics charges. If those inputs are missing, the account manager is optimizing a partial P&L.
The 2026 FBA changes make that gap expensive. Amazon reports an average U.S. fulfillment fee increase of $0.08 per unit, plus a 3.5% fuel and logistics-related surcharge on specified FBA fulfillment fees beginning April 17, 2026, as noted earlier. A brand can lower ACoS and still lose contribution when higher fees, deeper discounts, or understated freight costs consume the improvement.
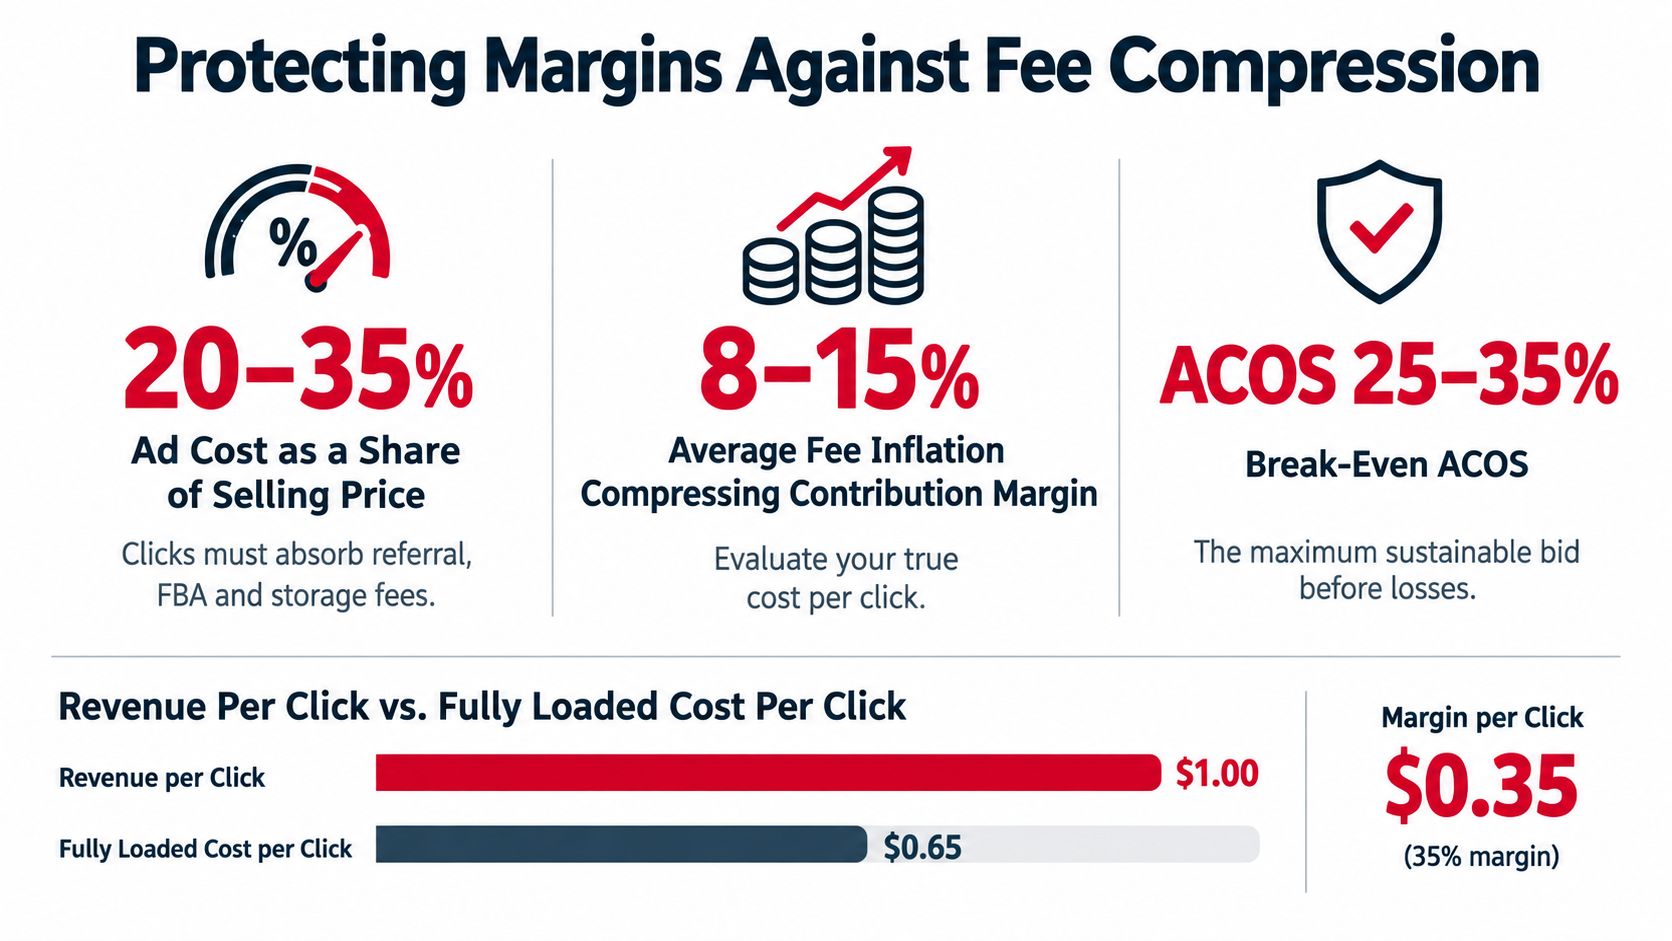
Start with the contribution dollars available before advertising:
Selling price minus product cost, referral fee, fulfillment, freight, promotions, returns, and other variable costs equals pre-ad contribution.
Divide pre-ad contribution by selling price to establish break-even ACoS. Set the operating target below that ceiling, leaving room for overhead, demand volatility, and the brand's growth objective. One catalog-wide break-even ACoS will mislead teams when pack sizes, margins, and return rates vary.
A campaign can produce acceptable attributed revenue at its current ACoS while a fee increase reduces contribution on every order. Raising bids to preserve volume may accelerate sales and worsen the P&L at the same time. Depending on the SKU, the better response may be a price increase, different pack architecture, less promotional overlap, or a shift in spend toward a higher-margin product.
Paid demand creates value only when inventory turns at a healthy pace. Promoting a slow-moving item can increase storage exposure and tie up cash. Cutting spend on a constrained hero SKU can preserve stock while sacrificing ranking and revenue. Bid decisions therefore need to reflect the supply plan, not only auction performance.
Walmart's fulfillment economics reinforce the same principle beyond Amazon. Walmart lists standard WFS storage at $0.75 per cubic foot per month from January through September. From October through December, the rate remains $0.75 per cubic foot for items stored 30 days or less, then adds $1.50 per cubic foot for items stored longer than 30 days. After June 30, 2026, aged inventory over 366 days costs $2.25 per cubic foot per month, while inventory over 450 days costs $7.50 per cubic foot per month (Walmart Fulfillment Services pricing). Walmart also states that referral fees range from 6% to 15% by category and total sales price, with no signup or monthly subscription fees (Walmart's 2026 new-seller savings information).
The operating rule is channel-neutral: compare advertising, fulfillment, inventory, and cash-cycle costs together. A campaign that looks efficient in the ad console may be unattractive after storage. A higher-ACoS campaign can still be the better investment when it sells a high-margin SKU quickly and supports a healthier inventory position.
A 90-day plan should move through Foundation, Optimization, and Amplification without skipping the first stage. Consider a mid-sized CPG brand with several hero and supporting SKUs, inconsistent campaign structure, and an ACoS target that ignores fee changes. The first month shouldn't begin with aggressive scaling. It should establish what can safely scale.
During the first weeks, reconcile the SKU economics. Confirm current selling prices, product costs, FBA charges, promotions, returns, and inventory coverage. Assign each SKU a contribution-margin target and a role, such as hero, profit driver, launch product, or clearance candidate.
Then clean the account:
At the end of this phase, the team should know which campaigns are underfunded, which are structurally confused, and which products should not receive incremental traffic.
Use Amazon's benchmark reporting to compare CTR, CPC, purchase rate, completion rate, and new-to-brand performance against the appropriate category context. Don't treat a low ACoS as proof of success if sales volume is falling or the campaign is limited by budget.
Run focused tests. Improve copy where CTR trails the benchmark. Correct bids where CPC is high but traffic quality is sound. Repair the listing where clicks arrive but purchases don't. Reallocate budget only after identifying the failure point, and record the expected business outcome before making the change.
This is also the point to connect advertising with merchandising. If a price increase improves contribution but weakens purchase rate, the media team needs to know. If inventory is becoming constrained, the operator may reduce acquisition spend on that SKU and protect availability for higher-value demand.
Amplification means expanding proven systems, not increasing every budget line. Add video to relevant Sponsored Products campaigns after static creative, targeting, and listing quality have stabilized. Test new-to-brand acquisition where the brand can support the economics. Use Amazon's expanded measurement capabilities, including AMC in the Ads Console, AI-powered no-code analytics, new-to-brand audience options, and access to five years of retail purchase history, as described in Tinuiti's Q1 2025 benchmark coverage.
Review the cadence weekly for search terms, budgets, stock, and major placement shifts. Review it monthly for SKU contribution, total advertising cost relative to total revenue, price and promotion effects, and inventory velocity. Keep a quarterly decision log that records what was scaled, what was retired, and whether the change improved the business rather than just the campaign report.
The strongest Amazon operators don't ask whether an ad is cheap. They ask whether the next unit is worth acquiring, fulfilling, and carrying.
Reddog Consulting Group applies this margin-first operating perspective across Amazon, Walmart, DTC, wholesale, and distribution, connecting marketplace advertising with pricing, merchandising, operations, and inventory planning. That is the difference between managing bids and building a channel that can scale without spending away the P&L.
If your Amazon advertising is generating sales but contribution margin remains unclear, Reddog Consulting Group offers a free 30-minute working session for CPG founders and operators. Use the session to review marketplace performance, break-even ACoS, fee exposure, inventory trade-offs, and the next practical growth decisions, not to sit through a sales pitch.
Leave a comment: