Published: March 2020 | Last Updated:January 2026
© Copyright 2026, Reddog Consulting Group.

Calculating your Advertising Cost of Sale (ACoS) is refreshingly simple: it’s your total ad spend divided by your total ad revenue, then multiplied by 100. This formula is the bedrock for measuring how efficiently your pay-per-click (PPC) campaigns are running on retail media platforms like Amazon and Walmart.

Before you can optimize your ad budget, you need to understand what ACoS truly means. Think of it as a health check for your PPC campaigns. It tells you exactly what percentage of your ad-driven sales revenue is being spent on the ads themselves, giving you a direct line of sight into campaign efficiency and profitability.
Understanding this metric is the crucial first step in our Foundation → Optimization → Amplification growth framework. You can't improve what you don't measure. ACoS provides a clear, quantifiable starting point to build a scalable advertising strategy.
To break it down further, this quick reference table outlines the core components of the ACoS calculation and what they mean for your brand.
| Component | What It Means | Where to Find It |
|---|---|---|
| Ad Spend | The total amount of money you've spent on advertising campaigns over a specific period. | Your advertising platform's dashboard (e.g., Amazon Ads Campaign Manager, Walmart Ad Center). |
| Ad Revenue | The total sales generated directly from clicks on your ads within that same period. | Also found in your advertising platform's reporting section, often labeled "Sales" or "Revenue." |
| ACoS % | The percentage of your ad revenue that was spent on advertising. It’s your efficiency score. | Calculated using the formula: (Ad Spend / Ad Revenue) x 100. |
This table helps put the numbers into context, making it easier to see how each piece of the puzzle contributes to your overall performance and brand growth.
Let's say your brand spends $500 on an Amazon Sponsored Products campaign, and those ads generate $2,000 in sales.
Plugging those numbers into the formula gives you a crystal-clear picture:
($500 Ad Spend ÷ $2,000 Ad Revenue) × 100 = 25% ACoS
This number means that for every dollar your ads generated, 25 cents went back to Amazon to cover the advertising costs. This simple metric is the key to understanding your campaign's direct profitability.
With Amazon's ad ecosystem now a multi-billion dollar channel, ACoS has become the north star for sellers aiming for omnichannel growth. In fact, industry data shows over 70% of sellers use it as their primary KPI for PPC optimization.
ACoS isn't just an abstract number; it's a critical tool for unlocking profitable growth across both online and offline channels. A firm grasp on your ACoS helps you make smarter, data-driven decisions.
By mastering how to calculate ACoS, you build the solid foundation needed to move into the optimization phase. This is essential knowledge for brands that want to invest in scalable, measurable growth. For a deeper dive into making your budget work harder, check out our guide on how to optimize ad spend.
To calculate ACoS accurately, you need the right data. The formula is only as good as the numbers you feed it, so let's walk through exactly where to find the two key figures: Total Ad Spend and Attributed Ad Revenue.
Both of these metrics live inside your advertising platform’s dashboard. Knowing where to look is the first step toward taking control of your ad performance. This process is the bedrock of the Foundation phase in our growth framework—it eliminates guesswork and gives you a solid baseline to measure everything against.
Most major retail media networks, like Amazon or Walmart Connect, present this information clearly, even if the terminology varies slightly.
Here’s where to look:
It's critical that the date ranges for both spend and revenue are identical. Mismatched timeframes will produce a skewed, unreliable ACoS that could lead to poor strategic decisions.
Pro Tip: Don't just pull numbers for a single day. We recommend looking at the last 7, 14, and 30 days. This provides a more stable view of your ACoS by smoothing out daily spikes or dips caused by reporting lags or weekend shopping habits.
Let's make this practical. Imagine a CPG brand is running a campaign for a new line of grilling sauces on Amazon, aiming to capture demand as summer approaches.
After their Sponsored Products campaign has been running for 30 days, they check Campaign Manager and pull the numbers for that timeframe:
Now, they plug these into the ACoS formula:
( $2,500 Ad Spend / $10,000 Ad Revenue ) x 100 = 25%
Their ACoS for this campaign is 25%. This tells them that for every dollar in sales their ads generated, they spent 25 cents on advertising. With this single, powerful metric, they now have a clear benchmark to judge campaign efficiency and are ready to begin optimizing for better results.
So you know how to calculate ACoS. Now comes the most important question for any advertiser: what should my target actually be?
The truth is, a "good" ACoS isn't a universal number. It’s a strategic choice tied directly to your product's profit margin and your brand's current goals. There’s no magic percentage.
A brand focused on maximizing profit will have a completely different target than a startup trying to gain market share. This is where you move from basic calculation to smart, data-driven strategy—the Optimization phase of our growth framework.
The most critical figure to determine is your Break-Even ACOS. This is the ACoS percentage where your ad costs perfectly offset your product's profit margin. At this point, you aren’t making money on the ad-driven sale, but you aren’t losing it either.
Figuring it out is straightforward:
Break-Even ACOS = Pre-Ad Profit Margin %
Let’s say you sell a product for $50. After factoring in all costs—cost of goods (COGS), shipping, and marketplace fees—you’re left with $30. That means your pre-ad profit is $20.
Your profit margin is ($20 / $50), or 40%. In this scenario, your break-even ACoS is 40%. Any ACoS below that number is profitable.
Knowing your break-even point transforms your advertising approach. It stops being about chasing an arbitrarily low number and becomes a conscious decision: are we driving profit, breaking even for visibility, or investing in growth at a calculated loss?
With your break-even ACoS as your north star, you can set intelligent targets that align with your business objectives. Your strategy will likely shift depending on a product's lifecycle or your current focus.
Here are a few common scenarios we see with our clients:
Driving Profitability: For established products with strong organic sales, you might set a Target ACoS well below your break-even point, such as 15-20%, to ensure every ad-driven sale adds healthy profit to your bottom line.
Aggressive Growth: When launching a new product, you might strategically aim for an ACoS of 50% or higher, even if it’s above your break-even point. The goal here isn't immediate profit but gaining sales velocity, accumulating reviews, and climbing organic rankings to secure long-term market position.
Balanced Approach: For most products in a stable growth phase, a target that balances visibility and profit is the sweet spot. This often lands around 25-35% and is a common, effective strategy for steady brand growth.
It also helps to understand where you stand in the broader market.
For example, during the holiday shopping season, your Walmart Marketplace campaign generates $1,000 in sales from $300 in ad spend. That’s a 30% ACoS. But what truly matters is how that compares to top performers.
Data shows that the top 10% of brands in many categories average around an 18% ACoS. That level of efficiency is what fuels the 25%+ YoY growth our clients consistently see. Meanwhile, brands stuck with a 50%+ ACoS often experience stagnant sales. You can dive deeper into how to interpret these performance metrics on eva.guru. This context is vital for setting goals that are both realistic and ambitious.
While ACoS is the go-to health check for your PPC campaigns, it only shows part of the picture. It tells you how efficiently your ad dollars turn into ad-driven sales but misses the powerful "halo effect" your ads have on your brand's overall performance.
To get a complete view of your advertising impact, you need to incorporate two other critical metrics: Total Advertising Cost of Sale (TACoS) and Return on Ad Spend (ROAS). Mastering these will take you from simply managing campaigns to strategically steering your brand's growth.
TACoS measures your ad spend against your total sales—not just the sales directly attributed to your ads. This is crucial because it includes the organic sales that occur because your ads boosted your product's visibility, improved its sales velocity, and helped it climb the search rankings.
The formula is: (Ad Spend / Total Revenue) x 100
A decreasing TACoS over time is an excellent indicator of success. It means your ad spend is shrinking as a percentage of your total revenue, proving that your advertising is fueling a sustainable lift in organic sales. This is the goal: using paid channels to build a brand that eventually thrives on its own.
While ACoS measures efficiency in terms of cost, Return on Ad Spend (ROAS) flips the perspective to show the revenue you get back for every dollar you invest. It’s a direct measure of revenue generation and is often preferred by stakeholders because it speaks directly to top-line growth.
The ROAS formula is the inverse of ACoS: (Ad Revenue / Ad Spend)
For instance, a 25% ACoS is the same as a 4.0 ROAS ($1 in ad spend generates $4 in ad revenue). Thinking in terms of ROAS helps you make smarter investment decisions. You can even learn how to calculate break-even ROAS for profitability to ensure your campaigns are always set up for success.
The infographic below shows how different ACoS targets can align with specific business goals, whether you’re launching, profiting, or liquidating inventory.
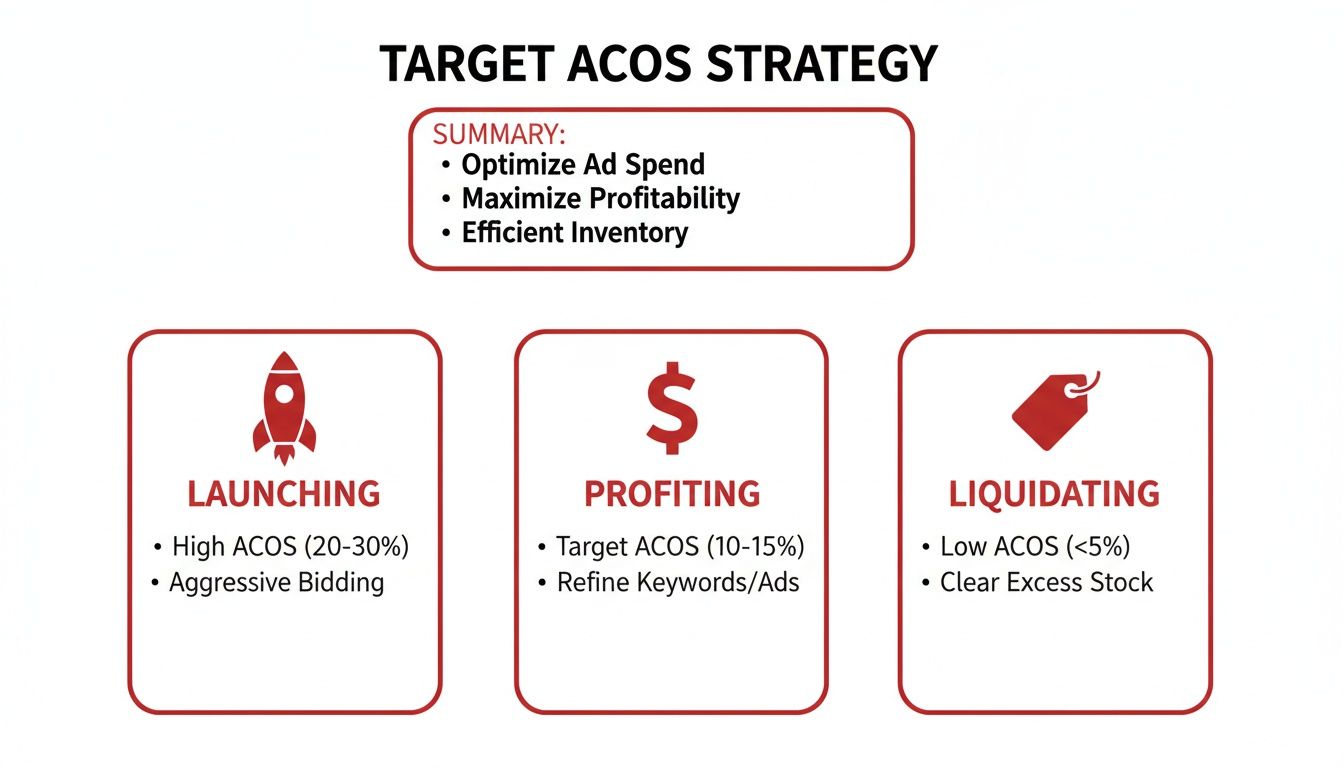
This visual clarifies that a high ACoS isn't always bad—it can be a strategic choice for a product launch—while a low ACoS is essential for maximizing profit on established products.
These metrics each tell a different part of your performance story. Think of them as different lenses for viewing your advertising health. Here’s a quick breakdown to help you decide which one to focus on and when.
| Metric | What It Measures | Best For |
|---|---|---|
| ACoS | Efficiency: How much of your ad revenue is spent on advertising. | Assessing the direct profitability and health of individual campaigns or ad groups. |
| TACoS | Overall Impact: How ad spend influences total revenue (paid + organic). | Measuring the long-term "halo effect" and brand-building power of your advertising strategy. |
| ROAS | Return: How much revenue you generate for every dollar spent on ads. | Evaluating top-line revenue growth and making investment-level decisions. |
Using all three together gives you a complete, holistic view of performance. You're no longer just running efficient ads; you're building a powerful brand presence that drives both paid and organic growth.
The Big Picture: ACoS tells you if an individual ad campaign is profitable. TACoS shows you if your advertising strategy is building your brand. ROAS tells you how much revenue you’re getting back for your investment.
Remember, a stronger organic ranking from this halo effect is also directly supported by top-notch product pages. For more on that, check out our guide on Amazon listing optimization.
You know how to calculate your ACoS. That’s the critical first step—your Foundation. Now comes the Optimization phase, where we make every ad dollar work harder. Lowering your ACoS isn't about blindly slashing budgets; it’s about making smarter, surgical decisions to drive profitable growth.
The strategies we use daily for our clients are practical, repeatable tactics focused on one thing: efficiency. By dialing in who sees your ads and ensuring your product page converts, you can turn wasted ad spend into a powerful growth engine.
Your keyword strategy is the single biggest lever you can pull to influence ACoS. Bidding on broad, irrelevant terms is the fastest way to burn through your budget with nothing to show for it. The goal is simple: get your products in front of shoppers who are ready to buy.
Here’s how to do it:
This level of precision is fundamental to effective campaign management. For a deeper look, our complete guide to Amazon ads management provides a comprehensive playbook.
You can have the most perfectly tuned ad campaign, but if your product detail page doesn’t convert traffic into sales, your ACoS will always be high. Every click you pay for that doesn't result in a purchase actively drives your ACoS up. Your listing has to do the heavy lifting.
Your ads bring the horse to water; your product page makes it drink. A high conversion rate is the ultimate ACoS reducer because it maximizes the return on every click you've already paid for.
Focus on these key areas to increase your conversion rate:
A disorganized campaign structure makes optimization a nightmare. When you group products and keywords logically, you gain the granular control over bids and budgets needed to make data-driven adjustments that directly impact your ACoS. To execute this effectively, a deep dive into your paid search analytics is non-negotiable.
Consider adopting a tiered campaign structure. For example, create separate campaigns for branded search terms, top-performing non-brand keywords, and research-focused automatic campaigns. This segmentation allows you to allocate budget precisely where it will generate the best return, pushing you closer to the Amplification stage of growth.
Even with the formula down, practical questions arise once you start digging into the numbers. Getting these details right is the difference between a fuzzy advertising strategy and one that gives you the confidence to make smart, profitable decisions.
Here are direct answers to the most common ACoS questions we get from brands every day.
The short answer is no.
When calculating ACoS, the "Ad Revenue" figure should only reflect the product's price. Major marketplaces like Amazon and Walmart already report sales this way—it's the product price before taxes and shipping are added. Sticking to this clean number ensures you're measuring ad performance against your actual product revenue, keeping your ACoS pure and directly comparable to your profit margins.
When launching a new product, your ACoS will almost certainly be high. That’s not just acceptable; it's often a strategic necessity.
The goal during a launch isn't immediate profit. It's about generating sales velocity, securing crucial first reviews, and climbing the organic search rankings. You have to spend to get the flywheel spinning.
Expect an ACoS of 50% to 100%—or even higher—in the first few weeks. Think of this not as a loss, but as an investment in building market traction. Once your product has a sales history and a foothold in search results, you can gradually shift focus to bringing that ACoS down to a profitable level.
Daily ACoS swings are completely normal and usually aren't a cause for panic. Several factors are at play:
Because of this volatility, looking at daily ACoS is a recipe for anxiety. We always recommend analyzing performance over longer timeframes—like 7, 14, or 30 days—to get a true, stable picture of how your campaigns are performing.
At RedDog Group, we turn these complex data points into clear, actionable growth strategies. We manage the details so you can focus on the big picture. Let’s Talk Growth.
Leave a comment: