Published: March 2020 | Last Updated:February 2026
© Copyright 2026, Reddog Consulting Group.
Effective SEO rank tracking isn’t just about watching numbers on a chart. For a CPG operator, it’s a system for defining a core set of keywords, monitoring your position, and connecting that visibility directly to revenue and contribution margin. Think of it as measuring how your digital shelf space is actually impacting your P&L.
For CPG brands, treating SEO rankings as just another marketing metric is a massive operational error. Every slip in position on Google or Amazon isn't just a number on a dashboard—it's a direct hit to your contribution margin. It drives up your customer acquisition costs (CAC) and slows down inventory velocity. The line between visibility and profitability is brutally direct.
Operators who understand this move past vanity metrics. They stop asking, "Are we ranking?" and start asking, "Are we ranking for the keywords that drive profitable sales for our hero SKUs?" This simple shift turns rank tracking from a passive reporting task into an active operational lever. It becomes a core piece of your brand's growth engine, guiding decisions on everything from promotional calendars to channel investments.
The economics of search results are stark. Moving from position two to position one isn't a small win; it's a monumental shift in potential revenue and, more importantly, channel efficiency.
The click-through rate (CTR) for the #1 spot on Google SERPs is around 39.8%. That number plummets to 18.7% for position two and just 10.2% for third. For a CPG brand, this means jumping from the second spot to the top can boost your clicks by over 74%—a huge surge in qualified traffic without spending another dime on ads.
This isn’t just about top-line growth. It’s about efficiency. Higher organic rankings mean you're less reliant on paid search, which lowers your blended CAC and improves your overall marketing efficiency ratio (MER).
When a key product drops from position #3 to #8 for a high-intent term like "organic protein powder," you're not just losing traffic. You're losing margin because you now have to spend more on ads to reclaim those lost sales, pressuring your entire channel P&L.
A truly effective rank tracking system connects what’s happening on the SERP directly to your company’s financial health. For example, by monitoring a portfolio of "buy now" keywords, you can immediately correlate a drop in rankings to a dip in sales velocity for a specific product line. This gives you the power to forecast inventory more accurately and diagnose sales issues that go beyond just blaming ad performance.
Effective tracking requires a clear line between visibility and sales, which is the heart of proper revenue attribution. This data-driven approach allows you to justify SEO investment not with impressions and clicks, but with real-world impacts on margin and growth. This guide outlines how to build a system that does exactly that.
To build a rank tracking process that truly connects to your brand's financial performance, you need to focus on a few core components. The goal is to move beyond simple position tracking and create a system that informs operational and financial decisions.
| Component | Operational Focus | Key Metric |
|---|---|---|
| Keyword Portfolio | Prioritize terms with high purchase intent and margin alignment, not just volume. | Keyword Profitability Score |
| Tool Stack | Integrate GSC, Analytics, and a rank tracker for a complete view of visibility. | Data Integration Accuracy |
| SERP Feature Tracking | Monitor visibility in Featured Snippets, PAA, and Shopping results. | SERP Feature Ownership % |
| Competitor Benchmarking | Track share of voice against key competitors for your most valuable terms. | Share of Voice (SOV) |
| Reporting & Alerts | Set up automated alerts for significant rank drops on high-value keywords. | Time to Insight |
This framework ensures that your rank tracking efforts are always tied to what matters most: profitable growth. By focusing on these elements, you transform SEO from a marketing function into a strategic business driver.
A solid rank tracking setup starts with a deliberate, margin-focused keyword portfolio. Forget chasing high-volume, low-intent keywords that just drive unqualified traffic. In the CPG world, traffic that doesn't convert at a profitable rate is nothing more than a drain on resources and a drag on your P&L. The goal here is to build a strategic asset, not just a long list of terms.
Your keyword portfolio needs to be segmented by its role in the business. Start by identifying the high-intent, transactional keywords for your hero SKUs. These are your money terms—think "buy organic keto granola" or "best non-toxic baby lotion." A drop in rank for these terms has an immediate and measurable impact on revenue, so you have to watch them like a hawk.
Next, you need to monitor competitor brand terms. If a rival is bidding on your name or ranking for comparison terms like "[Your Brand] vs. [Competitor Brand]," that’s a direct threat to your market share that demands immediate attention. Finally, round out your portfolio with problem-aware, top-of-funnel queries that feed your content strategy, such as "how to improve gut health" if you sell probiotics. This approach ensures your tracking efforts align directly with both sales velocity and long-term brand building.
This diagram illustrates the core flow of a margin-focused SEO process, from identifying valuable keywords to selecting the right tools and building actionable reports.
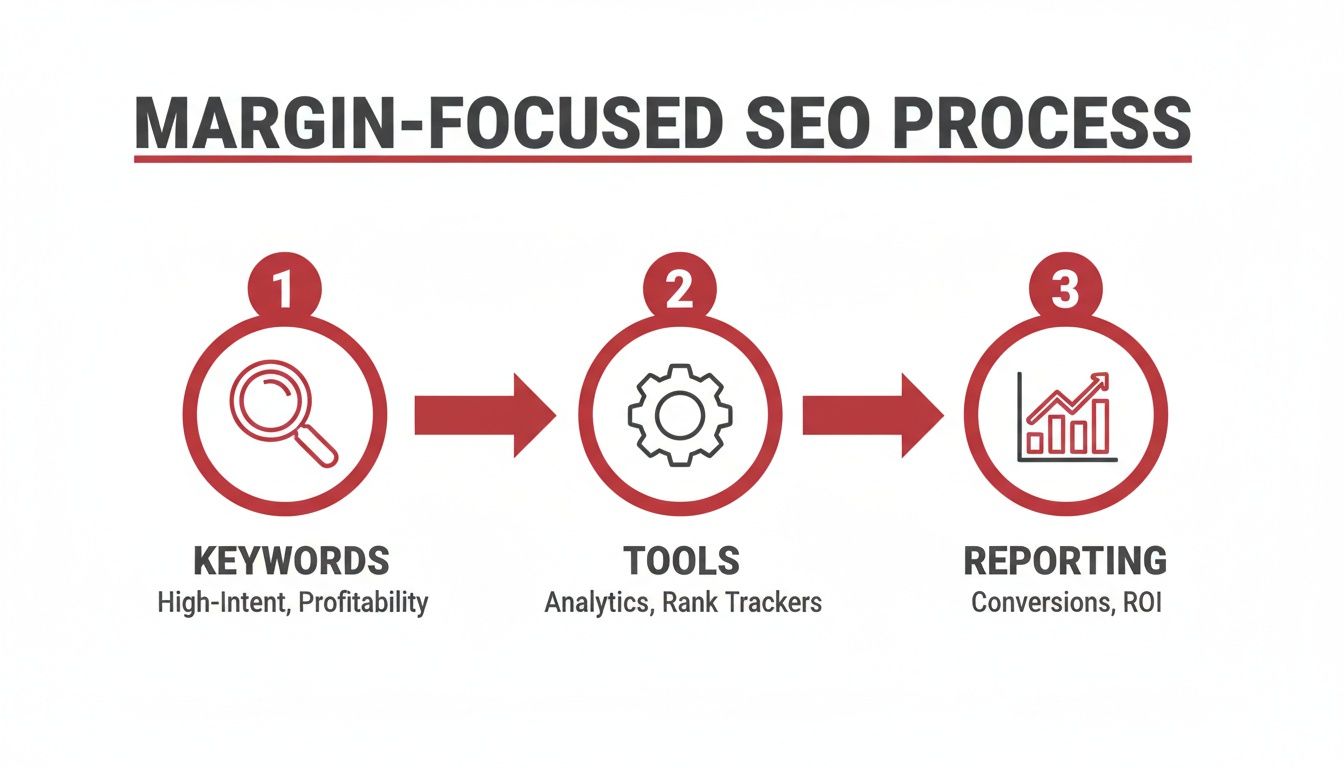
This process ensures that every step, from keyword selection to reporting, is grounded in financial outcomes rather than vanity metrics.
Your tool stack doesn't need to be overly complex. It just needs to provide accurate, timely data without bloating your operating expenses. For any CPG brand, the stack begins with two non-negotiable, free tools from Google.
While GSC is essential, it has its limits. It provides average positions and doesn't offer daily rank updates or deep competitor insights. This is where a paid rank tracker becomes a necessary investment.
The operational trade-off with paid tools comes down to cost-per-keyword, update frequency, and the depth of SERP feature tracking. A cheaper tool might update weekly, leaving you blind to a competitor’s aggressive weekend promotion that knocks your hero SKU off the first page.
Tools like SE Ranking or Semrush fill this gap. They provide daily, geo-specific rankings, track competitor movements, and monitor your visibility within critical SERP features like Featured Snippets and "People Also Ask" boxes. Moving up just one Google position can boost CTR by 32.3%, a powerful stat that underscores the need for daily tracking. This is even more critical when you consider that rich results now command a 58% CTR compared to 41% for standard blue links.
When evaluating these tools, focus on the operational realities. How easily can you tag keywords by product line or strategic importance? Can you set up automated alerts for rank drops on your most profitable terms? Does the platform allow you to track visibility on both Google and key marketplaces like Amazon? Your final tool choice should reflect a balance between granular data and cost-effectiveness, ensuring the investment drives a clear return.
For more guidance on this topic, check out our guide on how many keywords to use for SEO.
A key product’s rank suddenly tanks. One minute you’re #3 for “organic dog food,” the next you’re staring at position #8. Reacting without a plan is a recipe for wasted time and compressed margins. The real question isn't just "why did we drop?"—it's "what’s the actual P&L impact, and which lever do we pull first?"
This isn’t about panicking over the normal daily wobbles of the SERPs. It’s about building a repeatable system to diagnose the root cause, quantify the financial risk, and deploy a measured response. This is how you move from reactive fire drills to proactive, structured analysis that protects your margins.
A rank drop is never just a rank drop; it's a symptom. The cause is usually one of three things: an internal issue (like a technical glitch on your site), an external move (a competitor got aggressive), or an environmental shift (hello, Google algorithm update). Your first job is to figure out which bucket you're in.
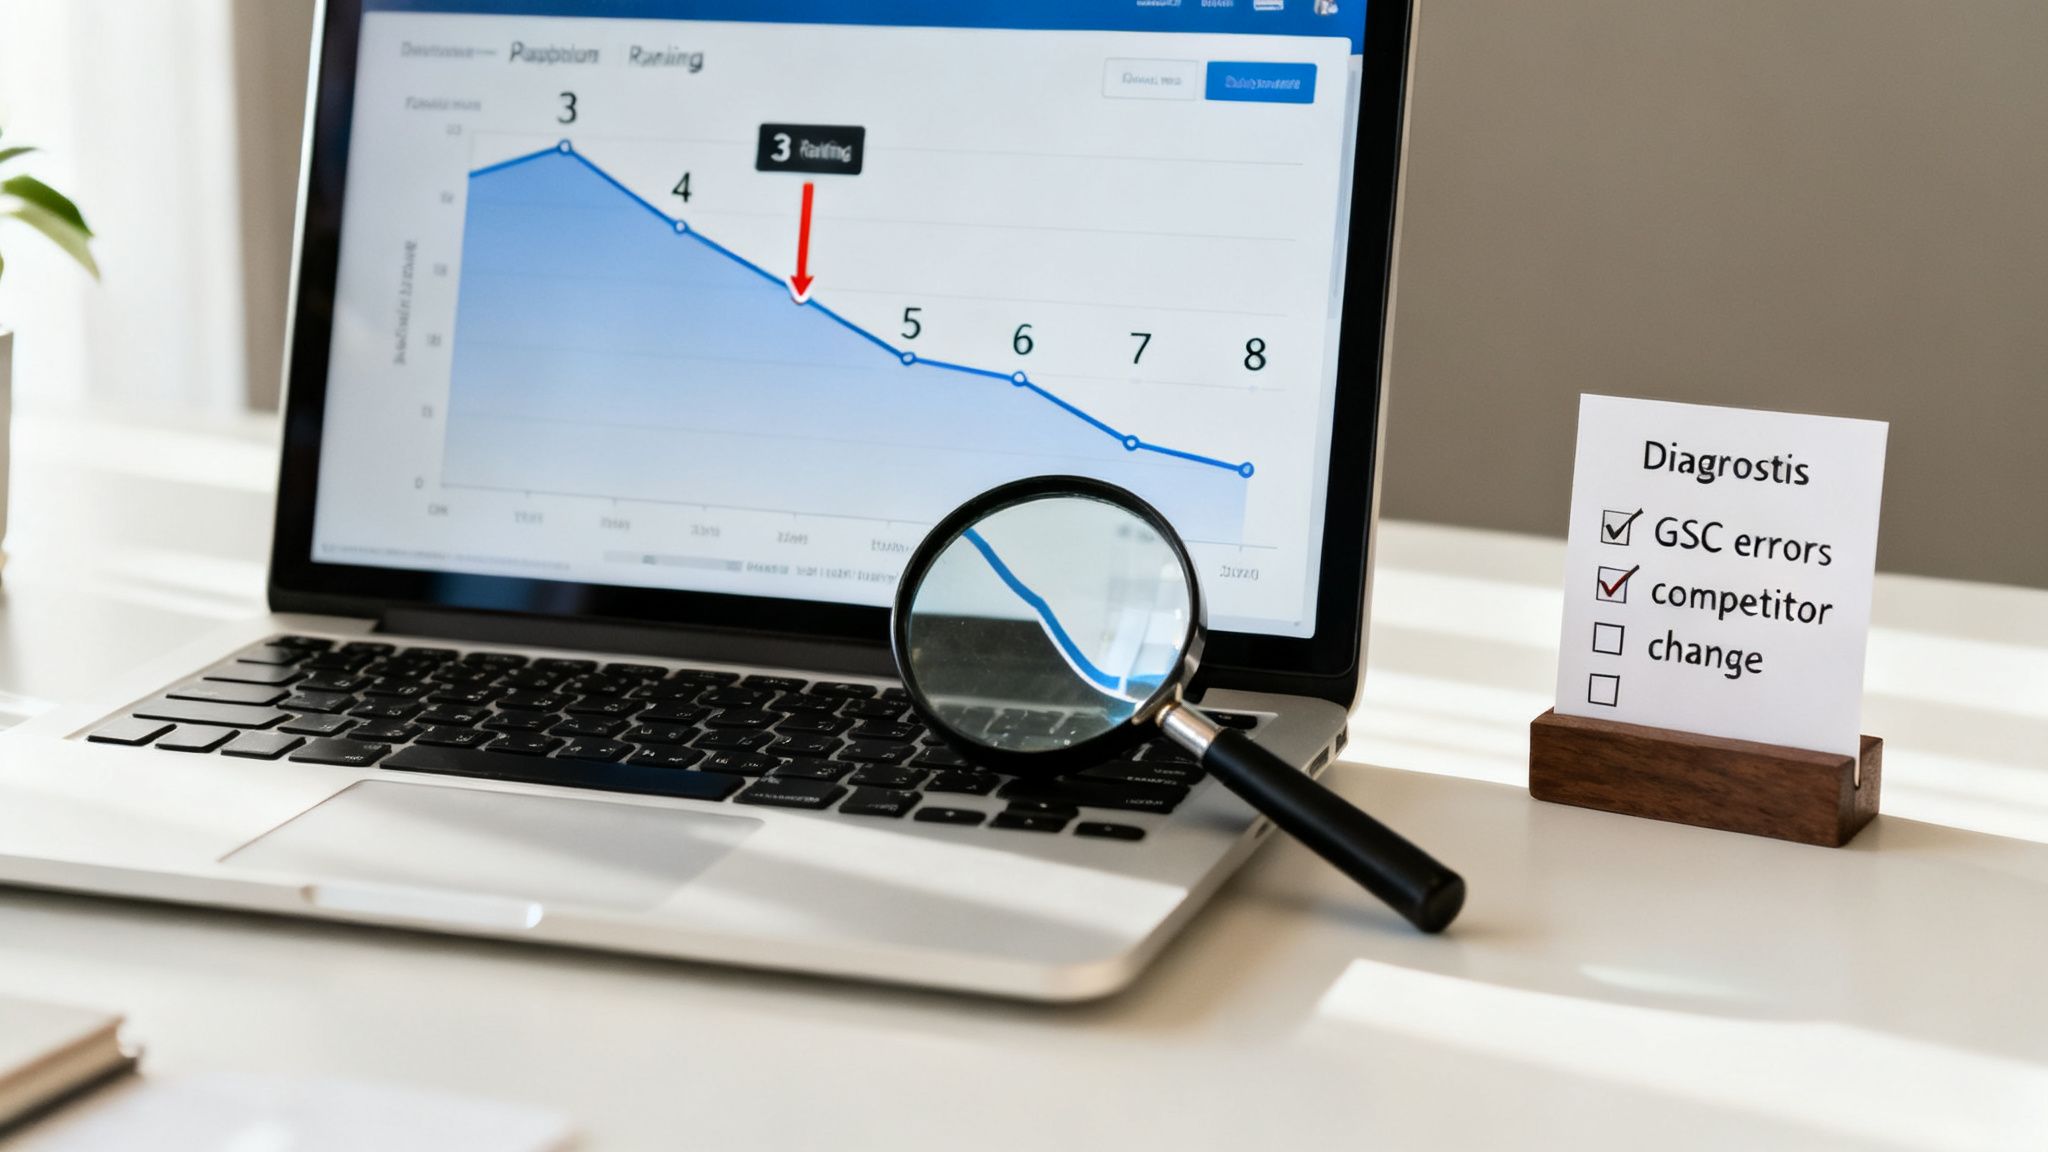
Before you adjust a bid or tweak a product description, you need a systematic diagnostic. This approach stops you from making knee-jerk moves and focuses your resources where they’ll actually make a difference. When rankings go south, don't just guess what's wrong. A structured checklist helps you quickly isolate the problem.
| Symptom | Potential Cause | First Action Step |
|---|---|---|
| Sudden drop across multiple keywords | Technical SEO Issue | Check Google Search Console for crawl errors, manual actions, or indexing problems. |
| Rank loss for one specific keyword | Competitor Action or SERP Change | Manually search the keyword. Analyze the new top-ranking pages for price cuts, new content, or rich snippet changes. |
| Slow, steady decline over weeks | Content Stale or Outdated Links | Review the ranking page. Is the content still the best answer? Run a backlink audit for lost links. |
| Volatility across an entire category | Algorithm Update | Check SEO news sources and forums for chatter about a recent Google update. Monitor for a few days before making major changes. |
Think of this checklist as your first line of defense. It forces you to look at the evidence before forming a hypothesis, making sure your response is based on data, not just a gut feeling.
Once you have a likely cause, the next step is to quantify the business impact. This is where you translate marketing metrics into dollars and cents—the language that gets everyone’s attention and justifies a course correction.
Let's walk through a real-world scenario. Your top-selling gluten-free pasta, which has a healthy 35% contribution margin, slips from position #2 down to #7 for its main keyword.
Now you have a real business case. That $740 monthly margin loss is the budget you have to work with to fix the problem. It tells you whether to invest in a content refresh, run a targeted promo to kickstart sales velocity, or bump up ad spend to fill the gap temporarily. This kind of calculation is a core part of any solid digital shelf analytics strategy.
With a diagnosis and a financial impact assessment, your action plan becomes clear and defensible.
The most common mistake operators make is reacting emotionally to a rank drop. They immediately slash prices or pour money into ads without understanding the root cause, often compressing their margin to solve a problem that might have been a simple technical fix or temporary algorithm volatility.
By following a structured process—diagnose, quantify, act—you turn chaotic rank fluctuations into manageable operational tasks. This is how you stop reacting to the market and start proactively defending your digital shelf and your bottom line.
The classic ten blue links are quickly becoming a relic. We're now dealing with a SERP that's more of a dynamic, interactive answer engine, and the biggest disruptor by far is AI search. For CPG brands, tracking visibility in Google's AI Overviews isn't a "nice-to-have" for the future—it's a critical part of defending your digital shelf space today. Ignoring it is choosing to become invisible.
This isn’t some marginal shift; it’s a fundamental change in how consumers find and buy products. The AI SEO tracking market is projected to hit $4.97 billion by 2033, and Google's AI Overviews are already in front of 2 billion users a month. Some analysts even predict a 25% drop in traffic to traditional search links by 2026.
Think of AI Overviews as the new, premium top-of-page real estate. When someone asks, "what is the best protein powder for building muscle," the AI-generated answer at the very top is now the first, and often only, thing they see. If your brand isn't cited in that summary, you effectively don’t exist for that query. This is a crucial new battleground and a core part of the Amplification stage in our growth framework.
The first big challenge is just figuring out how to see this new type of visibility. Traditional rank trackers are still playing catch-up, so for now, you need a mix of manual checks and whatever tool-assisted methods you can get.
It all starts with your existing keyword list. Comb through it and pinpoint the high-margin, transactional, and informational keywords that are most likely to trigger an AI Overview. These are usually question-based or comparison queries.
Once you've flagged these keywords, you have to monitor them. Some of the more advanced SEO tools are starting to roll out features to track "SERP Feature" ownership, which can include AI Overviews. But don't underestimate the power of just manually checking your most important terms weekly. It’s a smart, low-cost way to keep a pulse on what’s happening. Your goal is to build a clear list of keywords where AI is now the gatekeeper to your traffic.
This is where tough decisions come in. Getting your brand featured in an AI Overview demands a different kind of content strategy. AI models favor content that gives direct, concise, and authoritative answers. That means you're facing a major operational trade-off.
Do you pour resources into creating long-form, FAQ-style content specifically designed to be scraped by AI, or do you double down on traditional, product-led SEO to optimize your category and product pages?
There’s no single right answer. It’s a portfolio decision that depends on your margins and market position.
As search keeps changing, knowing how to adapt your approach is key to scaling your visibility. Exploring advanced methods, like Programmatic SEO AI strategies, can help you get ahead of new ranking factors and find efficiencies in your content process.
Ultimately, tracking your visibility in this new AI-powered world is about managing risk. By actively monitoring which keywords are being taken over by AI and making deliberate choices about where to invest your content budget, you can prevent your brand from being pushed to the sidelines in this next evolution of search.
Still stuck manually pulling reports in spreadsheets? That’s a massive operational bottleneck. It’s slow, prone to human error, and by the time you’ve wrangled all the data, it's already stale. For a CPG brand where inventory velocity and channel margins are everything, stale data leads to bad decisions.
The goal isn't just to create reports. It's to build an automated system that serves up actionable insights when you need them, not a week later.
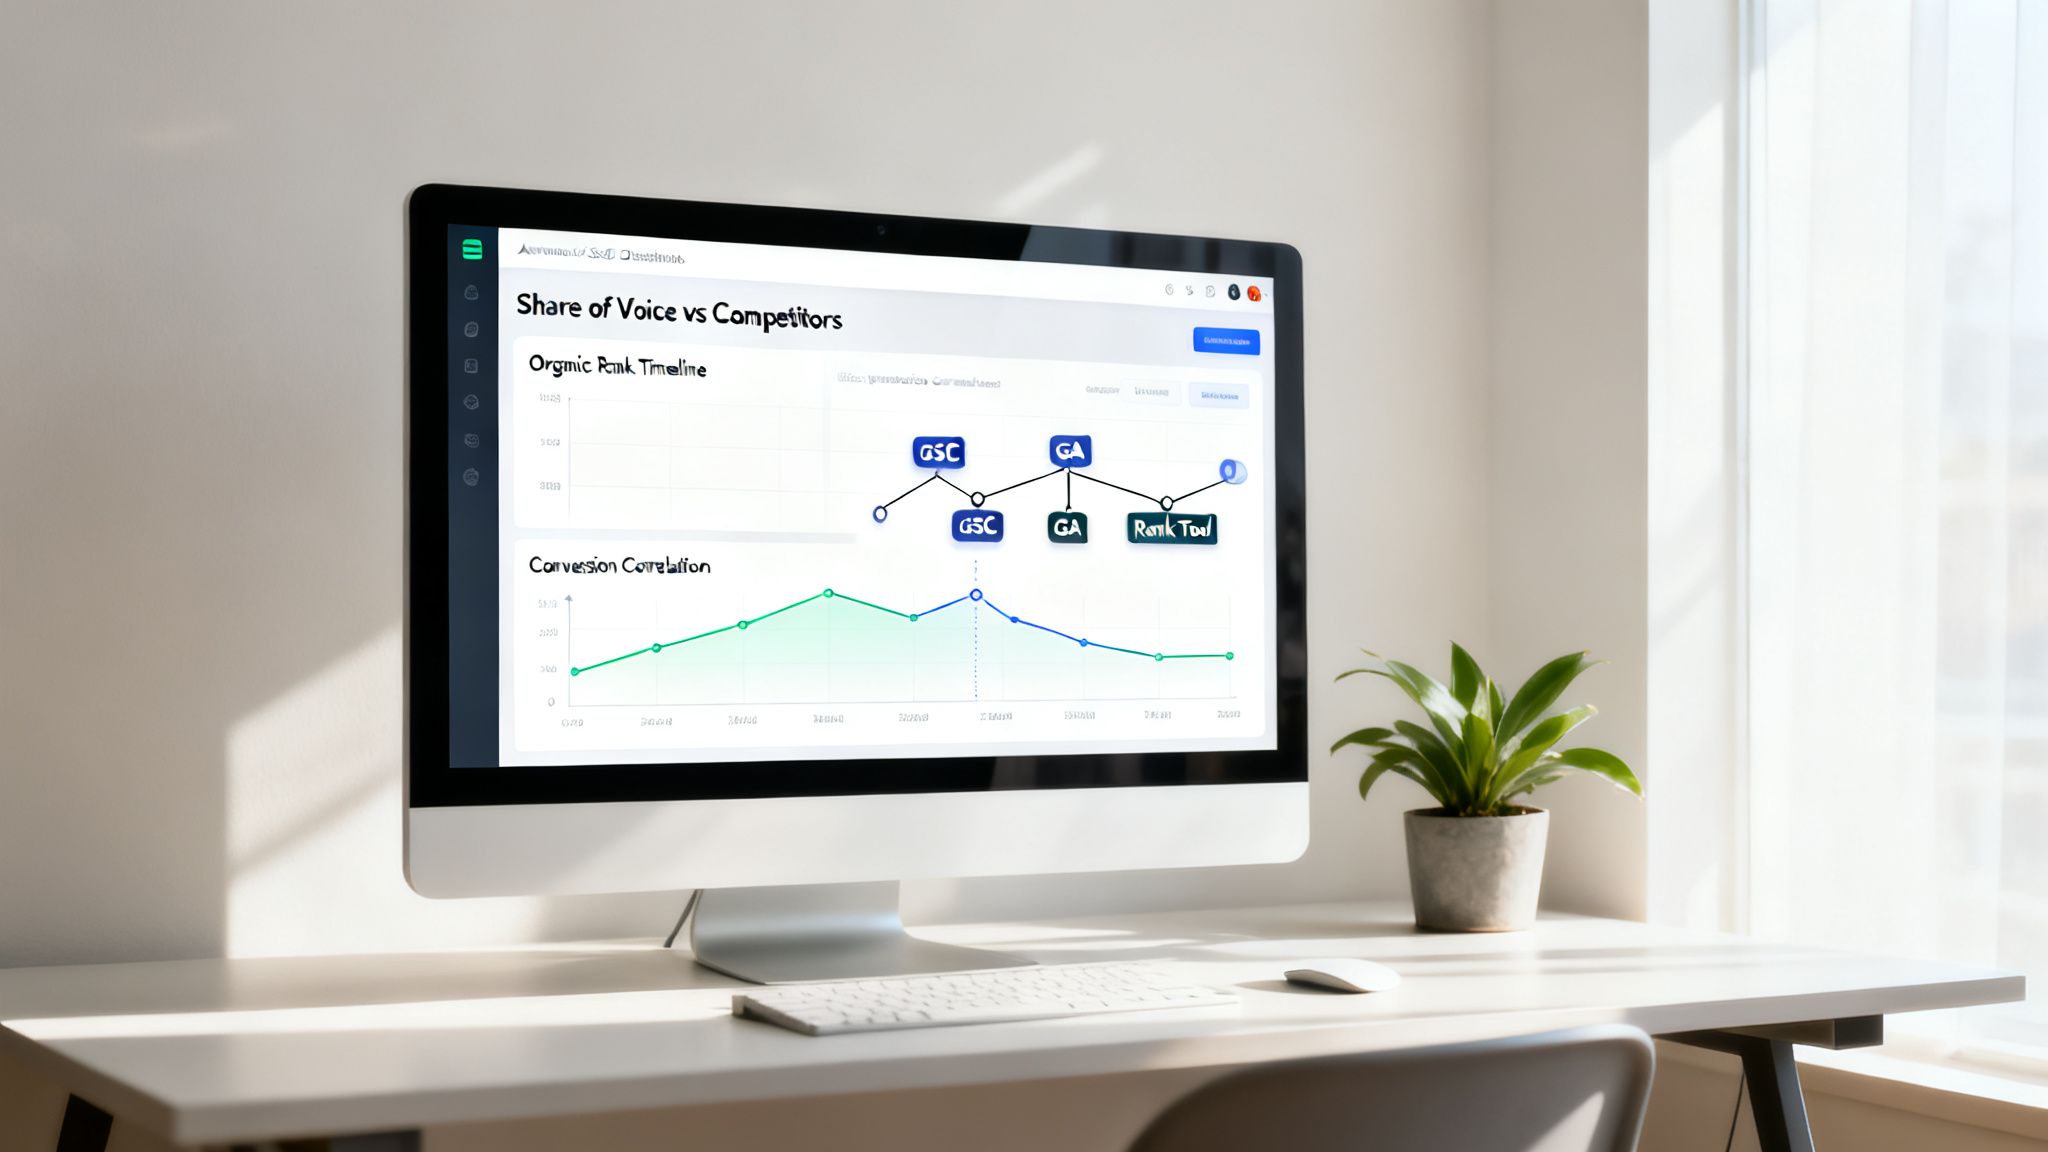
This means ditching the weekly CSV downloads and creating a single source of truth. You need an automated dashboard that pulls in data from Google Search Console, Google Analytics, and your paid rank tracking tool. Platforms like Looker Studio (formerly Google Data Studio) or Databox are perfect for this. They plug directly into your data sources, update in near real-time, and let you build custom reports for different people in your organization.
Not everyone needs to see every single metric. An effective reporting system recognizes this and serves two main audiences, each with completely different priorities. Your dashboards should reflect that reality.
The Executive View: Leadership doesn’t care about daily rank fluctuations for a long-tail keyword. They care about P&L impact. This dashboard needs to be a high-level summary that connects SEO performance directly to business outcomes. Think revenue, market share, and channel profitability.
The Channel Manager View: This is the granular, in-the-weeds dashboard. It’s built for the operator who needs to diagnose problems and spot opportunities at the product or category level. This is where you track individual keyword movements, SERP feature ownership, and click-through rates.
This two-tiered approach keeps conversations productive. Executives get the strategic overview they need for budget decisions, while channel managers get the tactical data required to get the job done.
A dashboard cluttered with vanity metrics is worse than useless—it's distracting. Focus on charts that answer critical business questions and show the relationships between different performance levers. As the search landscape evolves, a comprehensive keyword rankings and visibility report should blend traditional SEO metrics with AI-driven insights to give you the full picture.
Here are a few essential visualizations every CPG brand should have in their SEO dashboard:
Share of Voice (SOV) vs. Key Competitors: This chart tracks your visibility for your most valuable keyword groups against your top 2-3 rivals. A dip in your SOV is an early warning that a competitor is making an aggressive push, giving you time to react before it hits your sales numbers.
Rank vs. Revenue by SKU: This is a simple but powerful scatter plot or dual-axis chart. It overlays the average ranking position of a hero SKU with its weekly or monthly organic revenue. It visually proves the direct link between visibility and sales, making it dead simple to justify SEO investment for specific products.
Organic Rank vs. Paid Media Efficiency: For keywords where you’re running both organic and paid campaigns, map your organic position against your paid CPC or CPA. As your organic rank improves, your paid media should become more efficient (lower CPC, higher CTR) because of the combined brand presence on the SERP. This chart proves it.
The most powerful dashboards don’t just report what happened; they reveal the underlying economics of your channel. They show how a 10% improvement in organic visibility for a product category can reduce your reliance on paid ads, freeing up margin that can be reinvested into inventory or promotions.
Automating your reporting transforms rank tracking from a backward-looking chore into a forward-looking strategic tool. It's a core piece of the Optimization phase in our growth framework, creating the feedback loop you need to make faster, more profitable decisions.
Knowing how to track SEO rankings is one thing. Avoiding the traps that destroy the ROI of the entire effort is another. Too many CPG brands get the technical side right but fail because they underestimate the business risks hiding in the data. These aren't just minor SEO mistakes; they're strategic missteps that burn cash and hide growth opportunities.
The most common pitfall is chasing "vanity keywords." These are high-volume, top-of-funnel terms that look impressive on a report but drive traffic that doesn't convert at a profitable rate.
Ranking #1 for "healthy snacks" might feel like a huge win, but what if most of that traffic consists of window shoppers who bounce immediately? You've just spent significant resources attracting an audience that erodes your margins through wasted server costs and fulfillment headaches.
An operator's focus must be on contribution margin. Is it better to be #1 for a broad term that brings in 10,000 low-intent visitors, or #3 for a specific, transactional term like "buy gluten-free protein bars" that pulls in 500 high-intent buyers? It’s always the latter. Pouring your budget into chasing vanity metrics is a classic way to burn through cash with nothing to show for it on the P&L.
Another significant risk is overreacting to daily data blips without context. SEO tools provide daily rank updates, and it’s tempting to panic over every minor dip. A keyword dropping from position 4 to 5 overnight is not a crisis; it's statistical noise. Making knee-jerk changes to your pricing, content, or ad spend based on these daily fluctuations is a recipe for chaos.
A brand that panics and lowers its price because of a one-day rank slip hasn't solved an SEO problem—they've just crushed their own margin for no good reason. True operational discipline means waiting to see how rank changes impact actual sales over a meaningful timeframe, like a full week, before taking action.
This is perhaps the biggest risk of all, and it's entirely organizational. When rank tracking insights are trapped within the marketing team, the company misses out on their real value.
A steady drop in organic visibility for a key product line isn't just a marketing problem; it’s an inventory planning problem. It signals a potential sales slowdown that the operations team needs to know about so they can adjust purchase orders and avoid getting stuck with excess stock.
Similarly, if your brand is consistently ranking behind a competitor for high-value terms, that’s a merchandising and pricing signal. It should trigger a deep dive into your competitor’s entire offer—pricing, promotions, shipping—not just a quick tweak to your on-page SEO. When rank tracking data doesn't inform inventory, pricing, and promotional strategy, you’re leaving money on the table. This is a core part of building a solid operational Foundation.
When it comes to the real-world application of tracking SEO rankings, operators often have the same core questions. Getting these fundamentals right is the difference between a system that drives profit and one that just generates reports. Below are direct answers to the most common questions we hear from CPG brands.
The frequency of your checks should align directly with the financial risk of the keyword.
For your most critical, high-margin keywords—the ones tied to your hero SKUs that drive significant revenue—daily tracking is non-negotiable. A competitor launching a price promotion or a sudden algorithm shift can knock you off the digital shelf overnight. If you miss that drop for a week, you could be looking at thousands in lost sales and find yourself forced to liquidate slow-moving inventory.
For broader, more informational keywords that support the top of your funnel, weekly tracking is usually sufficient. These terms are important for building authority, but they don't have the same immediate sales velocity impact. Align your tracking frequency with the P&L impact.
For a CPG brand managing hundreds or even thousands of SKUs, scalability, cost-per-keyword, and ease of integration are paramount.
Tools like SE Ranking or Semrush tend to offer a solid balance of powerful features and predictable pricing, which is crucial for managing your operating expenses. When evaluating tools, focus on practical features, not just the bells and whistles.
A tool that creates yet another data silo is just an operational drag. The best tool is the one that fits into your workflow and gives you actionable data without bloating your marketing budget.
Before you touch your pricing or ad spend, your first and only stop should be Google Search Console (GSC). Think of it as your direct line to Google—it's the ultimate source of truth for your site's technical health.
Check for two things immediately:
If GSC gives you the all-clear, your next step is to manually analyze the SERP for the keyword that dropped. Open an incognito window and search for it. Look for new competitors, significant price drops from rivals, or changes in the types of results Google is showing. This structured approach prevents you from reacting emotionally and compressing your margin to solve what might just be a simple technical fix.
Effective SEO rank tracking is critical, but it’s just one piece of a much bigger puzzle. An optimized keyword list won't fix a broken P&L, and a perfect dashboard can't solve inventory pressure or fee compression on Amazon.
Real, sustainable scale happens when you connect every piece of your channel strategy, from search visibility all the way to supply chain velocity. If you're a CPG founder or operator focused on improving your channel economics and scaling the right way, let's talk. This is where the real work begins—moving from tracking data to making margin-accretive decisions.
At RedDog Group, we help CPG brands build profitable growth systems. Book a complimentary 30-minute strategy call to review your current SEO performance and identify immediate opportunities to improve your contribution margin and channel efficiency.
This is a working session, not a sales pitch. We'll dig into your actual rank data and channel economics.
Leave a comment: