Published: March 2020 | Last Updated:December 2025
© Copyright 2026, Reddog Consulting Group.

Digital shelf analytics is the process of gathering and analyzing data from your online "storefronts"—everywhere from Amazon and Walmart.com to your own website. Think of it as a store manager digitally walking the aisles to check stock levels, pricing, and product displays.
The goal? To make smarter, data-driven decisions that boost online sales, protect your brand, and create a seamless omnichannel experience.
Picture your product in a physical Target or Best Buy. You’d want it on the right shelf, fully stocked, with eye-catching packaging and a competitive price. The digital shelf is the exact same concept, applied to every online touchpoint where a customer can find and buy your product.
This isn’t just your product page. It includes search results on Google, category pages on retailer sites, and even how your product appears in a mobile app.
Winning in today's market means treating these digital spaces with the same care as a flagship store. It all comes down to being seen, being in stock, and presenting a more compelling offer than the competition. But the sheer scale of eCommerce makes manual checks impossible. That’s where digital shelf analytics comes in, forming the essential foundation for growth.
To make this concept concrete, let’s compare the traditional retail aisle to its modern digital counterpart. What used to be about physical placement and in-store promotions now has a direct online equivalent.
| Physical Shelf Element | Digital Shelf Equivalent | Why It Matters for Growth |
|---|---|---|
| Eye-Level Placement | Top Search Results (SEO/PPC) | If shoppers can't find you on the first page, you're practically invisible. |
| In-Stock on Shelf | "Add to Cart" Button is Live | Out-of-stocks kill sales momentum and damage your search ranking. |
| Product Packaging | Product Images & Videos | High-quality visuals are your only chance to make a great first impression. |
| On-Package Claims | Product Titles & Descriptions | This is your virtual salesperson, convincing shoppers your product is the solution. |
| Customer Word-of-Mouth | Ratings & Reviews | Social proof builds trust and is often the final nudge a buyer needs. |
| Price Tag | Listed Price & Promotions | Your price relative to competitors directly impacts the decision to buy. |
This comparison makes it clear: managing your online presence with data is just as critical as managing physical inventory.
Brands that don’t actively monitor their digital shelf are essentially leaving their stores unlocked and unattended. This opens the door to stockouts, unanswered negative reviews, and competitors stealing customers right from your product page.
It's no surprise that the global digital shelf analytics market is projected to hit USD 4.48 billion by 2033 as more brands recognize this reality. For a deeper dive, check out this comprehensive guide to the digital shelf.
This data-first approach is the starting point for our omnichannel growth model.
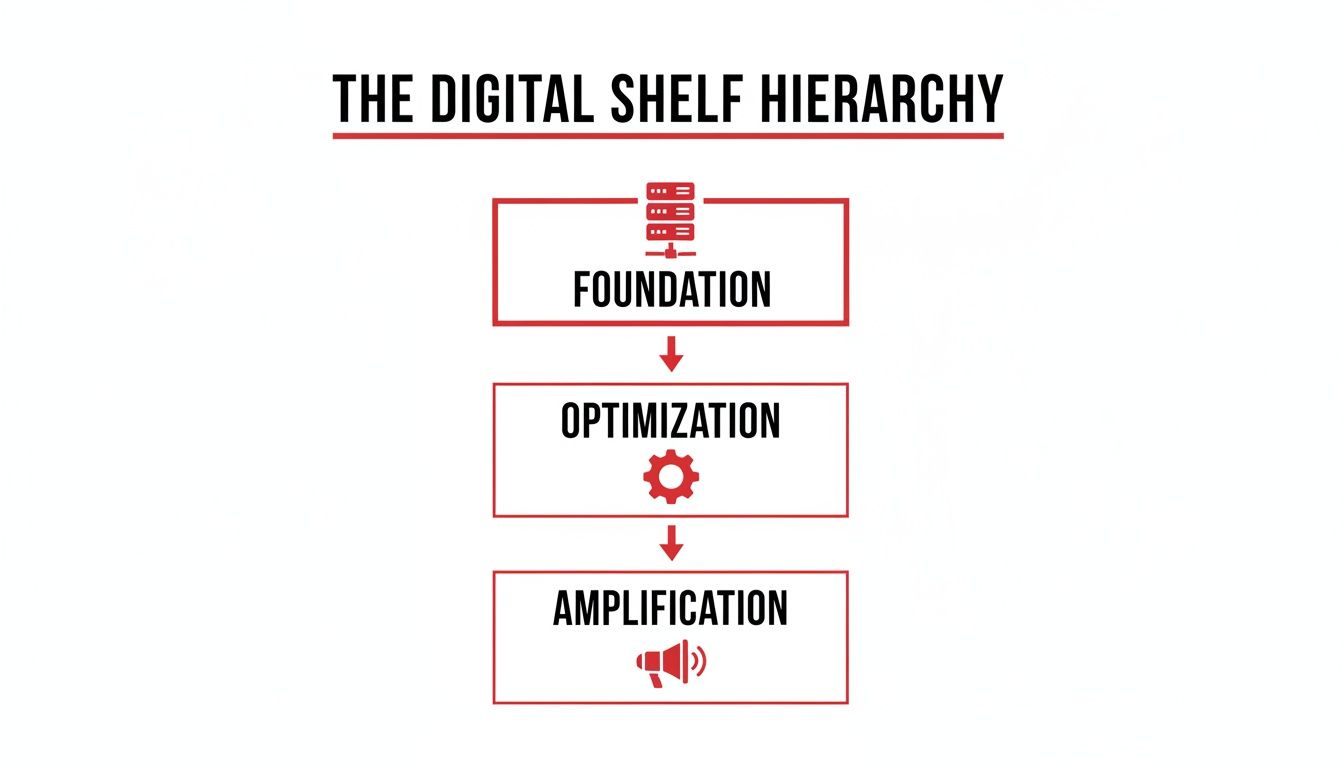
This model illustrates that sustainable success begins with an analytics Foundation. Only then can you move to effective Optimization and, finally, powerful Amplification across every channel.
At RedDog, we build every growth strategy on this principle: Foundation → Optimization → Amplification. Digital shelf analytics is the concrete slab that foundation rests on. It provides the objective truth needed to make smarter decisions across merchandising, operations, and marketing.
By turning raw data into actionable intelligence, you can stop reacting to the market and start anticipating its moves. This proactive stance is what separates category leaders from everyone else.
Without a clear view of your performance, you're just guessing. The end goal is simple: turn your data into a measurable competitive advantage.
It’s easy to get lost in a sea of data. While digital shelf analytics platforms can track dozens of variables, focusing on the wrong ones is as useless as tracking nothing. To drive real, measurable growth, you must zero in on the metrics that directly impact a customer’s decision to buy.
These aren’t just numbers on a dashboard—they are the vital signs of your brand’s online health. Think of them as powerful levers you can pull to increase sales and market share. Ignore them, and you’re flying blind.
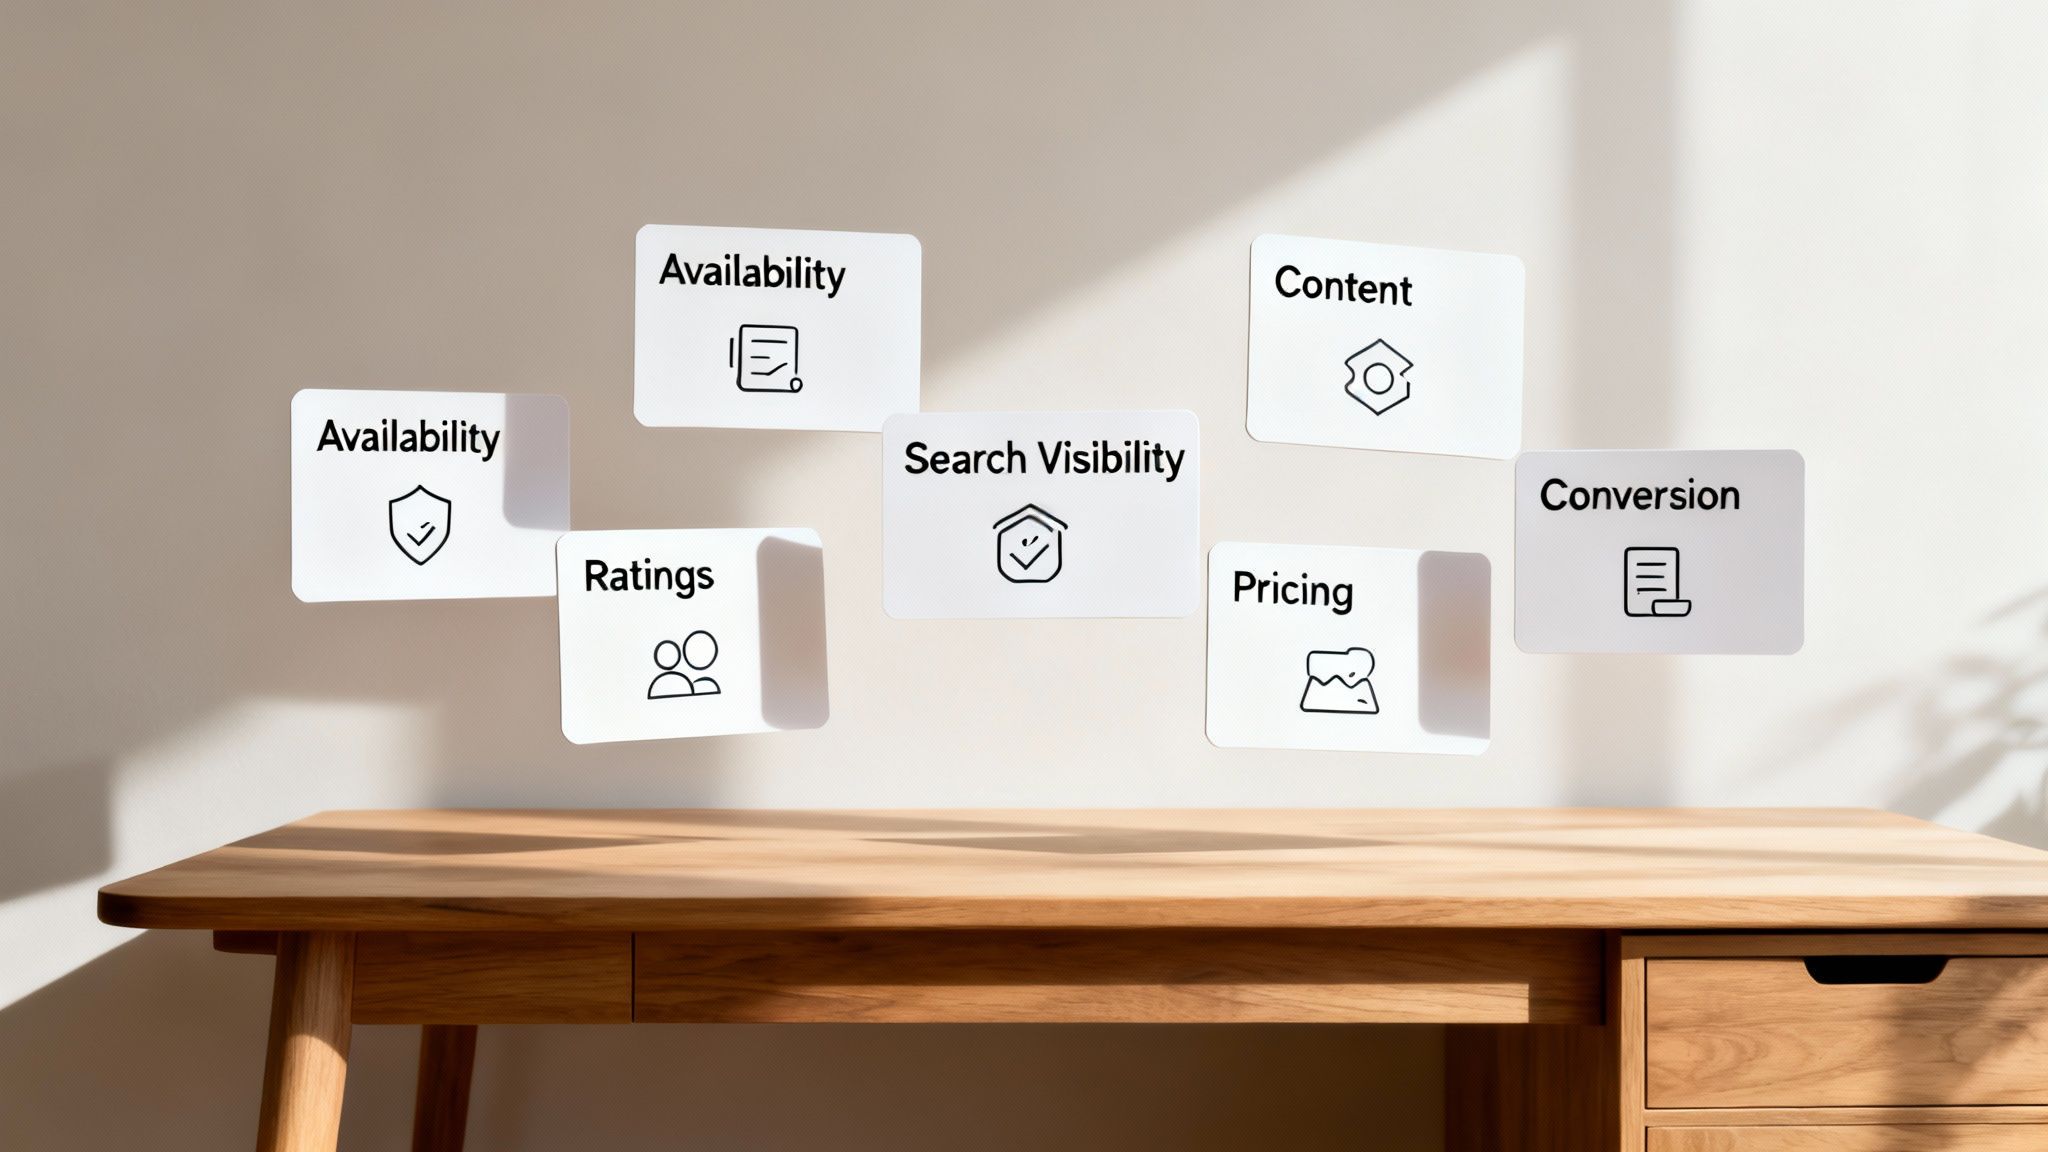
The most fundamental metric is also the most critical: availability. If a customer can't buy your product, nothing else matters. A recurring out-of-stock issue doesn't just cost you a sale; it tanks your search rankings and hands customers directly to a competitor.
Once a shopper lands on your page, your content quality is what closes the deal. It's your digital packaging and virtual salesperson, encompassing everything from your product title and description to images and A+ Content.
Poor content—like blurry photos or a weak description—creates doubt. Great content answers questions before they’re asked, builds confidence, and makes your product’s value undeniable.
A customer can’t touch or feel your product online. Your content has to do all the heavy lifting to bridge that gap and convince them it’s the right choice.
If content is your salesperson, then search visibility is your store’s location. Are you on the main street where everyone can see you, or tucked away in a back alley? This metric tracks how easily shoppers find you when they search for relevant keywords on sites like Amazon or Google.
Ranking on the first page for a high-volume search term is the digital equivalent of prime, eye-level shelf space. To truly measure this, mastering broader digital performance metrics is essential for keeping your brand in top shape.
Today, ratings and reviews are non-negotiable social proof. A high star rating and a healthy volume of positive reviews act as a powerful endorsement, often becoming the final factor a customer considers before buying.
A low rating can kill a sale instantly, while negative feedback offers invaluable insights for product development. This is a direct line to your customers—make sure you're listening.
Your pricing strategy is a delicate balance. You need to be competitive enough to win the sale without devaluing your brand or eroding margins. Digital shelf analytics helps you monitor your pricing against key competitors and enforce MAP (Minimum Advertised Price) policies in real time.
This isn't about being the cheapest. It's about understanding the market landscape so you can position your product intelligently for both conversion and profitability.
Ultimately, all these metrics lead to the one that truly matters: conversion rate. This measures the percentage of visitors who land on your product page and complete a purchase. It’s the final exam for how well all other elements are working together.
A low conversion rate is a red flag that something is broken. Perhaps your price is too high, your content isn't convincing, or a new competitor launched a better offer. Analyzing conversion trends helps you diagnose these problems and fine-tune your strategy. Explore our list of other key digital marketing metrics for small business growth to round out your tracking.
Thanks to its robust eCommerce infrastructure, North America leads in adopting these data-driven strategies, holding the top market share in the digital shelf analytics space—a trend expected to continue with the US leading through 2033.
Knowing what to track is only half the battle. The other half is implementing the right technology to gather and make sense of that data. Your digital shelf analytics tech stack is the engine that drives your strategy, turning a chaotic flood of information into a clear picture of your performance.
Without the right tools, you're stuck manually checking product pages—a task that’s not just tedious but impossible to scale. The goal is to build a system that delivers accurate, real-time insights without drowning your team in technical headaches. This is a core part of the Foundation pillar: getting the right systems in place to support long-term growth.
When it comes to the software, you generally have two paths, each with pros and cons depending on your team's size, budget, and goals.
All-in-One Platforms: Think of these as the Swiss Army knife of digital shelf analytics. They aim to be a single source of truth, covering a wide range of metrics—from search rankings and content compliance to pricing and review sentiment—in one dashboard.
Specialized Solutions: These tools are specialists. They focus on doing one or two things exceptionally well. You might use one tool for competitive pricing intelligence, another for monitoring customer reviews, and a third for tracking search visibility.
The all-in-one approach offers convenience, while specialized tools often deliver deeper, more granular data in their niche. Many growing brands find a hybrid model works best: start with a core platform and supplement it with a specialized tool for a critical area, like MAP (Minimum Advertised Price) monitoring.
Another fork in the road is whether to build a custom analytics system or subscribe to a third-party software-as-a-service (SaaS) provider. While building a custom solution offers maximum control, it's a path loaded with hidden costs and complexities.
An in-house system requires a massive upfront investment in engineering talent, ongoing maintenance, and constant updates to keep up with changing retailer APIs. For 99% of brands, this is not a practical or cost-effective option.
Partnering with a dedicated digital shelf analytics provider is almost always the smarter choice. These companies have already invested millions in developing robust, scalable platforms that work out of the box.
Why Buying Beats Building:
Choosing the right technology partner is a foundational decision that directly impacts your ability to optimize and grow. It’s about empowering your team with actionable intelligence, not burdening them with software management.
Collecting data is the easy part. The real challenge—and where most brands get stuck—is turning that firehose of digital shelf analytics into concrete actions that grow the business. Data sitting on a dashboard is a number; data woven into your team’s daily workflow is a competitive edge.
This is where you move from the Foundation of gathering intelligence to the Optimization and Amplification phases. It’s about making insights operational, ensuring the right information gets to the right people so they can make smarter, faster decisions.
The secret is to break down data silos. When insights flow freely between departments, each team can pull powerful growth levers that work in concert, creating a unified strategy.
Your merchandising team lives and breathes your product catalog. Digital shelf analytics gives them a direct, real-time feedback loop from the market, transforming how they manage products.
Instead of waiting for last month's sales reports, they can see how content and availability are performing today.
This data-first approach removes guesswork from planning and ensures your product presentation is always aligned with shopper demand.
Marketing teams can use digital shelf data to sharpen campaigns, dominate search, and improve return on ad spend. Analytics paint a clear picture of what customers are looking for and how they feel about your products.
By connecting search visibility data and review sentiment, marketers can move beyond generic campaigns. They can build highly targeted ads and content that speak directly to customer pain points and search intent, dramatically improving relevance and conversion.
For example, a CPG brand might see through review sentiment analysis that customers consistently praise the "eco-friendly packaging" of their new soap. The marketing team can immediately make this benefit the star of their next ad campaign, knowing it's a proven winner.
Likewise, if search data shows a sudden spike in "fragrance-free soap," they can adjust their SEO strategy on the fly to capture that emerging demand.
For your operations and supply chain teams, digital shelf analytics is an invaluable early warning system. Nothing kills momentum faster than a stockout, and availability data helps prevent these costly mistakes.
By monitoring inventory levels across dozens of online retailers, your operations team can get ahead of potential problems. They can proactively manage replenishment and shift inventory to channels where demand is highest, preventing lost sales and protecting your search rankings.
Real-World Example: A DTC Startup
A direct-to-consumer startup selling kitchen gadgets used review analytics to guide product development. They noticed a recurring theme in reviews about the "awkward handle" on their best-selling spatula. Their product team used this direct feedback to redesign the handle. This small, data-informed tweak led to a 4.8-star rating and a 15% lift in sales.
This cross-functional flow of information separates market leaders from the rest. The global market for these tools is exploding as brands catch on, with projections showing the digital shelf analytics market climbing from USD 2.5 billion to USD 12.7 billion by 2032. You can discover more insights about this growing market to see how top brands are adapting.

Theory is great, but the real value of digital shelf analytics is seeing it drive measurable results. Data isn't for making fancy charts; it's for growing your bottom line. These examples show how real brands turn insights into impact.
These are practical applications of our Foundation → Optimization → Amplification model, proving that a solid data strategy leads directly to growth.
The Challenge: A home goods seller on Amazon was stuck. Their great product was buried on page three for its most important keywords, rendering it invisible to most shoppers. Growth had flatlined.
The Solution:
The Challenge: An omnichannel CPG brand selling through major retailers and their own website knew they had inventory issues but couldn't pinpoint the cause, leading to frustrated customers and lost sales.
The Solution:
Mastering the digital shelf isn’t just another marketing task—it's a core business intelligence strategy. We’ve walked through how the journey from data chaos to market dominance is built on a clear framework connecting your operations, merchandising, and marketing teams.
This isn’t about chasing endless data points. It’s about focusing on the metrics that move the needle and turning those insights into coordinated action. Real growth happens when your supply chain, product pages, and ad campaigns all work from the same playbook, driven by real-time analytics.
Sustainable growth starts with a solid data foundation, which enables smart optimization and, finally, powerful amplification. This unified approach transforms your digital shelf from a simple sales channel into your brand's most powerful asset.
Digital shelf analytics gives you the objective truth needed to win. It replaces guesswork with certainty, allowing you to move from reacting to market shifts to anticipating them—the key differentiator between brands that lead and those that follow.
For brands looking to build a truly integrated strategy, the next step is understanding how these insights fit into the bigger picture. Dive deeper by exploring our guide on the role of omnichannel analytics.
Ultimately, winning on the digital shelf means taking control of your brand’s story wherever customers are shopping. It’s about ensuring you are always visible, always in stock, and always compelling.
Ready to turn your data into market dominance?
Let’s Talk Growth.
Jumping into digital shelf analytics can feel like a massive undertaking, but it's a non-negotiable step for any brand serious about omnichannel growth. To help you navigate the process, we’ve put together answers to the practical questions we hear most from leaders building out their data-driven strategies.
The cost of a digital shelf analytics solution varies widely, but it’s more accessible than many think. Your investment typically depends on three main factors:
For smaller brands, starter plans can begin in the low thousands per year. As you scale, costs may climb into the tens of thousands. However, the ROI is often immediate—preventing just one major stockout on a key product can easily pay for the entire year's subscription.
Picking the right tool isn’t about finding the one with the longest feature list. It’s about finding the one that solves your most urgent business problems. Don't get distracted by flashy dashboards; focus on what will give your team insights they can act on.
The biggest mistake we see is brands buying a complex, enterprise-level platform when a more focused tool would suffice. Start by identifying your biggest blind spot. Is it pricing, search visibility, or content compliance? Let that guide your search.
When evaluating providers, always request a demo using your own products and top competitors. It’s the fastest way to see whose data is most accurate and whose interface fits your team’s workflow.
It's easy to get overwhelmed when you're just starting. The key is not to track everything at once. Instead, focus on the two or three metrics that will make the biggest, fastest impact on your revenue. For nearly every brand, that means starting here:
By focusing on this foundational trio, you can score quick wins, build momentum, and prove the value of digital shelf analytics to your entire organization.
At RedDog Group, we help brands turn this data into a clear roadmap for growth. Ready to build a strategy that drives real, measurable results?
Leave a comment: