
Published: March 2020 | Last Updated:October 2026
© Copyright 2026, Reddog Consulting Group.

ACOS and ROAS are the same efficiency metric expressed in opposite directions: ACOS is ad spend divided by attributed revenue, while ROAS is attributed revenue divided by ad spend, so a 25% ACOS equals 4.0x ROAS and a 50% ACOS equals 2.0x ROAS. Neither metric proves profitability, because both omit product cost, fulfillment, marketplace fees, and discounts.
The popular advice is to pick a good benchmark and optimize toward it. That's the wrong starting point. A CPG brand needs an advertising target its products can afford, not a dashboard number that looks respectable.
A rising ROAS can coexist with shrinking profit. If you discount the product, absorb higher fulfillment costs, or sell a less profitable pack configuration, better advertising efficiency doesn't necessarily leave more money in the business.
The trap is treating attributed revenue as the outcome that matters. Operators have a different obligation: paying for inventory, fulfillment, overhead, and the next production run. Contribution dollars after advertising connect campaign performance to those obligations.
Before debating ACOS vs ROAS, decide what you're authorizing the advertising team to do. Protect current-order contribution? Build demand for a launch? Clear inventory before carrying costs make the position worse?
Those are different assignments. They shouldn't share an undifferentiated account-level target.
| Decision | Lead metric | Required financial check |
|---|---|---|
| Set an allowable advertising ceiling | ACOS | Contribution available before advertising |
| Compare campaign revenue efficiency | ROAS | Comparable attribution and campaign purpose |
| Approve a promotion | Contribution dollars | Economics at the promotional selling price |
| Increase advertising spend | Incremental contribution | Inventory availability and replenishment economics |
This is the operating context behind the dashboard comparison.
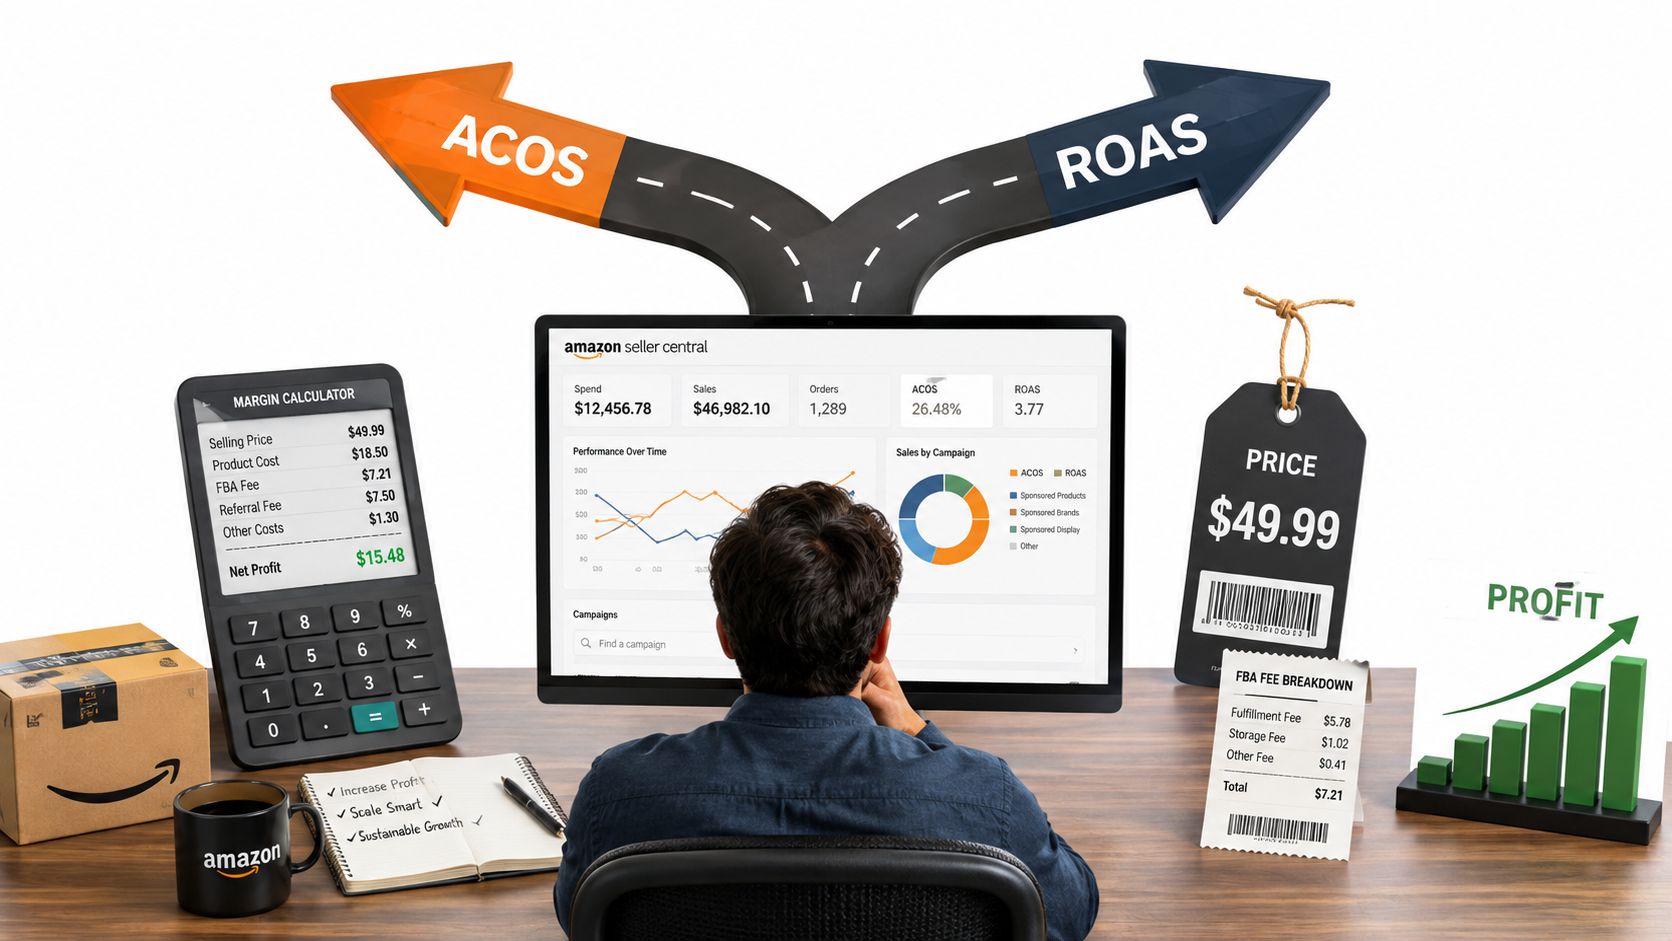
Advertising and finance shouldn't maintain separate versions of a profitable order. The person approving media spend needs the same landed-cost, fee, and promotional assumptions the operator uses to approve inventory.
Practical rule: Don't approve a campaign target until someone can explain what remains after the advertised order ships.
That doesn't mean every campaign must maximize immediate profit. It means growth investment needs an explicit purpose, an approved budget, and a way to judge whether it worked.
The right reporting emphasis depends on the work ahead. Foundation establishes trustworthy economics. Optimization improves how the brand allocates spend. Amplification expands what the business can support profitably. Choosing the metric comes after choosing the operating objective.
Advertising cost of sales, or ACOS, expresses advertising spend as a percentage of attributed advertising revenue. Return on ad spend, or ROAS, expresses that revenue as a multiple of advertising spend.
The operator's distinction is practical: ACOS reads like a cost allowance, while ROAS reads like a revenue-efficiency ranking.
The formulas and worked conversions below follow the ROAS calculation and inverse relationship with ACOS.
| Calculation | Operator interpretation |
|---|---|
| ACOS = advertising spend ÷ attributed advertising revenue × 100 | Advertising cost as a percentage of attributed sales |
| ROAS = attributed advertising revenue ÷ advertising spend | Attributed revenue generated per advertising dollar |
| ROAS = 1 ÷ ACOS expressed as a decimal | Convert the percentage to a decimal before inverting |
| 25% ACOS = 4.0x ROAS | The same performance, not competing outcomes |
| 50% ACOS = 2.0x ROAS | A different presentation of the same relationship |
For a worked conversion, express the percentage as a decimal, then invert it. Don't divide by the displayed percentage without converting it first.
The distinction is useful when an agency report uses return multiples but the marketplace operator manages an advertising allowance. Neither party needs a different efficiency target. They need consistent notation.
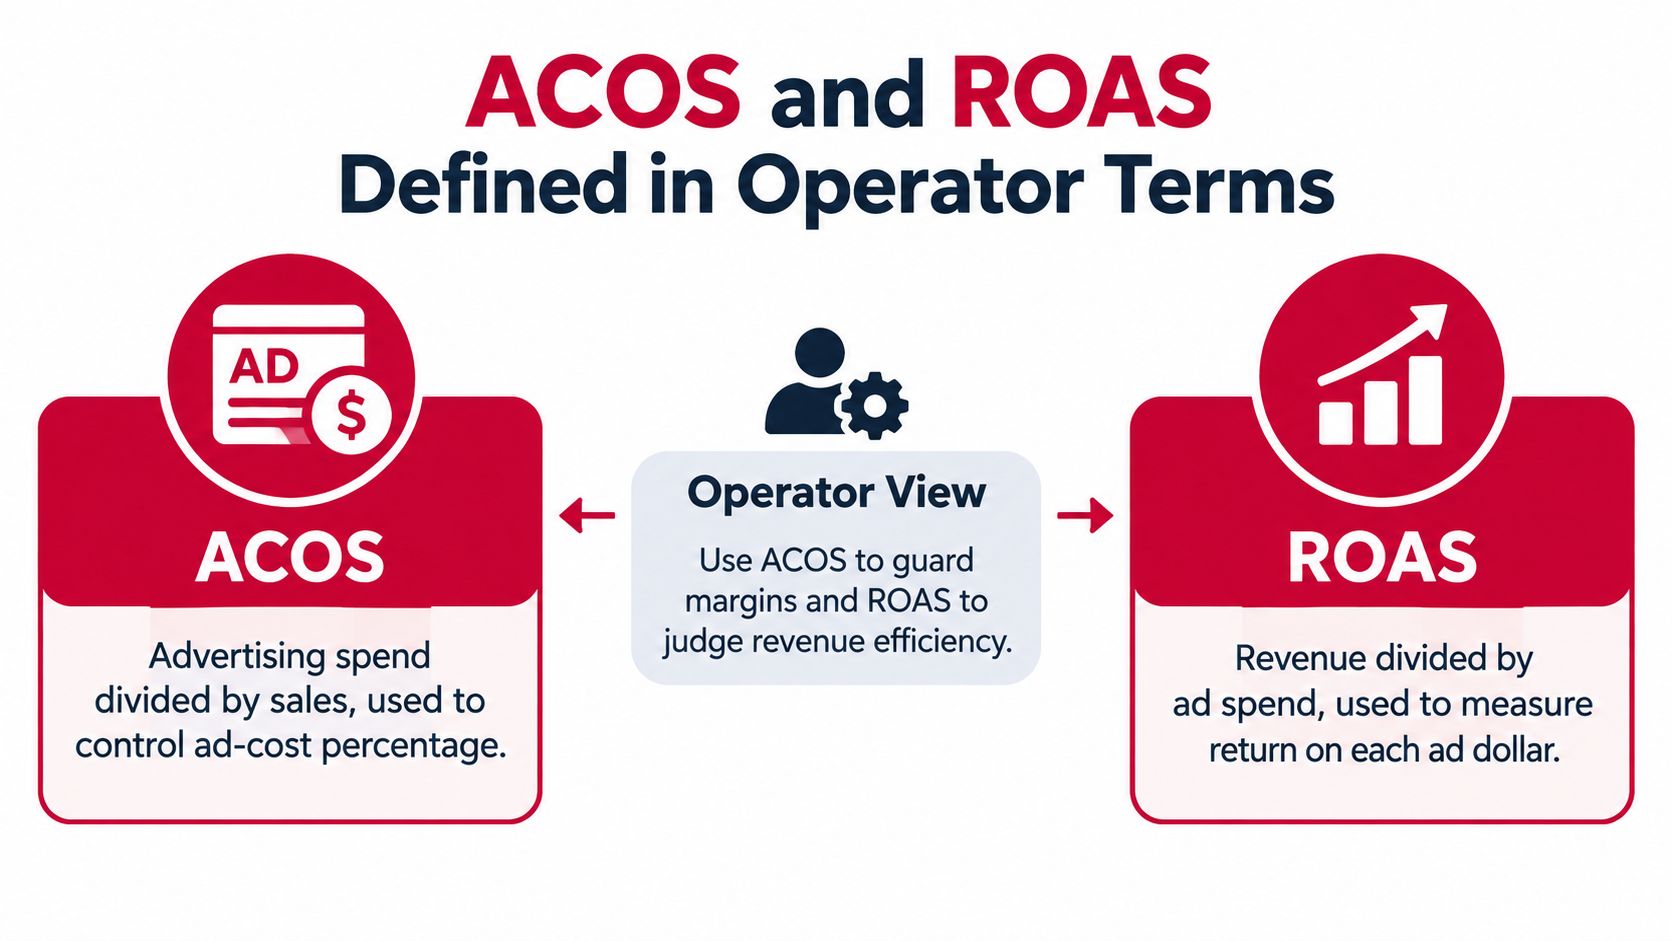
Use ACOS when asking how much of marketplace revenue advertising may consume. Use ROAS when communicating relative revenue efficiency across campaigns, provided the underlying reporting is comparable.
Neither ratio incorporates overhead or customer lifetime value. That matters when a team argues that repeat purchases will justify weak acquisition economics. Repeat contribution belongs in a separate model, not an assumption hidden inside the campaign target.
For teams expanding their reporting beyond the basic ratio, Adwave's resource on advanced metrics for evaluating ad returns provides an additional reference point.
The important discipline is keeping media efficiency, current-order contribution, and customer economics distinct. Combining them into a single reassuring return number makes it harder to identify which assumption needs attention.
Break-even ACOS starts with the money available before advertising, not the advertising account. Deduct the variable costs required to sell and deliver the product, then divide the remainder by the selling price.
Include COGS, marketplace fees, fulfillment, shipping, prep, expected refunds, and other variable deductions. The contribution-margin approach to marketplace advertising is the appropriate basis for that calculation.
The following illustration applies the ACOS relationship defined in Amazon's guide to advertising cost of sales.
| Line Item | Amount | Notes |
|---|---|---|
| Selling price | $30 | Revenue before the listed deductions |
| Product cost | $12 | Cost of the product |
| Marketplace and fulfillment fees | $6 | Channel and fulfillment expense |
| Shipping or handling | $3 | Additional variable expense |
| Contribution before advertising | $9 | Available to fund advertising and overhead |
| Advertising at 25% ACOS | $7.50 | Leaves $1.50 before overhead |
| Advertising at 40% ACOS | $12 | Exceeds the contribution available |
| Break-even ACOS | 30% | $9 ÷ $30 |
The difference between an efficient-looking campaign and a viable business is visible in the remaining contribution. The lower advertising-cost scenario leaves something behind, but that remainder still has to help fund the company.
Break-even ACOS = contribution before advertising ÷ selling price, expressed as a percentage. At that threshold, the advertised sale contributes nothing toward overhead or operating profit.
A campaign can cover its variable costs and still fail to support the business.
Set a stricter target when the channel must fund salaries, systems, financing costs, or retained profit. Don't describe variable-cost break-even as full business profitability.
Use a consistent method for calculating contribution margin before applying the result to media decisions.
An account average is useful for summarizing performance, but it's a poor substitute for product-level limits. Otherwise, profitable products can subsidize weak ones without anyone explicitly choosing that allocation.
ACOS is the cleaner control for an allowable advertising percentage. ROAS is the cleaner communication tool for ranking attributed revenue efficiency. Neither deserves to be the final approval criterion for spending.
The comparison below separates those jobs visually.
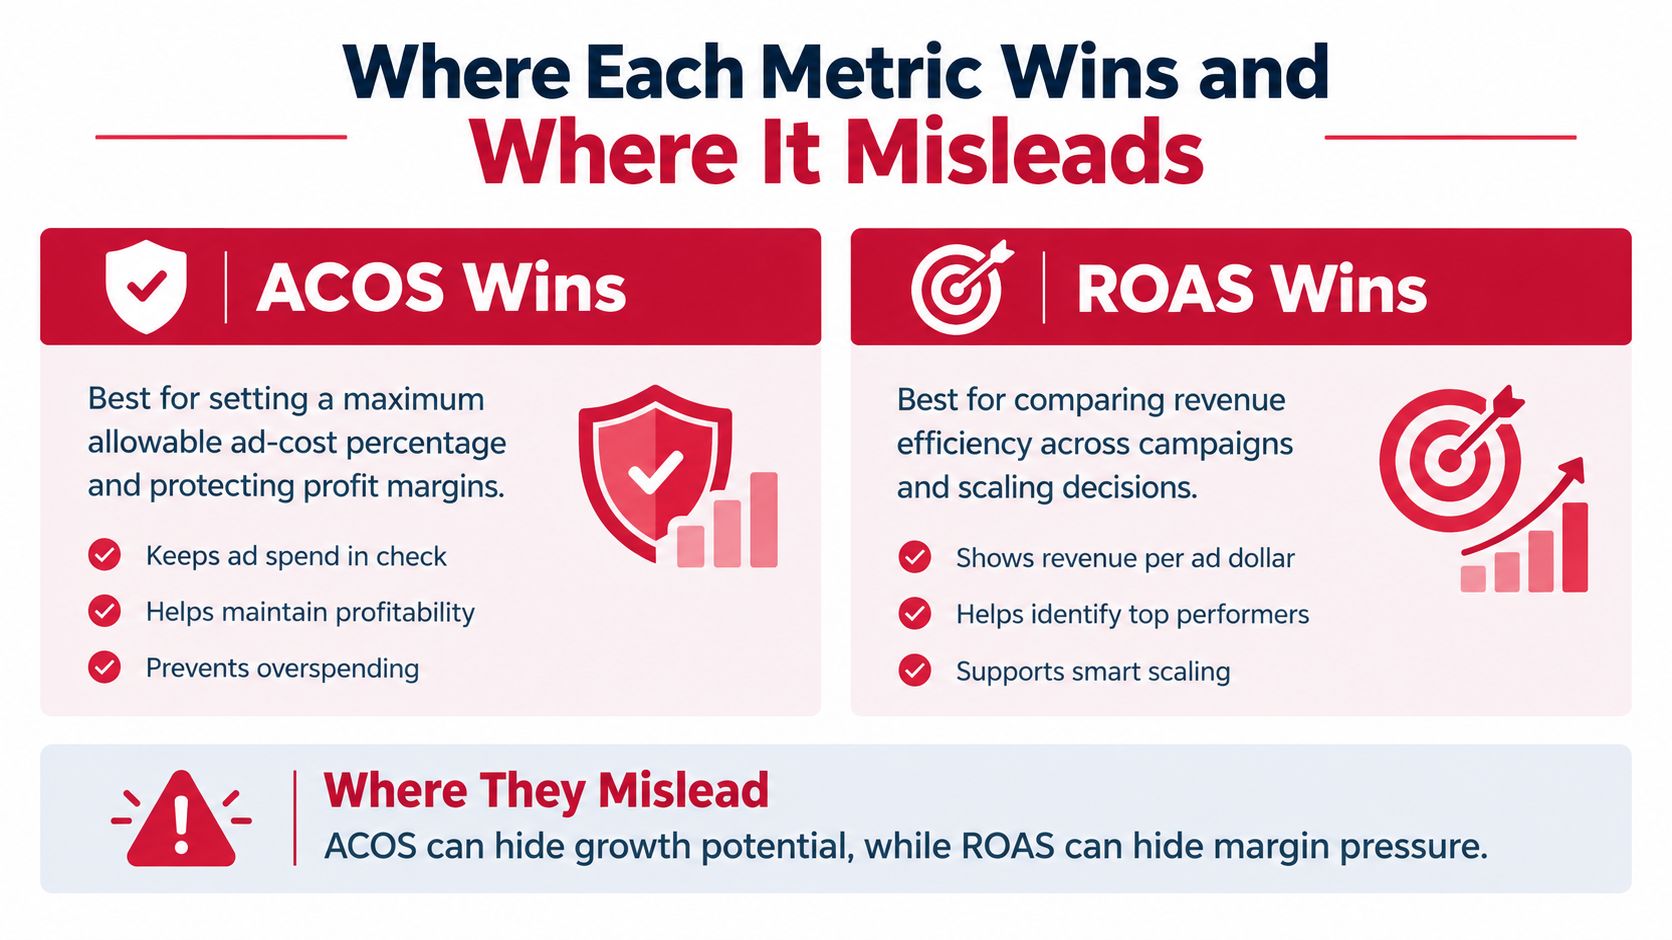
A return multiple makes a campaign portfolio easier to scan. It doesn't make Amazon-attributed sales, Walmart orders, DTC repeat purchases, wholesale shipments, and distributor revenue economically interchangeable.
For example, a marketplace order and a wholesale shipment don't carry the same deductions or operational responsibilities. Compare the efficiency ratios, but approve the allocation using the contribution each channel can retain.
| Situation | Useful reading | Misleading conclusion |
|---|---|---|
| High-margin product with elevated ACOS | Check remaining contribution | The campaign must be unprofitable |
| Low-margin product with attractive ROAS | Inspect the cost model | Strong return means strong profit |
| Launch campaign | Evaluate the approved growth objective | Immediate efficiency captures all value |
| Cross-channel budget review | Align reporting assumptions | Identical ROAS means identical economics |
For a separate paid-search context, Alpha Omega Digital's discussion of Google Ads profitability for Melbourne businesses is a useful companion resource. The operating question remains whether the business can afford the acquisition cost, rather than whether the return multiple looks attractive.
The person preparing the report may prefer ROAS. The person managing the P&L may prefer ACOS. That's not a strategic disagreement unless they're using different revenue or cost assumptions.
For an additional explanation of the metric comparison, the video below provides another reference.
The practical verdict isn't ACOS or ROAS. It's a clear efficiency metric attached to an explicit financial decision.
A promotion changes the advertising allowance. Leaving the old target in place after changing the selling price is a common way to approve spending against margin that no longer exists.
Amazon applies referral fees to the total sales price, including buyer-paid delivery or gift wrapping, while FBA fulfillment fees vary by category, size, and weight. Check the applicable Amazon referral and fulfillment fee schedule when modeling a price or pack change, rather than assuming every expense falls with revenue.
The illustration below shows how the same referral rate and largely fixed fulfillment and other costs produce a different advertising allowance at a reduced selling price.
| Order economics | Regular price | Promotional price |
|---|---|---|
| Selling price | $20 | $18 |
| Referral fee rate | 15% | 15% |
| Referral fee | $3 | $2.70 |
| Fulfillment and other variable costs | $7 | $7 |
| Contribution before advertising | $10 | $8.30 |
| Break-even ACOS | 50% | About 46.1% |
These are illustrative order economics, not a universal fee assumption. Use the actual category, dimensions, weight, and deductions for the product being promoted.
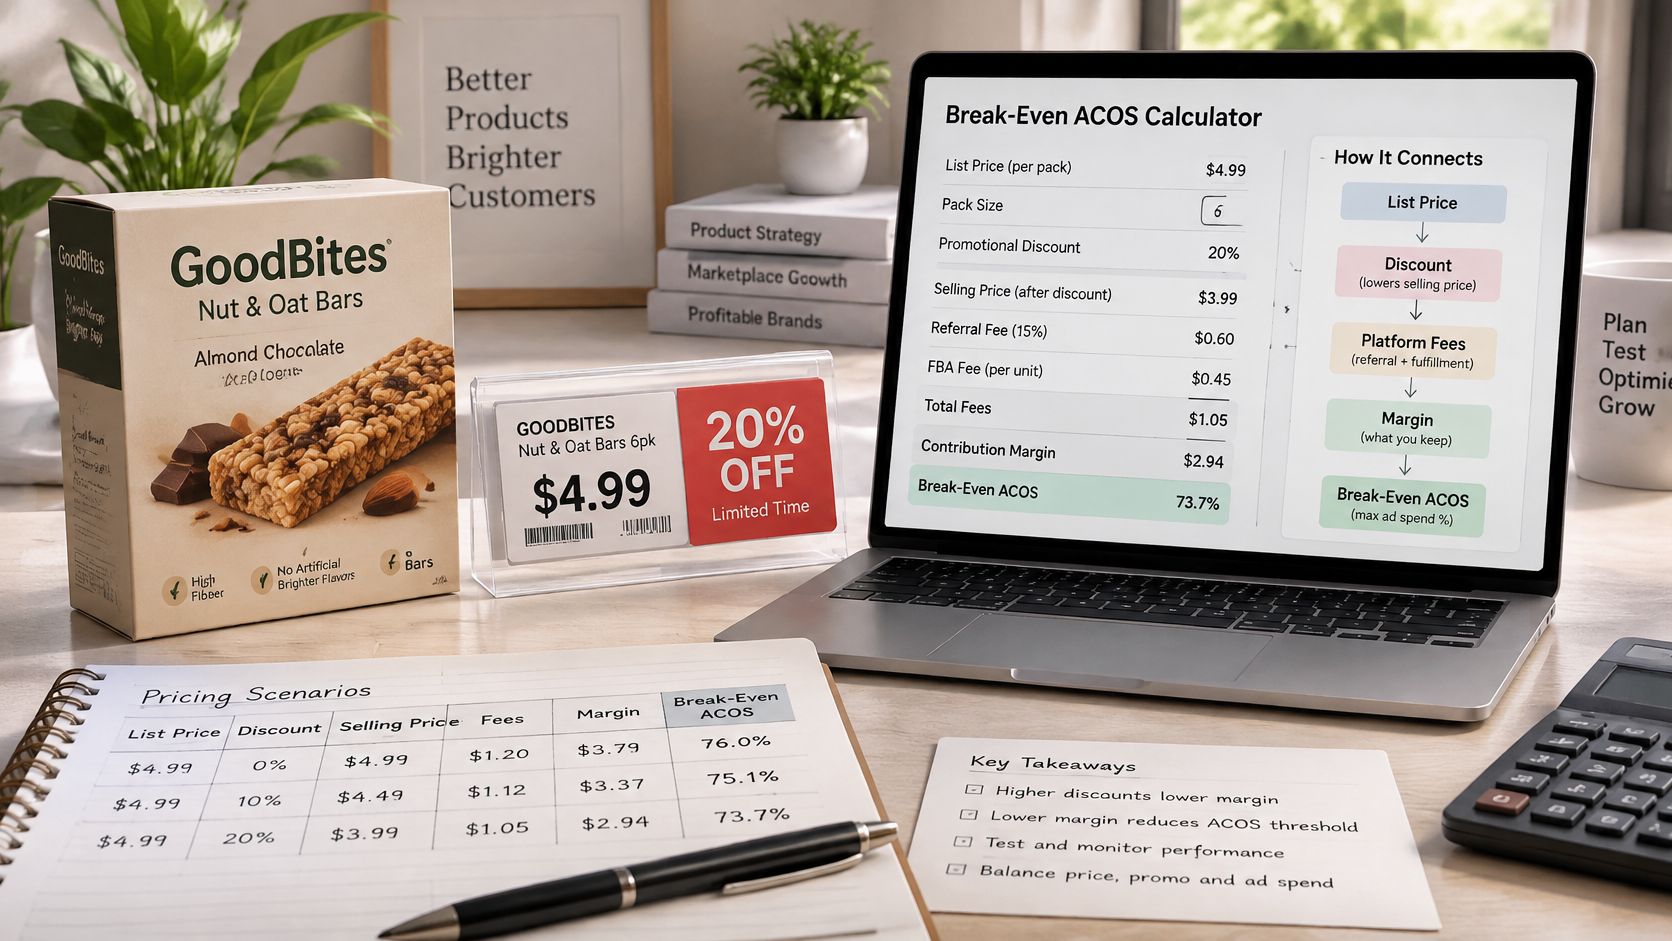
A discount can improve conversion, rank, and inventory velocity while reducing contribution per unit. The commercial question is whether the additional sell-through justifies the reduced earnings and advertising expense.
Don't make that decision from conversion rate alone. More orders can mean more work and less contribution if the price concession is doing most of the selling.
Promotion check: A better conversion rate isn't permission to spend against yesterday's margin.
Pack-size decisions deserve the same review. A larger pack may change selling price and product cost, but it may also change fulfillment economics. Merchandising and advertising teams should use the same pack-level model.
Historical fee announcements aren't a substitute for checking the active schedule. When costs change, update the model before deciding that a previously successful promotion remains worth funding.
Walmart advertising targets need Walmart economics. Copying an Amazon target onto a WFS product skips the work that determines whether the order can support the spend.
The Walmart Fulfillment Services schedule effective April 2025 lists the following standard fulfillment base fees and storage charges. Treat these as a dated schedule to verify before committing inventory.
| WFS charge | Published amount |
|---|---|
| Standard fulfillment, 1 pound or less | $3.45 per unit |
| Standard fulfillment, 2 pounds | $4.95 per unit |
| Standard fulfillment, 3 pounds | $5.45 per unit |
| January through September storage | $0.75 per cubic foot monthly |
| October through December, stored up to 30 days | $0.75 per cubic foot monthly |
| October through December, stored longer than 30 days | Additional $1.50 per cubic foot monthly |
Consider an illustrative 1-pound SKU selling for $18, with $8 available before fulfillment and advertising. Applying the listed $3.45 fulfillment charge leaves $4.55, producing a maximum break-even ACOS of approximately 25.3%, before storage, returns, and other deductions.
That qualification matters. The ceiling isn't a recommended operating target, and omitted deductions will make it too generous.
For the same illustrative product occupying 0.10 cubic feet, nine months of regular storage costs roughly $0.68 per unit of average inventory. A holiday-period unit stored beyond 30 days adds another $0.15 monthly at that cube size.
An aged unit and a freshly replenished unit can have different remaining economic value even when the advertising dashboard treats them alike. The operator needs to distinguish routine demand generation from spending intended to reduce inventory exposure.
A broader comparison of Walmart Marketplace and Amazon helps frame those channel differences, but the spending decision still belongs at SKU level.
Foundation means accurate weight, cube, and inventory records. Optimization improves sell-through and pack economics. Amplification should wait until the replenishment plan supports the demand being purchased, not merely the stock currently available.
Attribution assigns revenue to an advertising interaction. Incrementality asks how much additional business occurred because the advertising ran. Those aren't the same question.
The Amazon advertising benchmark discussion published by Headline describes a 2025 benchmark reporting 27.5% average ACOS and 3.64x ROAS across $29.6 million in managed spend and eight marketplaces, alongside another analysis reporting ROAS rising 10.16% to 3.14 and conversion rate improving 9.97% to 11.02%. Those attributed results don't establish how many purchases would have happened without advertising.
Branded search and retargeting can reach shoppers already likely to buy. Prospecting and new-product campaigns may look less efficient while contributing more net-new demand.
A useful explanation of revenue attribution helps teams understand what their reporting assigns. The next step is testing whether the spending caused additional contribution.
Strong attribution is evidence of an advertising interaction, not proof that the interaction created the purchase.
A launch doesn't need the same immediate-profit requirement as an established demand-capture campaign. It does need a defined investment thesis and a stopping rule.
Keep first-order profitability and deliberate growth investment in separate reporting lines. That lets the team assess whether a campaign is earning money today or purchasing a measurable opportunity for tomorrow.
Marginal efficiency matters during expansion. If additional spend reaches more expensive auctions or less-ready shoppers, evaluate the contribution from the added budget rather than relying on the blended account average. An attractive historical ROAS doesn't authorize unlimited incremental spend.
Lead with ACOS for spending limits and ROAS for revenue-efficiency comparisons. Give neither metric final authority over the P&L.
Keep exceptions visible. A planned launch investment belongs in an approved growth budget, not inside a blended target that makes routine trading look healthier than it is.
An internal operator, specialist adviser, or structured growth partner can own this process. The requirement is the same: someone must connect advertising decisions to operations, merchandising, pricing, and inventory.
Across Amazon, Walmart, DTC, wholesale, and distribution, use channel-specific economics rather than forcing every sale into a marketplace advertising ratio. The objective isn't to make every channel report identically. It's to understand what each channel contributes and what the next increment of growth will cost.
Reddog Consulting Group helps emerging and growth-stage CPG brands connect marketplace advertising, pricing, operations, and inventory planning around contribution margin. If you're a CPG founder or operator, book a free 30-minute strategy call as a working session to review your ACOS and ROAS targets, identify margin gaps, and assess which marketplace growth your inventory can support.
Leave a comment: