
Published: March 2020 | Last Updated:October 2026
© Copyright 2026, Reddog Consulting Group.

A CPG brand can post record sales across Amazon and Walmart and still feel short on cash. More orders can mean more fulfillment expense, advertising, discounts, and returns, while the sales dashboard keeps showing growth. If you can't see what each SKU contributes after the costs of serving it on each channel, you're scaling revenue without knowing whether you're scaling profit.
A useful contribution margin example starts with net revenue, then follows the costs all the way through fulfillment, transactions, returns, and marketing. That view can reveal why a product earns contribution on one channel but adds little, or even loses money, on another.
The growth story often sounds convincing: Amazon sales are up, Walmart is bringing in more orders, and the wholesale pipeline looks busy. The cash required to fulfill those sales is probably rising too. A product can look attractive measured against its manufacturing cost, then disappoint once you account for channel fees, freight subsidies, promotional funding, and advertising.
Gross margin alone won't answer the operating question. It shows how product costs compare with selling price, but it says nothing about what's left after the variable costs of delivering and selling a particular order. Those costs differ by channel and sometimes by order. A sale that works through a wholesale pallet shipment can have completely different economics as a single-unit marketplace order or a direct-to-consumer parcel.
The right unit for the analysis is the SKU and channel-order, not the company's blended revenue line. Research from MIT's Omnichannel Supply Chain Lab reports that most retailers it surveyed cannot state the cost of fulfilling a specific online order, and that fulfillment strategy changes cost composition, especially picking and last-mile activities. Brands carry the same blind spot: an average fulfillment assumption can conceal which orders are expensive to serve.
Operator's rule: Don't approve a promotion or expand an assortment on sales growth alone. First work out what each incremental order contributes after its variable costs.
Competitive context helps explain why a channel's pricing or promotion pressure is shifting. Teams evaluating those shifts can pair their SKU-level margin reporting with a resource on competitive intelligence data sources and KPIs. The point is to connect what competitors are doing to the costs and net revenue behind your own orders. A sales increase is not proof of profitable growth.
Think of contribution margin as the money an order leaves behind after paying the costs that vary with that sale. That remaining amount helps cover fixed expenses such as salaried support, rent, and software. It isn't net profit, but it tells you whether a sale is helping pay the bills or leaving less behind than your gross margin suggested.
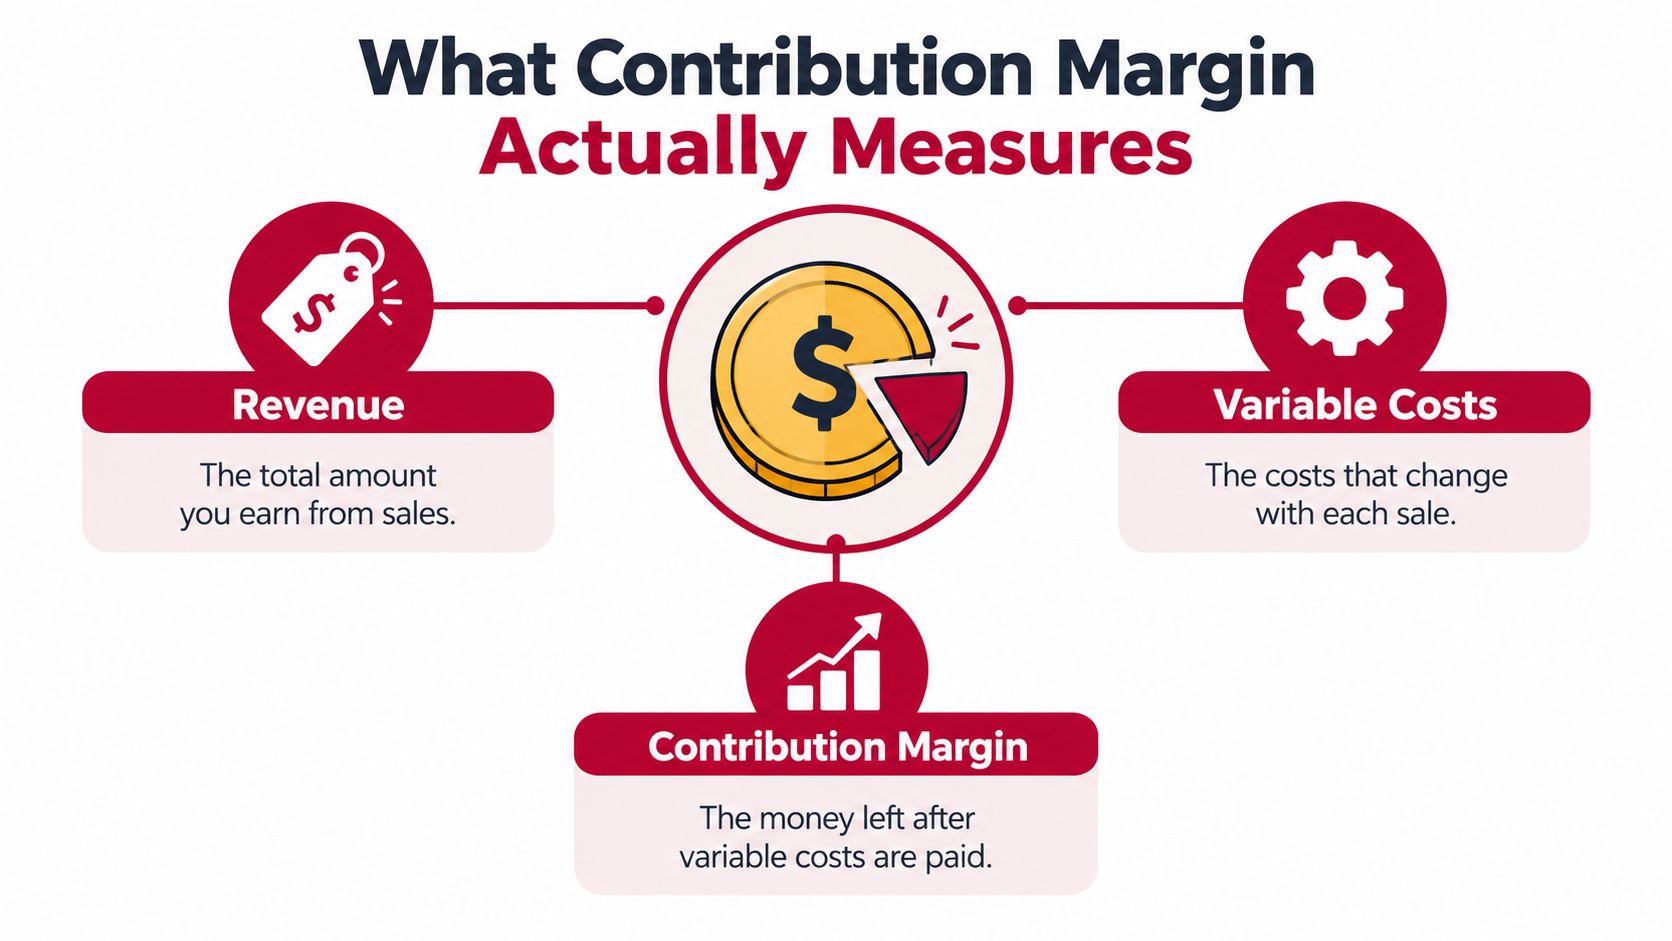
The basic formula is:
Contribution margin = net selling price − variable costs
To express it as a share of net selling price, divide contribution margin by net selling price. In the worked SKU example below, an $8 contribution margin on a $24 net selling price gives a 33.3% contribution-margin ratio.
The distinction from gross margin matters in day-to-day decisions. Gross margin generally subtracts product cost. Contribution margin goes further, accounting for variable costs that can change with the channel or order, such as marketplace fees, payment processing, fulfillment, shipping subsidies, returns, advertising, and promotional funding. A sale can therefore show a healthy product-level margin while producing much less contribution after the costs of reaching and serving the customer.
If you're reviewing a supplier quote, product cost and gross margin can be useful. If you're deciding whether to fund a promotion, add a marketplace SKU, or shift more orders to DTC, you need the costs tied to those sales. For a broader perspective on the relationship between ecommerce margins and profitability, see this guide to protecting Shopify profitability.
Don't confuse contribution margin with final business profit. Fixed expenses still need to be covered. But contribution margin gives you a practical way to judge whether an additional order helps cover those expenses, and whether more volume on a given channel is likely to help or hurt.
Blending channel costs into one average is the fastest way to hide a losing channel. A workable SKU calculation starts with net selling price, not the list price shoppers saw before discounts, then assigns every cost that varies with the sale to the channel and order type where it occurred. If the same SKU moves through Amazon, wholesale, and DTC, build a separate waterfall for each rather than pooling the costs.
The worked example below uses a $24 net selling price. Product cost is $8, and the remaining variable costs cover marketplace fees, fulfillment, a shipping subsidy, advertising, and expected returns. After all of them, the order leaves an $8 contribution margin.
| Cost Component | Amount | % of Net Price |
|---|---|---|
| Net selling price | $24.00 | 100% |
| Product cost | $8.00 | 33.3% |
| Marketplace fee | $3.60 | 15.0% |
| Fulfillment cost | $1.20 | 5.0% |
| Shipping subsidy | $1.80 | 7.5% |
| Advertising cost | $0.90 | 3.75% |
| Expected returns | $0.50 | 2.1% |
| Contribution margin | $8.00 | 33.3% |
The product-only math leaves $16. The full cost stack cuts that in half, and the remaining $8 is what the order contributes toward fixed costs and, past that point, operating profit. Two channels can show identical product margins and still land in very different places at this line.
The variable-cost list rarely ends with the line items in a clean table. Depending on the channel and the agreement, it may also need to account for wholesale fees, payment processing, fulfillment labor, promotional funding, storage, chargebacks, co-op funding, or compliance costs. Classify costs by how they behave in your actual operations, and allocate them the same way every period. A cost left out of the waterfall does not leave the business; it just makes a weak channel look healthier than it is.
Two practical checks tighten the numbers. Reconcile your unit cost assumptions against an outside reference such as Monopack ltd's cost per unit advice. For marketplace orders, confirm the fulfillment expense matches the actual fee and shipping setup; RedDog's guide to fees for Fulfillment by Amazon is a useful reference for that review.
A channel can bring in revenue while destroying incremental profit if you leave out its cost to serve.
The right comparison follows the same SKU through each channel's economics. Start with net revenue, subtract landed product cost, then account for transaction and fulfillment costs, followed by variable marketing. This layered view is useful because it shows where a channel's contribution changes, rather than hiding every cost in one blended margin.
One practical naming convention is CM1 for landed product economics, CM2 after fulfillment and transaction costs, and CM3 after variable marketing. Treat those labels as internal reporting layers, not universal accounting rules. The important part is that each layer has a clear cost definition and that you apply it consistently.
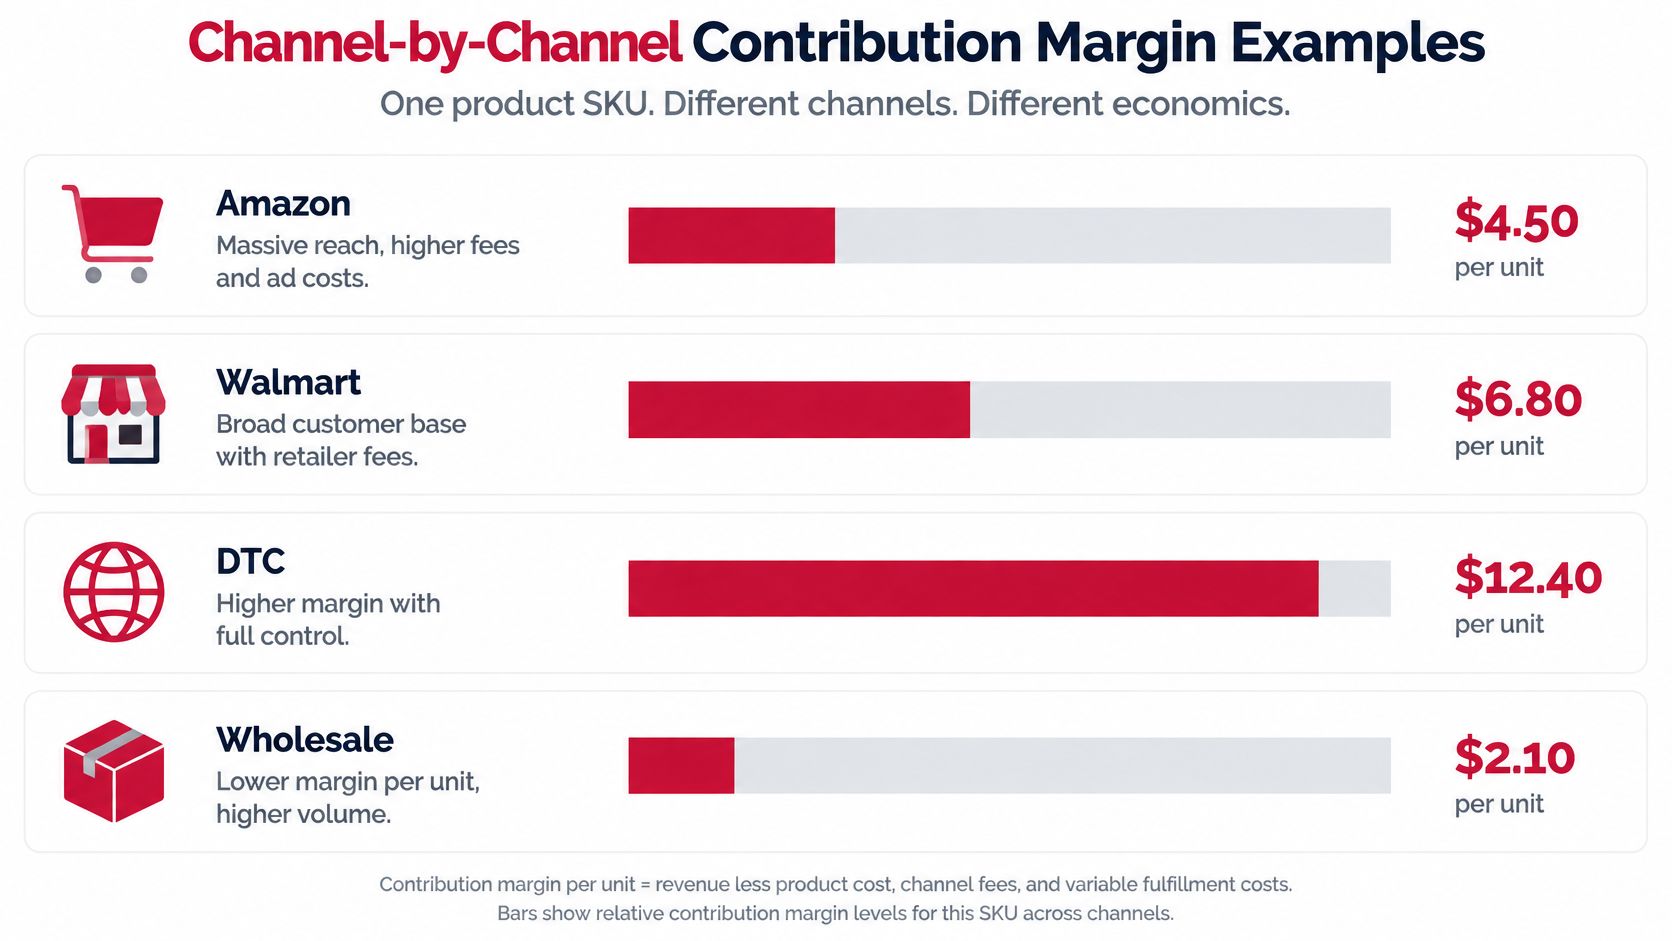
For Amazon, include the selling price, referral and fulfillment fees, advertising, returns, and any promotional funding allocated to the order. For Walmart, model referral fees, fulfillment, storage where applicable, returns, and advertising. For DTC, account for payment processing, pick-and-pack, shipping subsidy, returns, and channel-specific advertising. For wholesale, use the net revenue after the terms and funding you support, then include product, freight, and other variable costs tied to the order.
The $24 example above provides one fully specified unit calculation, but it isn't a universal set of channel rates. To see how mix changes contribution using the available channel example, consider a portfolio where Amazon contributes $8 per unit, wholesale contributes $4, and DTC contributes $14. These amounts illustrate the comparison, not a claim that every SKU or account will produce those margins. The Walmart result should be calculated from its own sales, fee base, fulfillment, storage, returns, and marketing inputs rather than guessed from another channel.
Practical rule: Compare contribution dollars per order and in total, not just contribution-margin percentages. A high percentage on a low-volume channel may contribute fewer dollars than a lower percentage on a channel with more profitable volume.
The method is to build one row per SKU and channel, calculate each cost layer, and then compare both per-unit contribution and the expected contribution from the planned mix. RedDog's channel profitability analysis is relevant to this kind of channel comparison.
The video below is an additional visual resource for thinking through channel contribution.
Contribution margin earns its place in planning when you tie it to break-even volume. The calculation is:
Break-even units = fixed costs ÷ unit contribution margin
Take a brand carrying $120,000 in launch-period fixed costs for creative, catalog setup, retail onboarding, and salaried support. At an $8 contribution margin per unit, it needs 15,000 incremental units to break even. At $12 per unit, it needs 10,000 units. The higher contribution cuts required volume by 33.3%. Those figures follow the standard break-even logic described in OpenStax's managerial-accounting explanation.
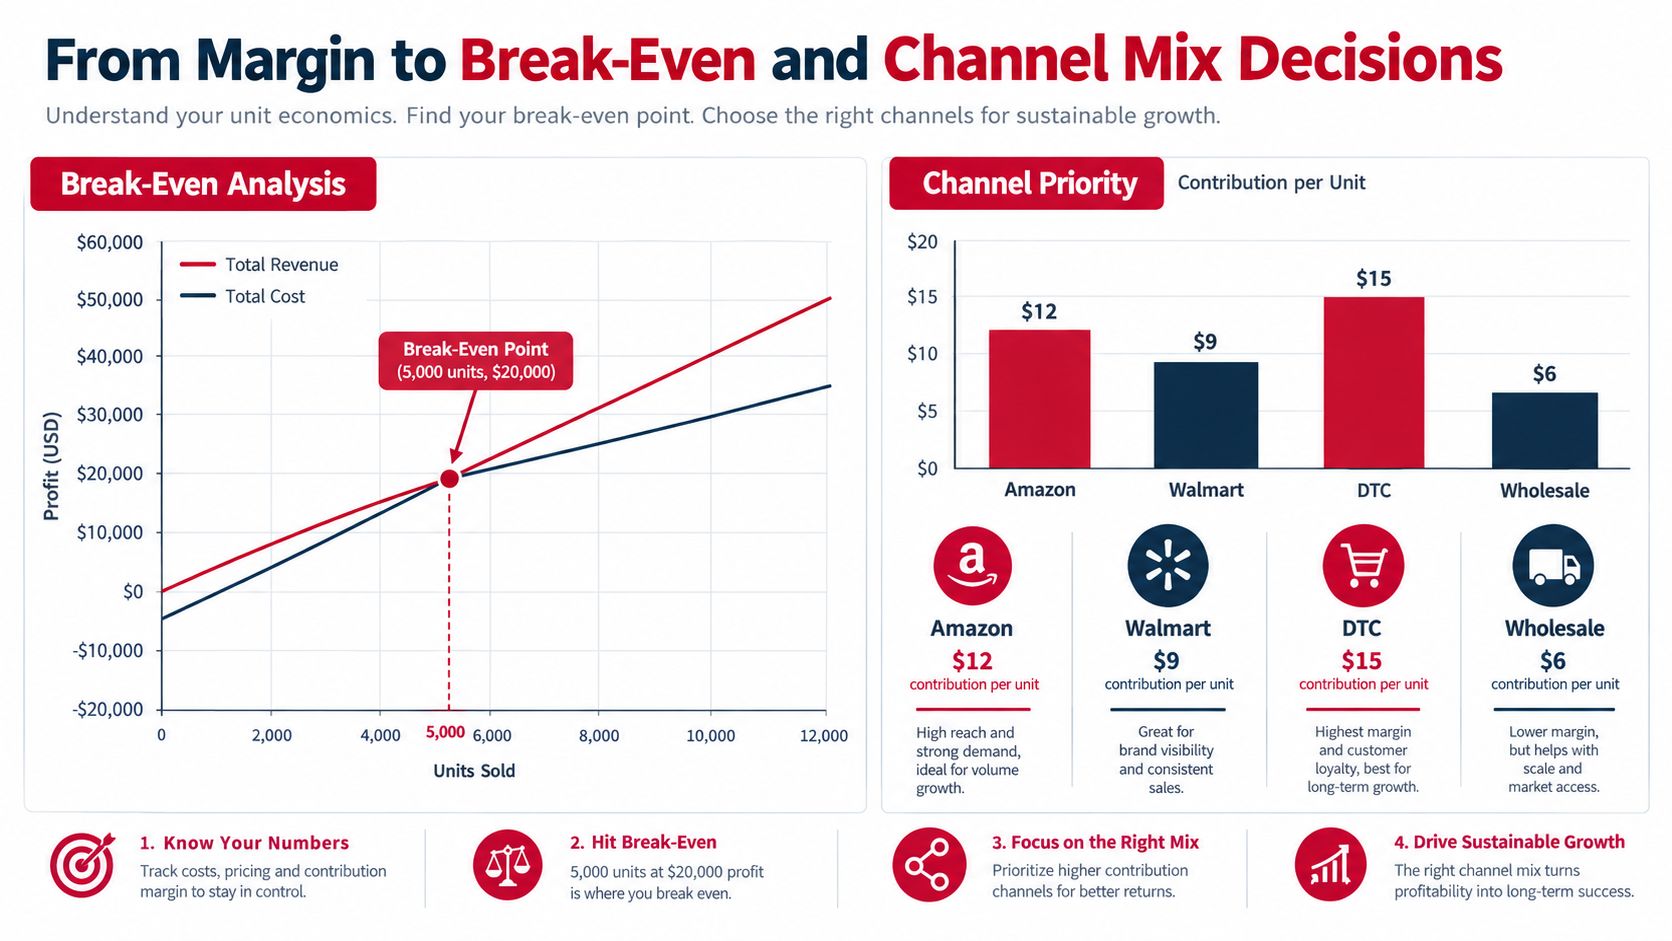
A portfolio's blended contribution depends on how much it sells through each channel. If Amazon contributes $8 per unit, wholesale $4, and DTC $14, a shift toward wholesale drags the weighted average down unless other economics change. I've watched brands celebrate a revenue record while their blended contribution fell, because the growth came from the lowest-margin channel. Revenue went up. The dollars available for fixed costs went down.
Weight the average by expected unit mix and each channel's contribution per unit. Then run break-even under realistic mixes, including the drag from promotions and paid media, because a plan built on the best-case mix will miss the moment retail buyers take more volume than forecast.
OpenStax also describes target-profit volume as fixed costs plus desired profit, divided by contribution margin per unit, using the same framework cited above. That turns the exercise into a real test: can the planned mix support a profit target, or does it only cover launch costs?
Every promotion and advertising plan needs a minimum contribution threshold. Before approving one, ask how much contribution survives the discount, the funding, and the media cost, and how many extra units are required to cover the fixed commitment. More volume is only useful when the incremental contribution justifies the cost of obtaining and serving it.
A fee table you modeled in January can be wrong by Q3. Amazon's stated U.S. FBA changes for 2026 include an average fee increase of $0.08 per unit sold, and that average hides the spread across size tiers and price bands. Small standard-size products priced between $10 and $50 face an expected increase of $0.25 per unit; large standard-size products in the same band face $0.05. On a $20 product carrying $4.00 in pre-ad contribution, the $0.25 increase strips out 6.25% of that contribution before advertising, storage, returns, or promotions even enter the math (Amazon's FBA fee information). I rerun SKU models every time a fee table publishes, because a quarter per unit on a high-velocity item adds up fast.
Walmart's fee structure needs a different check. Walmart says it charges no setup, monthly, or hidden marketplace fees, and referral fees generally range from 6% to 15% depending on category and total sales price. It also says Walmart Fulfillment Services shipping costs 15% less than the competition on average, while storage charges scale with product volume and time in the fulfillment center (Walmart Marketplace pricing). Cheap shipping doesn't win the comparison if inventory sits.
Walmart calculates referral fees on gross sales, including shipping and handling charges, while excluding separately stated taxes. Take a $24 item with $6 of customer-paid shipping: a 10% referral rate produces a $3.00 fee, rather than the $2.40 that results from applying the rate to the item price alone. Across 10,000 units, that gap is $6,000 (Walmart's explanation of referral fees on shipping and tax). I've watched brands reconcile their first marketplace statement and discover the fee-base assumption had been inflating the margin model for months.
Reconcile statements to the actual fee base. Never assume the percentage applies only to product price.
Amazon referral fees also depend on category and can use a percentage of the total price or a minimum amount, whichever is greater (Amazon's pricing information). Price moves behave differently than the model predicts when a minimum fee kicks in. Returns, dimensional-weight tiers, free-shipping thresholds, bundles, and discounting reshape order economics the same way, so model them as scenarios instead of treating shipping and returns as fixed costs. For promotion economics specifically, run a structured trade-spend optimization review before committing funding.
The best-selling SKU isn't automatically the best growth investment. The better choice is the one that produces more total contribution after fees, fulfillment, returns, discounts, and the cost of acquiring the sale.
A margin model earns its keep only when it changes what gets funded.
Foundation: lock landed cost, net selling price, returns, promo funding, ad spend, and SKU-by-channel contribution baselines before any growth debate. Keep list price out of the margin line and make every input traceable to an order, statement, or invoice. I've seen teams argue for weeks because two reports put the same rebate in different layers.
Optimization: test price, pack size, fulfillment path, return rate, coupon depth, and paid-media cost as one system. Re-verify each channel's fee and fulfillment mechanics against current published schedules before locking tests. A slow mover can look fine on unit margin and still bleed cash once storage, returns, and funding stack up.
Amplification: scale only the SKUs and channel mixes that clear your minimum contribution threshold. Rerun break-even when fee tables change, when a promotion shifts mix, or when retail media starts taking a larger share of the sale. If a bestseller adds orders but lowers total contribution, fund the quieter SKU that carries the month.
For qualified CPG founders or operators, book a free 30-minute strategy call as a working session to review SKU margins, marketplace performance, and growth plans.
Reddog Consulting Group helps CPG brands assess channel profitability and build growth plans around margin, marketplace performance, and operating realities. If you're ready to review your SKU-by-channel contribution waterfall, visit Reddog Consulting Group to discuss a free 30-minute working session.
Leave a comment: