
Published: March 2020 | Last Updated:October 2026
© Copyright 2026, Reddog Consulting Group.

Most brands chase revenue growth because it's easy to celebrate and easy to report. The harder number is margin growth, because it reveals how much of each sales dollar survives the cost stack.
In CPG and omnichannel retail, that distinction matters. A brand can sell more units, open more channels, and still end up with less cash if fees, freight, returns, discounts, and ad spend grow faster than the sales line. That's why the right question isn't whether revenue rose, it's whether the business kept more of each dollar after the right costs came out.
Margin growth means a company keeps a larger percentage of each revenue dollar after a defined group of costs. For gross margin, the standard formula is gross profit divided by revenue, where gross profit equals revenue minus COGS as defined in SEC accounting guidance.
That definition is useful, but it's not enough for a CPG brand selling across Amazon, Walmart, DTC, and wholesale. A channel can look healthy on a consolidated P&L while pulling economics lower because the new revenue comes from discounted orders, pricey fulfillment, or returns-heavy assortment. Revenue growth measures scale. Margin growth measures how efficiently that scale converts into profit.
A lot of founders treat sales growth as proof that the machine is working. In reality, a business can grow revenue while weakening the economics underneath it, especially when the mix shifts toward channels with heavier variable costs. That's common in omnichannel brands, where one marketplace may reward volume and another punishes it through commissions, storage, or service fees.
Practical rule: if a channel adds revenue but doesn't improve retained dollars after variable costs, it isn't real growth. It's just more work.
A better test is to ask what changed inside the business, price, cost, mix, or channel contribution. That's where the true margin story lives. The same logic shows up in broader corporate data too, where the Federal Reserve noted that U.S. nonfinancial corporate profit margins rose from 11.3% in Q1 2020 to 19.2% in Q2 2021, then fell to 15.1% by Q4 2022 Federal Reserve analysis. The point isn't the exact cycle, it's that margins move with pricing, labor, input costs, demand, and the fixed-cost structure, not just sales volume.
For a CPG operator, that means margin growth has to be tracked at the channel level, not just at the company level. Amazon, Walmart, DTC, wholesale, and distribution each carry different economics. The same $1 in revenue can create very different outcomes depending on fees, fulfillment, and return behavior.
Gross margin tells you whether product sales cover direct production cost. Contribution margin tells you whether those sales are worth scaling after all the variable costs tied to the order are included. That difference is where many marketplace brands get fooled.
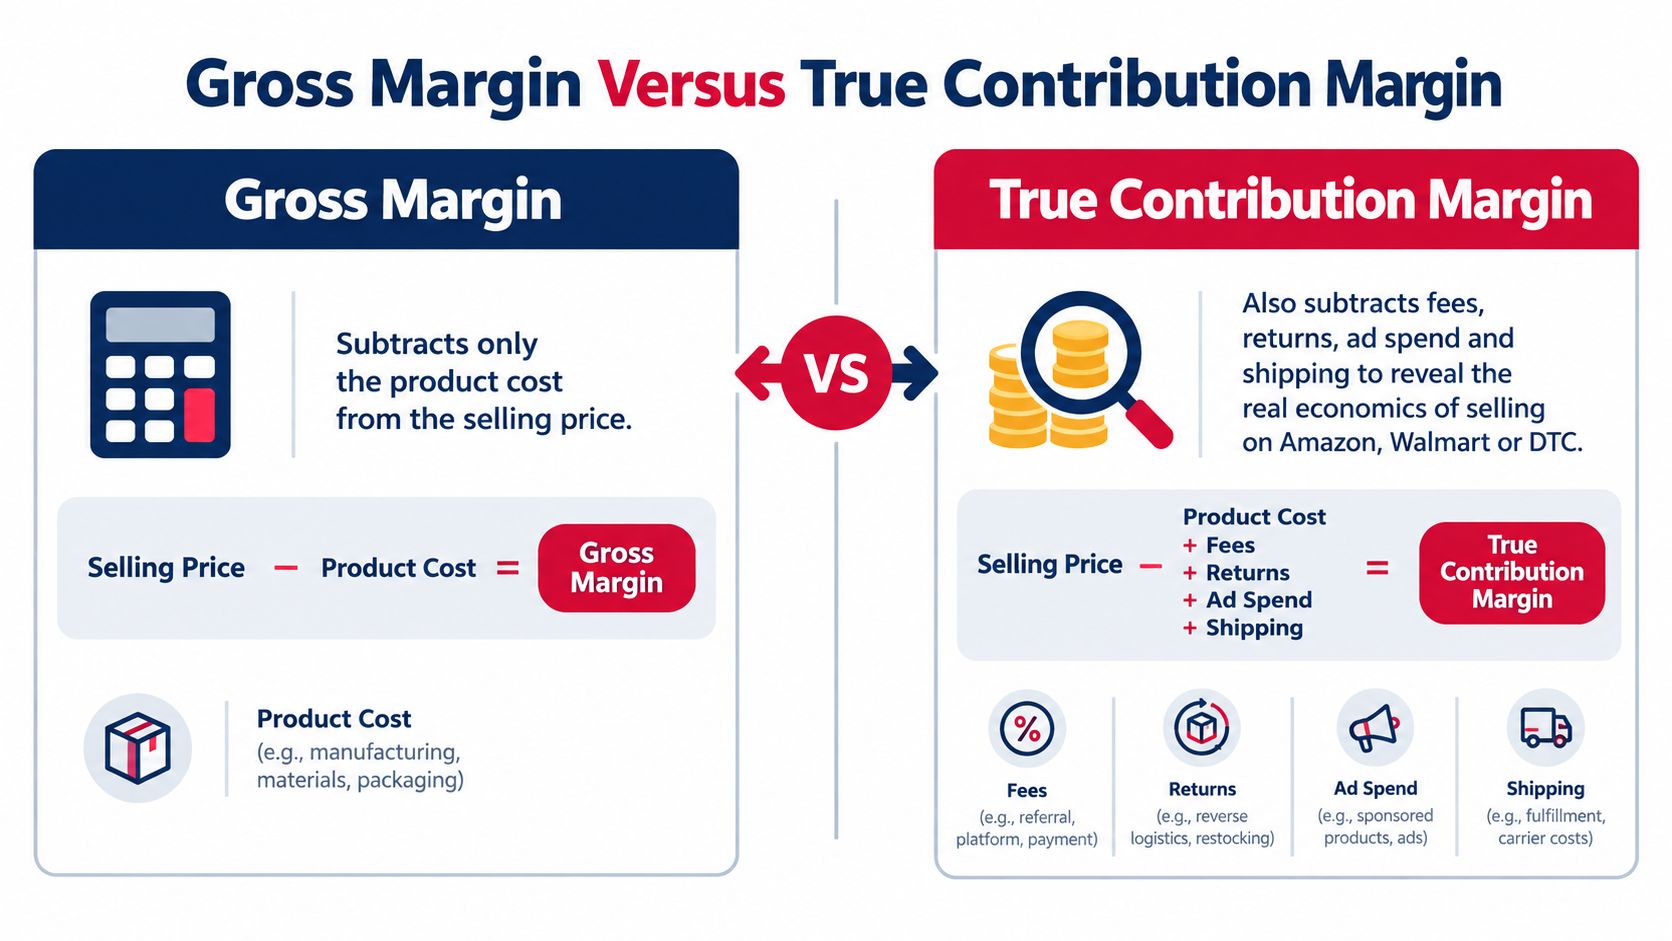
A simple gross margin view might show a strong product. A contribution view asks harder questions, including what it costs to get that unit picked, packed, shipped, advertised, and returned. As this contribution-margin guide explains, contribution margin subtracts all variable costs tied to each sale, not only production COGS, and that's what funds fixed costs and profit.
For omnichannel CPG, the variable stack often includes product cost, inbound freight, outbound freight, pick-and-pack, referral or fulfillment fees, payment processing, promotional discounts, commissions, and expected return costs. If you leave those out, you're not modeling the business, you're just modeling the factory gate.
A practical way to pressure-test a SKU is to compare the accounting margin with the actual order-level margin. If a product looks efficient on paper but becomes weak after marketplace deductions, it may be contributing less than you think. That's why the right metric is contribution margin per order, per SKU, and per channel.
If you want a clean primer before building your own model, find your contribution margin with Jumpstart Partners. The math matters because the business decisions are different once you know the true number.
Gross margin can improve while contribution margin falls. That happens when a brand raises list price but also leans harder on ads, discounts, or high-fee channels. It can also happen when a SKU mix shifts toward products with better accounting margin but worse fulfillment economics.
The internal takeaway is simple. Use the companywide gross margin for broad reporting, but make contribution margin the decision layer. That's also why the detailed breakdown in RedDog's contribution margin guide is useful as a working reference, because channel decisions live and die at the unit level.
The first lever is pack architecture. Some SKUs look clean in a spreadsheet until fulfillment fees, low-price surcharges, or storage costs get applied to a small or entry-level pack. Bigger pack sizes, multi-packs, and threshold-friendly bundles often protect margin better than a blunt price increase, because they spread fixed handling costs across more revenue.
Minimum order values matter just as much in DTC. If a basket is too small, shipping and payment costs eat the contribution quickly, especially when promo codes are layered on top. Raising the free-shipping threshold, tightening discount rules, or steering shoppers toward bundles can improve the economics without changing the core product.
Don't chase more orders if each order loses money after variable costs. Fix the order economics first.
Advertising should also be measured against incremental contribution, not ROAS alone. ROAS can look healthy while the order still underperforms after fees and returns. If the product only makes sense with heavy paid support, the media plan isn't scaling profit, it's subsidizing volume.
The strongest margin improvements often come from portfolio discipline, not blanket cuts. Reducing low-quality volume, raising minimum order values, improving pack architecture, or shifting demand toward profitable SKUs may create stronger margin growth than acquiring more customers Deloitte retail outlook.
That's where the channel mix work gets real. Amazon might be the best place to win discoverability, while wholesale may be better for velocity, and DTC may be better for data and repeat purchase. Each channel deserves its own margin bridge, because the same product can have very different economics depending on how it gets sold.
For brands that need tighter inventory discipline while working through these levers, savings from automated inventory is a useful lens. Automation doesn't fix bad unit economics on its own, but it can reduce the operational drag that keeps margin from showing up in the P&L.
Amazon and Walmart punish sloppy price architecture in different ways. Amazon calculates its referral fee as a percentage of the total sales price, not just the sticker price, and that base includes the buyer's payment for the product, delivery, and gift wrapping charges, while taxes from Amazon's tax-calculation service are excluded Amazon fee policy.
Before repricing below $10 on Amazon, know what the platform charges. See how much it costs to sell on Amazon how much it costs to sell on Amazon, because the fee base moves with price.
A low-priced item can look fine on gross margin and still be weak after marketplace deductions. If the item price gets trimmed in a promotion, the referral fee base changes too. A small pricing move can cut both top-line dollars and the contribution dollars needed to cover fulfillment, storage, and advertising.
Walmart Fulfillment Services adds $1 per unit when the retail price is below $10 Walmart WFS fees. That surcharge turns pack size and price architecture into margin decisions, not just merchandising choices. A sub-$10 item can still play a role in the assortment, but the operator has to know whether the economics hold after fulfillment, commissions, and returns.
Selling below the channel's contribution-clearing point is the real mistake, regardless of price.
Bundle strategy matters here. If a single unit triggers a fee penalty, a multi-pack or larger size can move the item over the threshold and recover margin. The same logic applies to assortment strategy, where a brand should decide which SKUs belong on which platform instead of copying the same shelf set everywhere.
The operating question is whether the item can support itself in the channel after all deductions. If not, the answer is not always to walk away. Sometimes the answer is to repackage, reprice, or move the SKU into a channel where the economics fit the business model better. The wrong move is assuming every sale is a good sale.
Inventory velocity is a margin issue, not just a supply chain issue. Slow stock ties up working capital, adds storage cost, and eventually forces markdowns or liquidation. That's why a gross-margin report can still look healthy while the business pays for stagnant product in the warehouse.
Walmart's WFS schedule makes the risk visible. Storage rises to $2.25 per cubic foot per month for inventory aged 366–450 days and to $7.50 per cubic foot per month for inventory older than 450 days WFS pricing schedule. That kind of aging turns velocity into a direct margin lever, especially for bulky items that move slowly.
Slow sellers don't just consume space. They also create planning errors, reorder mistakes, and eventual markdown pressure when the team realizes demand was overestimated. If the SKU is large, the storage burden compounds faster than what many anticipate.
A good operating habit is to track weeks of cover, aging by SKU, and contribution after storage. That tells you which items deserve replenishment and which ones should be liquidated before they drag the channel down. A brand that clears inventory faster usually has better cash conversion, better warehouse utilization, and less need to fund dead stock.
The internal issue is often not demand alone, it's discipline. A SKU that sells slowly in one channel may still be fine if it has strong repeat purchase or strategic role. But if it's consuming storage and never earning its keep, it's a margin leak. This is the sort of decision that what is inventory velocity should trigger inside the operating cadence, not after the quarter closes.
Margin growth doesn't happen because a team “pushes harder.” It happens when the business fixes unit economics before it leans into spend and distribution. That's why the cleanest operating sequence is Foundation → Optimization → Amplification.
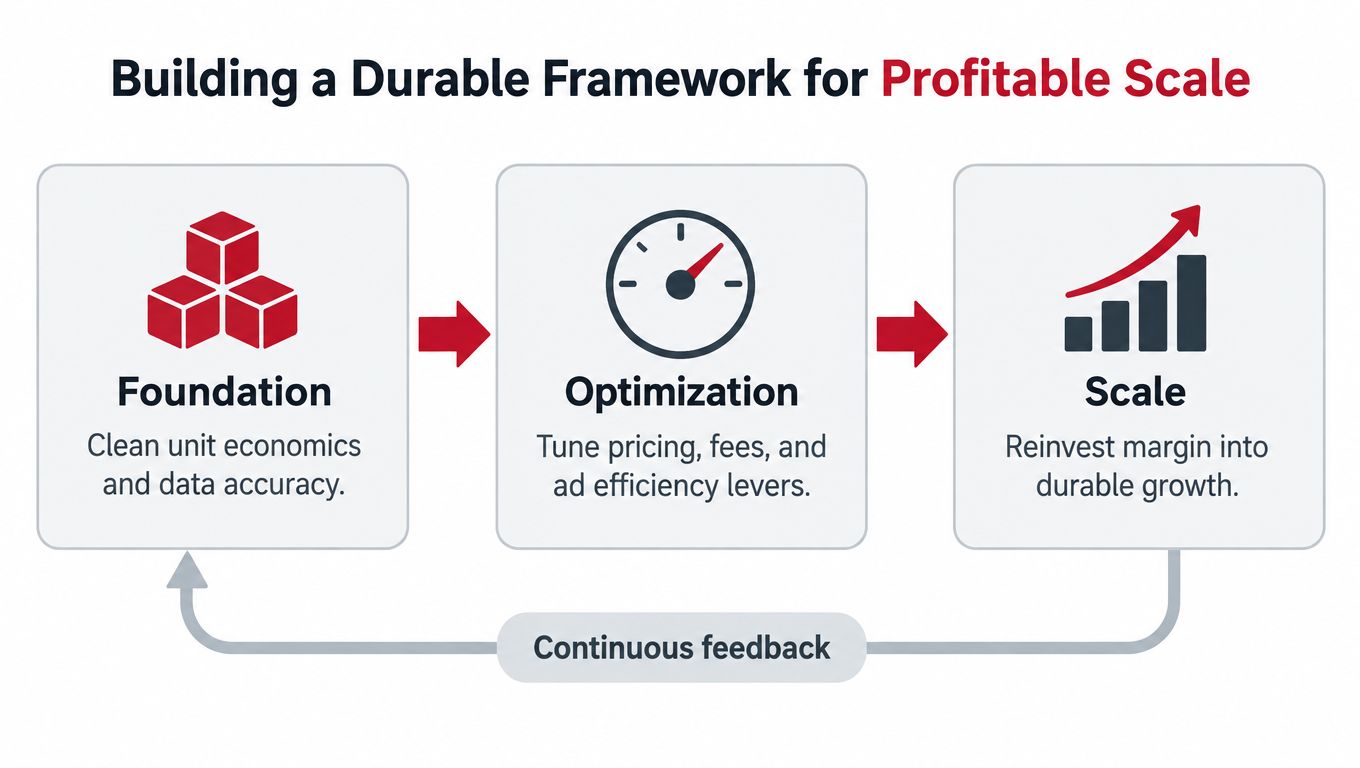
Foundation is where the books, fee assumptions, and SKU economics get cleaned up. Amazon has already signaled that FBA fees will increase by an average of $0.08 per unit sold in 2026, and a brand with only $0.50 of contribution per unit would give up 16% of that contribution if it absorbed the increase without changing its economics Amazon fee update. That's not a reason to panic, but it is a reason to model SKU-level sensitivity before budgets get locked.
Optimization is where pricing, pack size, fees, and ad efficiency get tuned. If a product only works when fees stay flat, it isn't resilient. If a product still clears contribution after a fee reset, it's a better candidate for scale.
Amplification should be reserved for products that have already passed the unit-economics test. That means the team knows the contribution threshold, understands which channels support it, and can adjust when fees or freight change. Scaling a weak SKU just grows losses faster.
Profitably scaling a brand means repeating what works after the economics are proven, not before.
If you're pressure-testing channel economics, inventory flow, or marketplace pricing, RedDog Consulting Group works through that exact margin-first process with CPG brands. A qualified founder or operator can book a free 30-minute strategy call to review margin, marketplace performance, or growth planning in a working session.
Leave a comment: