
Published: March 2020 | Last Updated:October 2026
© Copyright 2026, Reddog Consulting Group.

A new retailer has agreed to carry your product. Amazon sales look healthy, your DTC store is acquiring customers, and a distributor is asking for more inventory. The obvious response is to open every door.
That's how many CPG brands create a revenue problem disguised as growth. Each new channel adds fees, service requirements, price pressure, inventory commitments, returns, deductions, and operational work. Distribution only improves the business when the incremental profit and strategic value outweigh the complexity it introduces.
Managing channels well means deciding where each unit should go, what role each channel should play, and how much contribution remains after every variable cost. The right question isn't “Where can we sell more?” It's “Where can we create profitable, incremental demand without weakening the rest of the system?”
A founder may see a wholesale order for $100,000 and assume the business just gained $100,000 in sales. The finance team sees wholesale discounts, freight, promotional funding, deductions, chargebacks, payment timing, and the inventory needed to fulfill the order. If the brand also supports retail media or absorbs returns, the apparent win can become a thin-margin transaction.
The same issue appears in marketplaces. A product can generate attractive revenue while commissions, fulfillment, storage, advertising, returns, and damaged inventory consume most of the available contribution. DTC can offer stronger pricing control, yet it carries payment processing, pick-and-pack, shipping subsidies, customer acquisition, and service costs. A distributor can create reach, but the brand gives up margin and visibility into the consumer.
Practical rule: Never approve a channel because it adds volume. Approve it because the channel adds profitable, strategically useful demand.
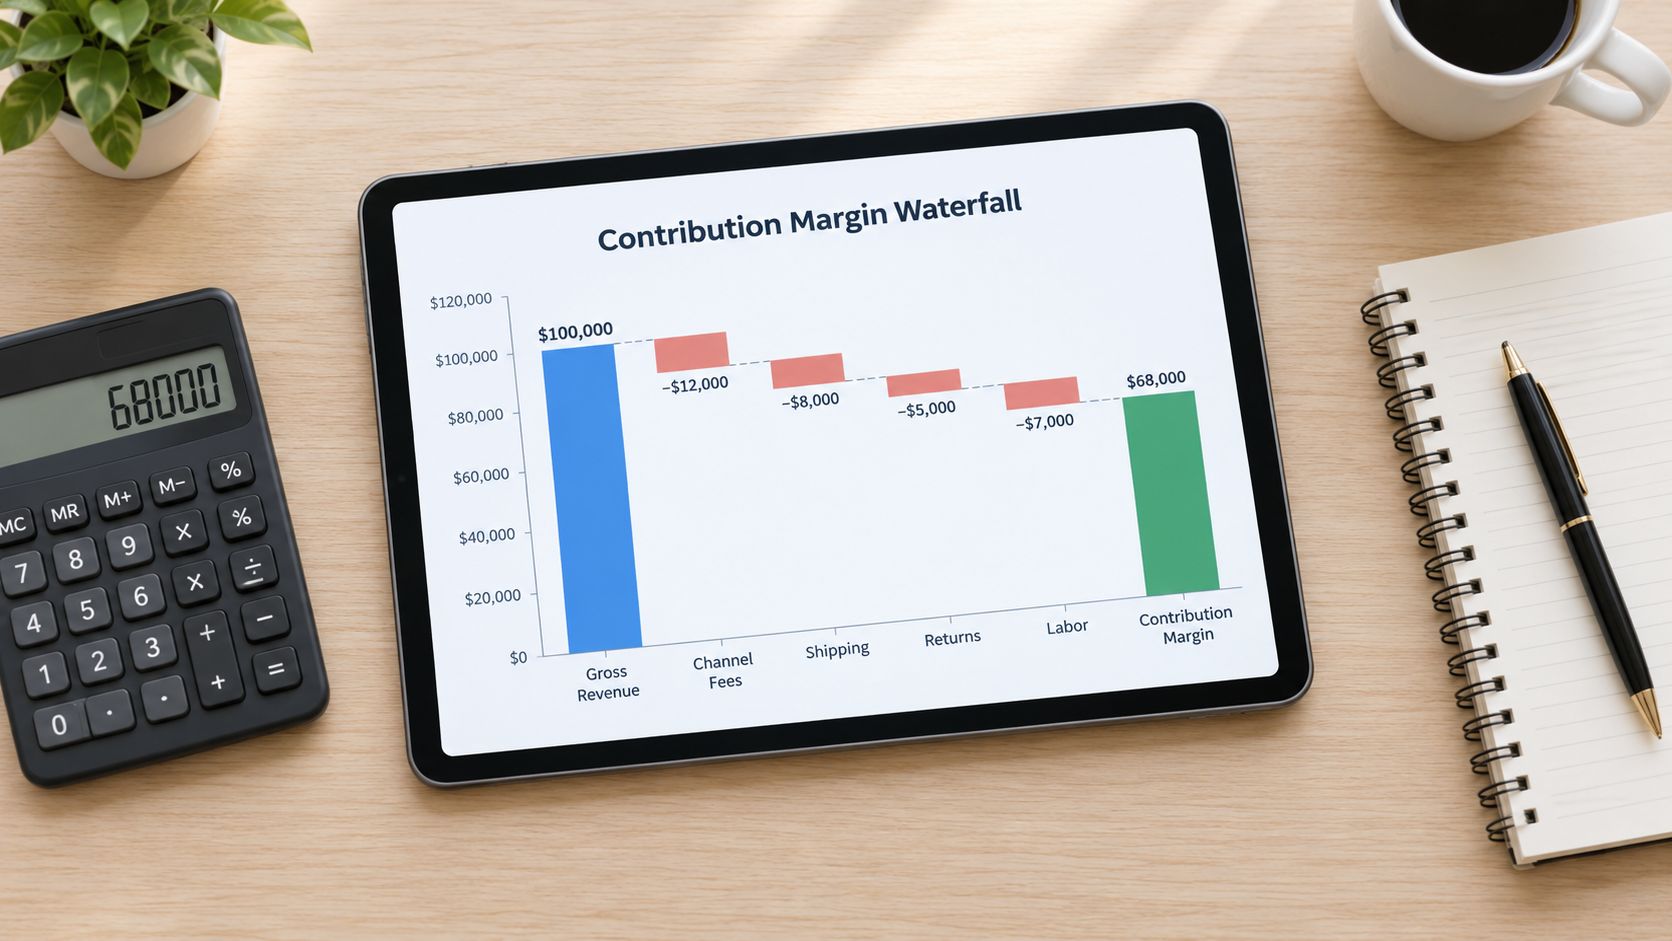
Start with a channel-level contribution-margin waterfall. Deduct manufacturing or landed product cost first, then account for discounts, marketplace commissions, fulfillment, freight, returns, trade spend, chargebacks, retail media, advertising, and working-capital costs. The calculation should distinguish incremental sales from demand that merely migrated from a higher-margin channel.
Channel conflict makes this harder. A marketplace promotion may reset a shopper's reference price and pressure wholesale or DTC pricing. A retailer-exclusive pack can reduce direct comparison, but it also creates extra item complexity and forecasting requirements. Brands that want a deeper treatment of competing routes should review how channel conflict affects growth decisions.
The practical test is contribution margin per constrained unit, not gross sales by account. Add inventory velocity, cash-conversion timing, service requirements, and customer-acquisition value to the review.
A smaller channel mix can outperform broad expansion when partner economics and operational friction destroy profit. More doors don't automatically mean more money. More unmanaged obligations do.
Omnichannel distribution doesn't mean publishing the same catalog everywhere. It means giving each channel a defined job while coordinating availability, pricing, content, and fulfillment.
U.S. retail data makes the point. In the first quarter of 2025, e-commerce sales reached an estimated $300.2 billion, representing 16.2% of total retail sales, and grew 6.1% year over year, compared with 4.5% growth for total retail sales. The digital channel expanded faster, but approximately 83.8% of retail sales still occurred outside e-commerce during the quarter, according to the U.S. Census Bureau's retail e-commerce report.
Stores still provide physical availability and trust. Marketplaces capture discovery and demand. DTC can support customer data and retention. Wholesale offers reach, while distributors can extend coverage where the brand can't efficiently operate directly. The job is to assign these roles deliberately.
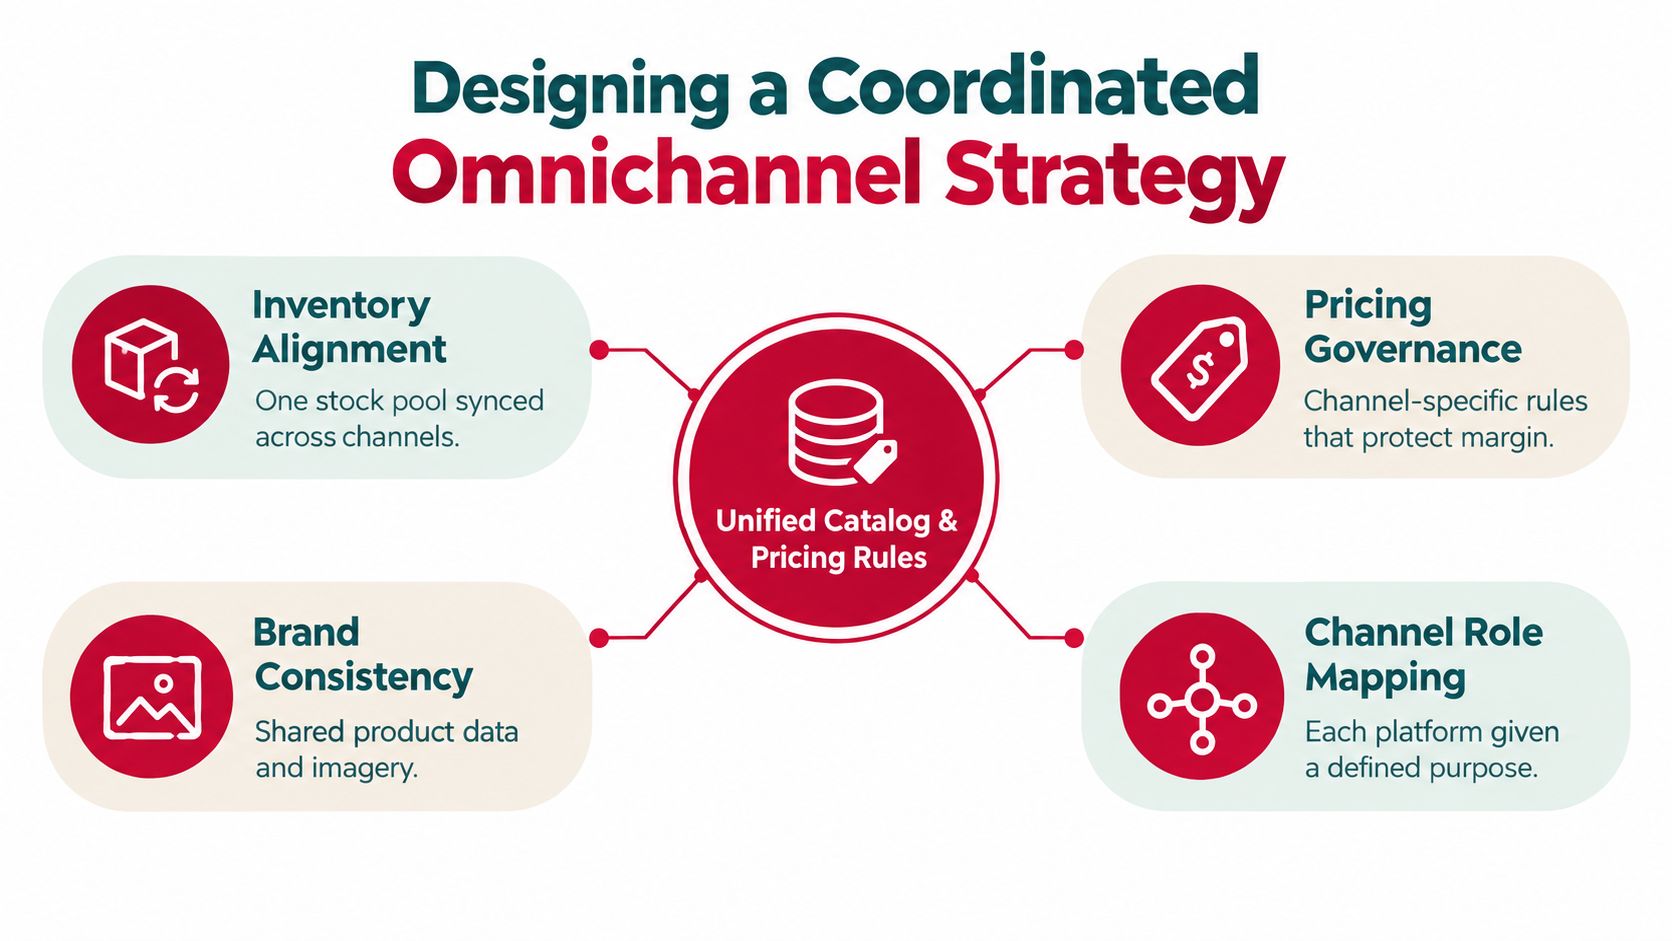
For each channel, document:
McKinsey's ConsumerWise survey of 5,103 consumers across the United Kingdom, Germany, Spain, Italy, and France in May 2024 found that approximately 50% preferred an omnichannel shopping model, while nearly 80% reported trading down, mainly by changing quantities, pack sizes, or retailers, as described in this European consumer research. That behavior makes inconsistent pack formats, pricing, or availability commercially dangerous.
Channel-specific assortments reduce direct comparison. A marketplace may carry a trial pack, DTC may carry a subscription or premium bundle, and wholesale may receive a case configuration designed for efficient replenishment. Coordinated calendars prevent one channel from training customers to wait for another channel's discount.
For a broader view of driving seamless customer growth, the same principle applies: consistency matters, but identical execution across every touchpoint does not. A practical omnichannel retail strategy gives each channel a distinct economic and customer role.
Fulfillment fees often look manageable at the account level and painful at the SKU level. Amazon and Walmart both simplify execution through managed fulfillment, but the cost mechanics differ by product size, price, storage duration, region, and inventory velocity.
| Fee Component | Amazon FBA (2026) | Walmart WFS |
|---|---|---|
| Fulfillment fee change | Effective January 15, 2026, average increase of $0.08 per unit, or less than 0.5% of average selling price, according to Amazon's FBA fee information | Fulfillment fees apply under the WFS fee structure |
| Small standard-size products priced from $10 to $50 | Increase of $0.25 per unit | No equivalent fee detail stated in the cited WFS schedule |
| Large standard-size products priced from $10 to $50 | Increase of $0.05 per unit | No equivalent fee detail stated in the cited WFS schedule |
| Products priced above $50 | Average increases of $0.51 for small standard-size and $0.31 for large standard-size products | No equivalent fee detail stated in the cited WFS schedule |
| Storage | Regional rates listed at $0.57 per cubic foot per month in the West and $0.48 in the East and South | $0.75 per cubic foot per month from January through September |
| Seasonal or aged storage | Storage varies by season and product profile | October through December inventory held beyond 30 days receives an additional $1.50 per cubic foot per month |
| Later aged inventory | Storage exposure increases with time and volume | Starting June 30, 2026, inventory stored 366 to 450 days incurs $2.25 per cubic foot per month, and inventory stored more than 450 days incurs $7.50 per cubic foot per month |
| Fuel and logistics surcharge | A 3.5% surcharge on FBA fulfillment fees begins April 17, 2026, according to Amazon's surcharge notice | No matching surcharge is specified in the cited WFS fee schedule |
| Fee scope | FBA fulfillment includes picking, packing, shipping, customer service, and returns | WFS charges fulfillment and storage without signup or monthly subscription fees, according to Walmart's WFS fee guide |
A $12 item with only $2.00 of pre-fulfillment contribution margin would lose 12.5% of that margin from a $0.25 fee increase. That calculation comes directly from the fee change and the stated pre-fulfillment margin, not from a general marketplace benchmark.
Walmart's aged-storage schedule shows the other side of the problem. At the 366-to-450-day rate, 100 cubic feet of inventory would cost $225 per month, and after 450 days the same volume would cost $750 per month, excluding fulfillment and product carrying costs. WFS can improve delivery execution, but it can't fix weak demand.
Amazon's April surcharge also hits unevenly. If an existing FBA fulfillment fee is $6.00, a 3.5% surcharge adds $0.21 per unit. On a product with $2.50 of contribution before fulfillment, that charge reduces available contribution by 8.4%. On a product with $10 of contribution, the reduction is 2.1%.
Use Amazon FBA and Walmart WFS as SKU-level economic decisions, not as flat channel-margin assumptions. Brands comparing operational control and fulfillment models can also examine FBM versus FBA.
A contribution-margin waterfall answers a more useful question than “Which account sells the most?” It shows what remains after the costs required to create and fulfill each incremental order.
Start with net selling revenue, not the list price. Subtract discounts, retailer allowances, coupons, and promotional funding before evaluating the product's economic contribution.
For a $30 product with $9 remaining after wholesale or manufacturing cost, marketplace referral fees, fulfillment, expected returns, and other variable costs, break-even ACOS is 30%. At 20% ACOS, advertising consumes $6 per order and leaves $3. At 35% ACOS, advertising consumes $10.50 and produces negative $1.50 contribution.
The calculation is straightforward:
Contribution dollars available before advertising ÷ selling price = break-even ACOS
A campaign can increase sales and worsen cash contribution at the same time.
Review the waterfall by SKU, channel, and fulfillment method. Then classify each channel as a profit engine, a strategic reach channel, a trial channel, or a volume driver that needs intervention. Under the Foundation stage, establish reliable economics first. Optimization should improve price, conversion, advertising, and fulfillment efficiency. Amplification belongs only where additional demand remains profitable.
McKinsey's survey of more than 250 CPG companies found that winning companies allocate resources to high-growth channels, refine route-to-market models, use advanced analytics, and invest in omnichannel capabilities. Winners outgrew their categories by 2 to 16 percentage points while maintaining lower sales costs. In Europe, winners averaged 8 percentage points faster growth and at least 9 percentage points higher EBITDA than other CPG companies, according to McKinsey's channel-management analysis.
Connecting every sales channel to one inventory system solves overselling. It doesn't solve allocation.
When Amazon, Walmart, DTC, wholesale, and distributors compete for the same units, the brand needs rules for scarce stock. Those rules should reflect contribution margin per constrained unit, service-level commitments, lead-time variability, stockout cost, and strategic value.
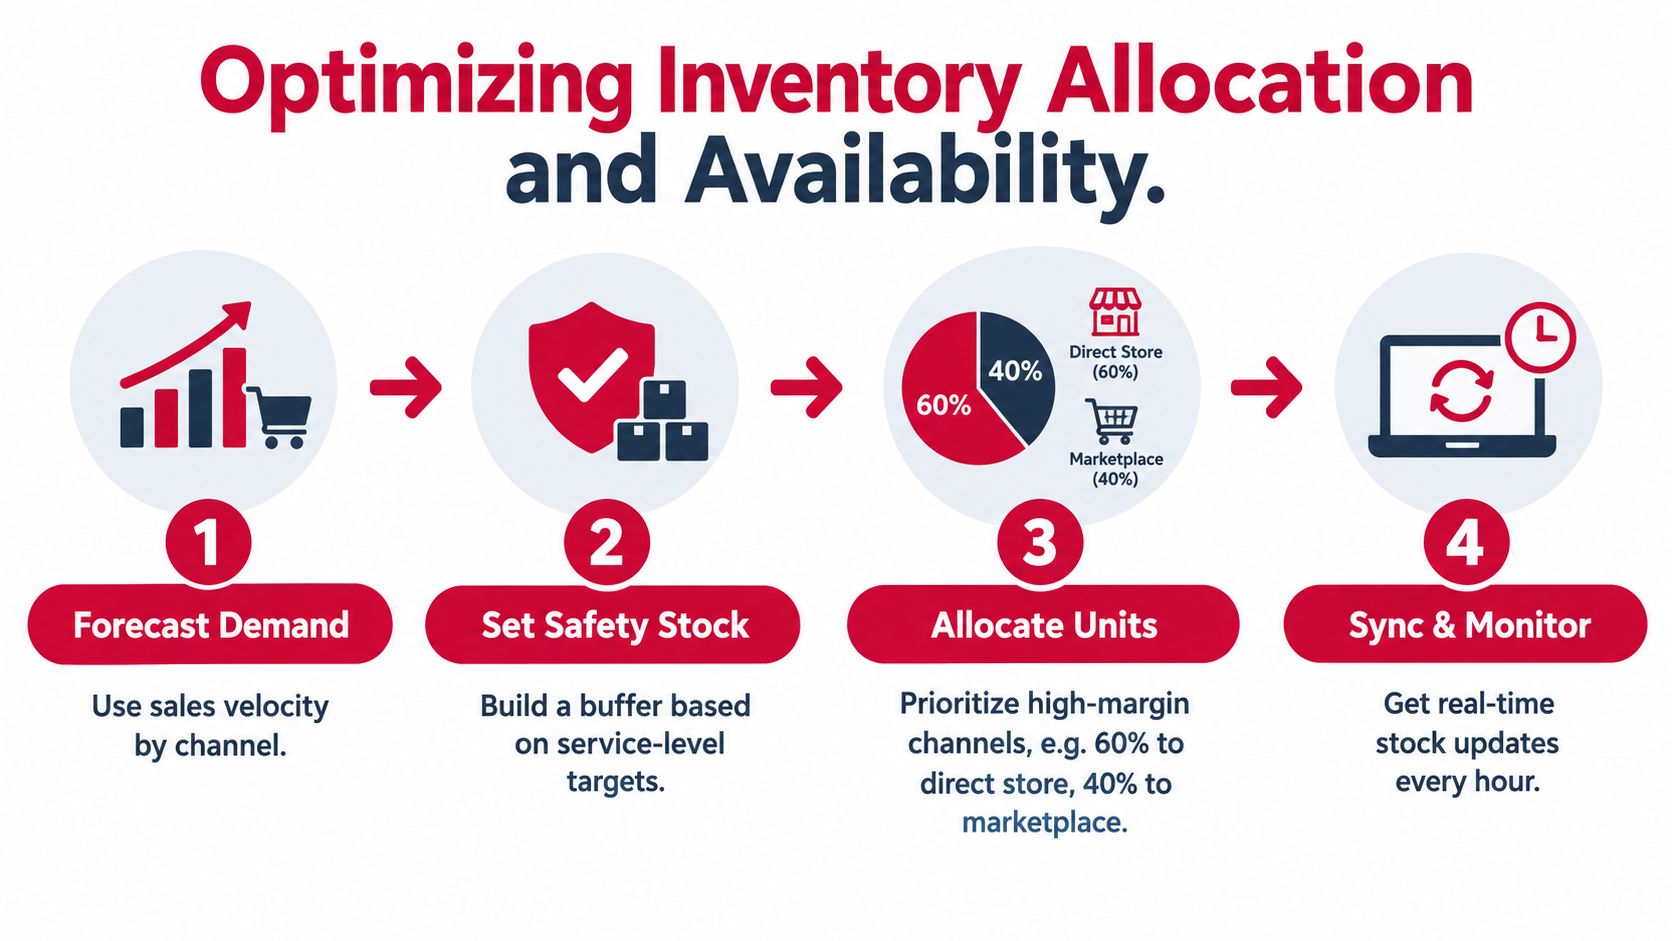
Set reorder points by channel rather than relying on a universal threshold. A wholesale account may need protection for a scheduled delivery, while DTC can adjust a promotion quickly. A marketplace may generate volatile demand during advertising bursts, and a retailer may penalize poor fill rates more severely than a DTC stockout affects the brand.
Use a master item file that connects GTINs and SKUs, case-pack dimensions, weights, content assets, lead times, minimum order quantities, and replenishment parameters. Forecast at the SKU-by-channel-week level, then adjust for promotions, marketplace volatility, launch timing, and lead-time changes.
McKinsey found that half of winning CPG companies developed tailored e-commerce assortments, compared with 20% of other companies, while 75% of winners increased e-commerce advertising and marketing investment, compared with 20% of others, in its analysis of leading European CPG companies. The operational lesson is clear: channel-specific demand requires channel-specific assortment and supply decisions. NielsenIQ reports that 86% of U.S. CPG dollar sales are represented by omnichannel shoppers, reinforcing the need to coordinate inventory, pricing, and product content across channels, as documented in McKinsey's analysis of leading CPG sales practices.
Create a constrained-inventory rule before the shortage arrives. Prioritize the channel with the strongest incremental contribution and strategic value, while protecting contractual service requirements and avoiding damage to long-term retailer relationships.
A channel with the largest sales forecast isn't automatically the right destination for the next pallet. A slower but higher-margin channel may create more economic value per unit. Conversely, a retailer launch may justify temporary margin pressure if the strategic role is explicit and the cash requirement is controlled.
Social media use for product research rose to 32% across markets in 2025, from 27% in 2023, according to route-to-market research from Infomineo. That shift adds demand volatility to the planning problem, especially when social discovery sends shoppers toward a marketplace listing with limited supply.
For broader operational planning, brands can use this framework to build a resilient supply chain. The practical objective is not maximum availability everywhere. It's the right availability, at the right cost, for the channels that create durable value.
Distribution management fails when teams review channels only during a quarterly business meeting. Inventory, pricing, content compliance, and advertising can deteriorate long before a top-line report makes the issue visible.
Use a weekly exception review, a monthly profitability review, and a quarterly assortment reset. Each meeting should make decisions, not merely circulate dashboards.
Review in-stock rate, fill rate, forecast bias, weeks of supply, aged inventory, content errors, price exceptions, and marketplace featured-placement or lost-buy-box performance where applicable. Assign an owner to every exception and record the required action.
The team should also check whether shipment data is masking weak consumption. Distributor sell-in can make a channel look healthy while retailer inventory remains stagnant. Forecasts should use consumption and sell-through wherever the data is available.
Refresh the contribution-margin waterfall by channel and SKU. Compare net revenue, trade spend, fulfillment cost, returns, chargebacks, advertising, working-capital usage, and incremental customer acquisition value. Then reallocate inventory and marketing toward profitable incremental demand.
A simple decision set helps:
For teams building performance dashboards and campaign controls, Landra for performance marketers can sit alongside marketplace, inventory, and finance reporting. The tool matters less than consistent definitions and a shared decision process.
Review channel roles, pack architecture, promotional calendars, pricing corridors, retailer requirements, and SKU-level demand. Remove low-velocity inventory before storage costs and working capital turn a weak item into a recurring tax.
That cadence supports the Foundation, Optimization, Amplification sequence. Establish clean data and economics first, improve execution second, and increase investment only after the system proves it can absorb more demand profitably.
Channel expansion deserves the same discipline as a product launch. Before adding a retailer, increasing marketplace advertising, or moving more inventory into managed fulfillment, calculate the fully loaded contribution and identify what happens if demand shifts from another channel.
The most useful review is specific to your SKU mix. Examine where fees are rising, which products consume disproportionate storage or fulfillment expense, whether advertising is above break-even ACOS, and how inventory should be allocated when supply is constrained. Then define the next action, whether that means renegotiating terms, changing pack architecture, adjusting price, reducing spend, or pausing expansion.
Reddog Consulting Group offers a free 30-minute strategy call for qualified CPG founders and operators. It's a working session focused on marketplace performance, margin leakage, channel economics, and a practical growth plan, not a sales presentation.
Reddog Consulting Group helps CPG brands evaluate Amazon, Walmart, DTC, wholesale, and distribution through contribution-margin-first planning. Book a free 30-minute working session with Reddog Consulting Group to review your channel economics and decide where the next profitable unit should go.
Leave a comment: