
Published: March 2020 | Last Updated:September 2026
© Copyright 2026, Reddog Consulting Group.

Inventory velocity is the rate at which stock moves, commonly measured as units sold per day or as COGS divided by average inventory. A higher number can improve cash conversion, but it can also destroy contribution margin if every sale carries poor economics.
The popular advice is to sell more, faster. That advice is incomplete for CPG brands operating across Amazon, Walmart, DTC, and wholesale. The useful target isn't maximum velocity. It's optimal velocity, the rate that produces the strongest contribution dollars for each dollar tied up in inventory.
A snack-bar founder can push 1,200 units a day of a $6 product and still generate less weekly cash than a $14 supplement moving at a slower pace if the snack bar leaves only 4% contribution margin after marketplace fees while the supplement retains 18%. Faster movement doesn't rescue a unit economics problem. It can amplify it by sending more low-margin inventory through fulfillment, storage, advertising, and replenishment cycles.
Inventory velocity is therefore a working-capital and channel-margin tool. It tells you how quickly cash leaves inventory and becomes a sale, but you still need to ask what remains after COGS, fulfillment, storage, discounts, advertising, returns, and channel deductions. The practical definition and formulas are outlined in this inventory performance guide, but the operator's question is sharper: which SKUs should move faster, in which channel, at what margin, and with what replenishment risk?
Velocity without margin is a working-capital trap. Every additional unit shipped through Amazon FBA or Walmart Fulfillment Services creates another opportunity for pick-and-pack charges, storage exposure, aged-inventory fees, discounts, and capital tied up in COGS. A SKU can look excellent in a sales dashboard while weakening the cash position of the business.
That doesn't mean slow inventory is healthy. Low velocity increases the time stock sits on hand, which raises carrying costs and increases the chance of markdowns, obsolescence, packaging changes, or channel-specific penalties. Inventory velocity guidance connects faster movement with shorter holding time and lower carrying-cost exposure, while also framing the metric as a practical proxy for working-capital efficiency.
Practical rule: Judge velocity alongside contribution dollars, not beside revenue alone.
A useful operating target is contribution dollars per dollar of inventory. That changes the conversation. A slower SKU with durable margin and predictable replenishment may deserve more working capital than a fast SKU that depends on coupons, aggressive PPC, and a low marketplace price.
Optimal velocity balances four variables:
The right target can differ by SKU, pack size, channel, and season. Amazon velocity may justify frequent inbound shipments for a hero product, while Walmart may require tighter allocation if storage or capacity conditions make slow replenishment expensive. A portfolio view also matters. Removing a low-margin SKU can improve total inventory productivity even if that SKU itself continues to sell.
Operators usually need three numbers in the spreadsheet, and each answers a different question.
Units per day shows the physical sales rate:
Units sold ÷ selling days
Inventory turnover shows how efficiently inventory at cost converts through sales:
COGS ÷ average inventory at cost
Days on hand translates turnover into a planning horizon:
365 ÷ inventory turns
Average inventory is commonly calculated as (beginning inventory + ending inventory) ÷ 2 for the period being analyzed. Use the same period for sales, COGS, and inventory. A quarterly COGS figure paired with a year-end inventory balance will produce a ratio that looks precise but isn't operationally useful.
For a replicable example, take a SKU that sold 18,000 units over 180 days, carries $9 wholesale COGS, and held an average of 4,200 units. Its unit velocity is 100 units per day. COGS for the period is $162,000, and average inventory at cost is $37,800, producing about 4.3 turns for that 180-day period, or about 7.7 annualized turns. Days on hand based on the annualized figure is about 47 days.
| Metric | Formula | Use Case | Worked Example, SKU |
|---|---|---|---|
| Units per day | Units sold ÷ selling days | Daily replenishment, ad pacing, promo timing | 18,000 ÷ 180 = 100 units/day |
| Inventory turnover | COGS ÷ average inventory at cost | Financial efficiency and assortment review | $162,000 ÷ $37,800 = 4.3 turns in 180 days, or about 7.7 annualized turns |
| Days on hand | 365 ÷ annualized turns | Purchase orders, safety stock, and 3PL planning | 365 ÷ 7.7 = about 47 days |
Use units when the decision concerns physical flow, such as a reorder trigger or warehouse allocation. Use COGS when comparing capital efficiency across SKUs with different prices. Retail revenue is the wrong denominator for turnover because it includes markup and can make a low-margin product look more productive than it is.
The Peak Transport operational efficiency metrics guide is useful when you want to place inventory measures beside broader logistics performance indicators. For the inventory calculation itself, keep the method consistent with the approach in this inventory turnover calculation guide.
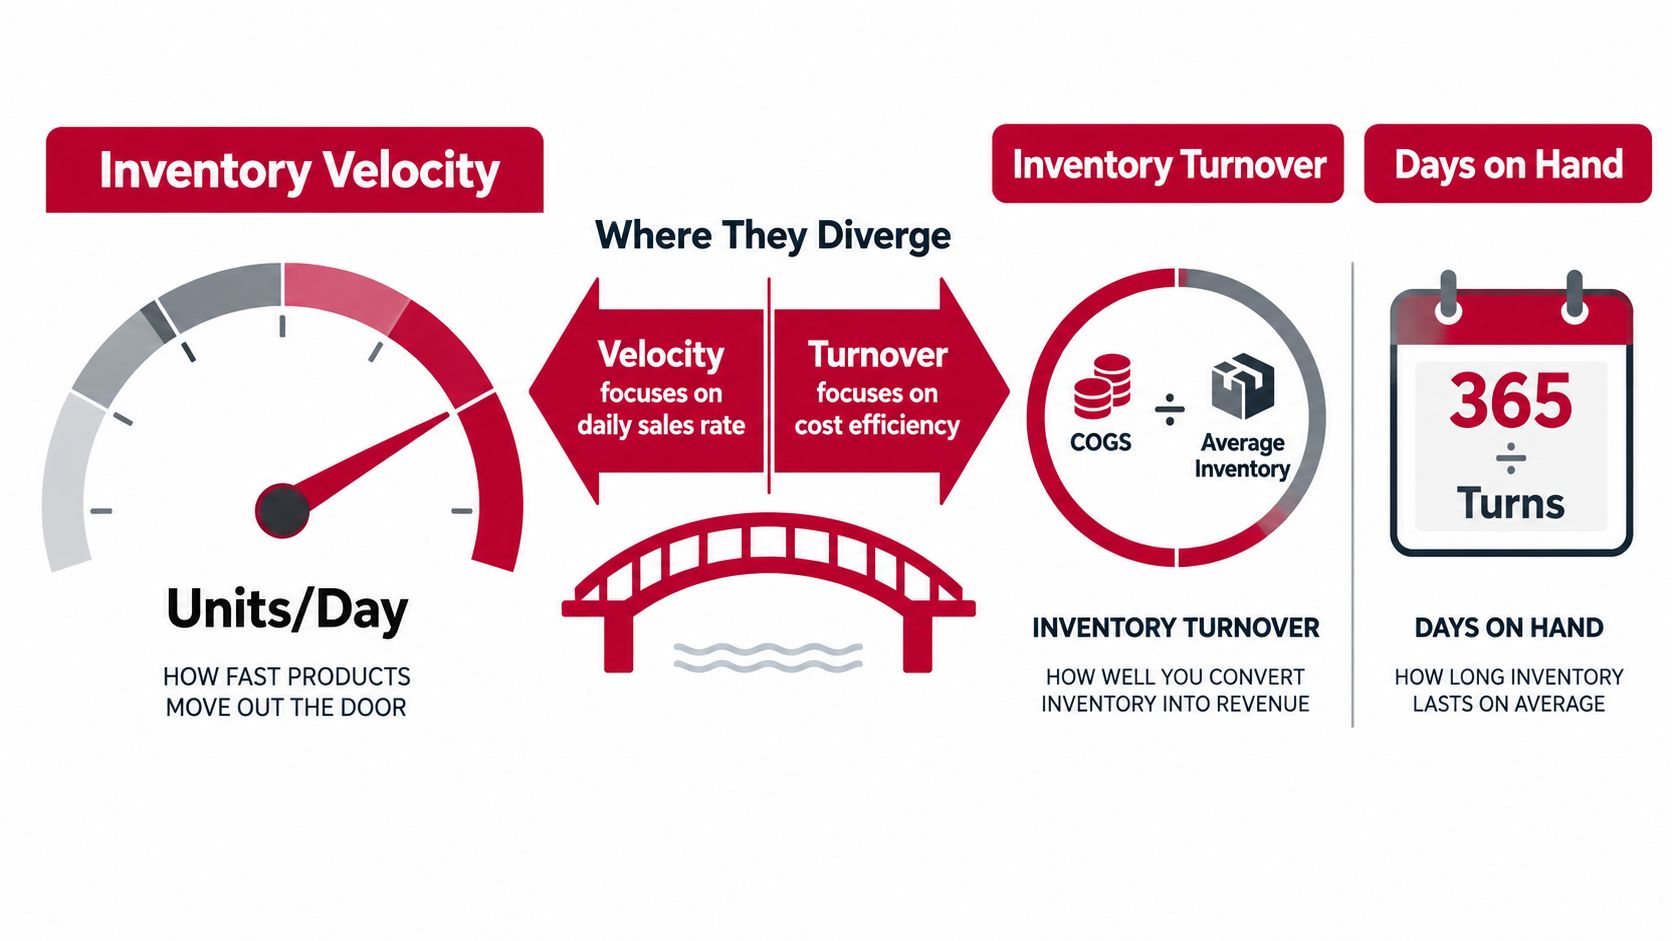
Inventory velocity, turnover, and days on hand describe related movement, but they shouldn't drive the same decision.
Velocity in units per day is the operational heartbeat. It tells the replenishment manager how many units the channel is consuming now. Turnover is the financial summary, useful for annual planning, assortment rationalization, and comparing inventory investment. Days on hand is the procurement language. It tells the buyer how long current stock can support expected demand.
The distinction matters during a channel launch or demand spike. A SKU might show 6 annual turns, which sounds healthy in isolation, while carrying 60 days on hand. If the inbound ship window is 9 days, that coverage may be adequate in a stable environment. If production, freight, receiving, and marketplace check-in add uncertainty, the same figure can create a stockout risk long before the annual ratio looks concerning.
| Metric | Primary question | Decision it should drive |
|---|---|---|
| Units per day | How quickly is this SKU selling right now? | Ad pacing, promotion timing, and daily allocation |
| Turns | How efficiently is capital cycling? | Assortment cuts, portfolio comparisons, and financial planning |
| Days on hand | How long can available stock support demand? | Purchase orders, safety stock, and 3PL replenishment |
Don't use annual turnover to set a daily advertising budget, and don't use a seven-day sales spike to place a large production order. The first ignores current demand. The second treats temporary demand as a permanent baseline.
Sell-through adds another useful lens because it compares sales with available inventory over a defined period. The calculation and interpretation are covered in this sell-through rate guide. Used together, these metrics show whether a SKU is moving, whether the movement is capital-efficient, and whether the next replenishment can arrive before availability breaks.
There is no single healthy inventory velocity target for every CPG brand. Category demand, shelf life, purchase frequency, lead time, pack size, and fulfillment economics all change the answer.
Directional industry guidance puts grocery and FMCG at 12 to 20 turns per year, apparel at 6 to 8, and electronics and general retail at 4 to 6, with 2 to 4 turns sometimes treated as a balanced zone depending on the business model. Those ranges come from inventory velocity and turnover guidance, and they are context, not a universal target.
| Category / Channel | Typical Annual Turns | 90-Day Sell-Through Target | Watchouts |
|---|---|---|---|
| Grocery and FMCG | 12 to 20 | Set by shelf life and service-level needs | Stockouts on repeat products, expiry, and margin erosion from discounts |
| Apparel | 6 to 8 | Category and season dependent | Long-tail sizes, markdowns, and seasonal aging |
| Electronics and general retail | 4 to 6 | Product lifecycle dependent | Obsolescence, launch timing, and price compression |
| Amazon FBA | Category dependent | Use a channel-specific target | Storage, aged inventory, inbound delays, and fee changes |
| Walmart WFS | Category dependent | Use a tighter SKU-level target | Storage duration, fee bands, and capacity conditions |
Amazon FBA can compress the sellable window because storage and aged-inventory exposure become more painful as units sit in fulfillment. Walmart WFS uses duration-based storage charges too. For a practical read on the fee structure, Walmart Marketplace pricing shows how storage costs change as inventory ages, especially in Q4 and for older stock.
Cross-channel brands should not benchmark only against a blended average. A fast Amazon SKU can hide a slow Walmart allocation, and a strong DTC rate can cover wholesale inventory that pays later. Review each channel separately, then judge the portfolio against the slowest-paying channel, because stranded stock there ties up cash while the blended dashboard still looks fine.
For brands reviewing warehouse dependability, capacity, and process risk alongside velocity, this reliability consulting for logistics resource adds useful operational context.
A blended velocity number can look healthy while one channel destroys contribution margin. Consider a supplement brand selling a $24.99 hero SKU at roughly 1,200 units per month, with 65% Amazon, 25% Walmart, and 10% DTC. At approximately 40 units per day, the SKU produces roughly 14.6 turns annually if the inventory base stays aligned with demand.
That result measures movement, not economics. The operator still needs channel-level sales, inventory, fees, advertising, replenishment timing, and contribution margin before deciding whether the rate is good.
Amazon carries most of the demand, which may justify deeper FBA inventory to reduce stockout risk. A 9-cubic-foot inbound shipment becomes expensive if the forecast weakens, units remain in storage, or Q4 storage conditions change. Fulfillment and storage fees, advertising spend, and inbound timing can turn a contribution-positive unit into a fee-negative unit even while sales continue.
Walmart WFS creates a different exposure. Storage charges depend on time and cubic feet. Standard storage is $0.75 per cubic foot per month from January through September. In Q4, that $0.75 applies to items stored up to 30 days, while items stored beyond 30 days incur an added $1.50 per cubic foot per month. Inventory held 366 to 450 days reaches $2.25 per cubic foot per month, and inventory over 450 days reaches $7.50 per cubic foot per month, according to Walmart's fulfillment pricing. The fee exposure makes slow allocation costly even when the blended SKU rate looks acceptable.
WFS fulfillment pricing is weight based. It starts at $3.45 for 1 lb., $4.95 for 2 lb., and $5.45 for 3 lb., then reaches $5.75 plus $0.40 per additional pound for 4 to 20 lb. items. Apparel, hazmat, and low-price items can add charges, as described in this WFS pricing review. Product dimensions and order mix therefore matter as much as unit velocity.
A practical scenario model can assign a 30-day replenishment delay to each channel. If the delay creates roughly $3.20 per unit in blended Amazon fee exposure and about $2.10 per unit in Walmart exposure, Amazon carries the larger dollar risk, while Walmart may reveal capacity problems earlier. These are model assumptions, not universal marketplace rates.
Walmart states that WFS rates average 15% less than competition and that it has no signup or monthly subscription fees. Its overview also identifies add-on fees and slower-moving inventory charges during peak season, as described in the WFS overview. The operating conclusion is straightforward: identical velocity doesn't produce identical contribution margin. Allocate inventory by channel economics, protect working capital, and accept a slower channel only when its margin and stockout trade-off justify the cash tied up.
A quarterly velocity model doesn't require a full planning system. A disciplined spreadsheet can expose the decisions that matter if every row represents one SKU in one channel.
Use safety stock based on the square root of lead-time demand variance, not a flat weeks-of-cover rule. Volatile SKUs need a different buffer from stable repeat products, even when their average units per day match.
Then create an inventory-by-channel matrix. Flag any SKU above 90 days of cover on a single channel, and show available, inbound, committed, and sellable units separately. The output should be two lists: replenishment triggers tied to reorder points, and liquidation candidates where additional purchase orders would deepen the problem.
Your spreadsheet should include:
A broader inventory management software overview can help when manual files become difficult to maintain. The tool matters less than the discipline of keeping SKU-level, channel-level data clean and decision-ready.
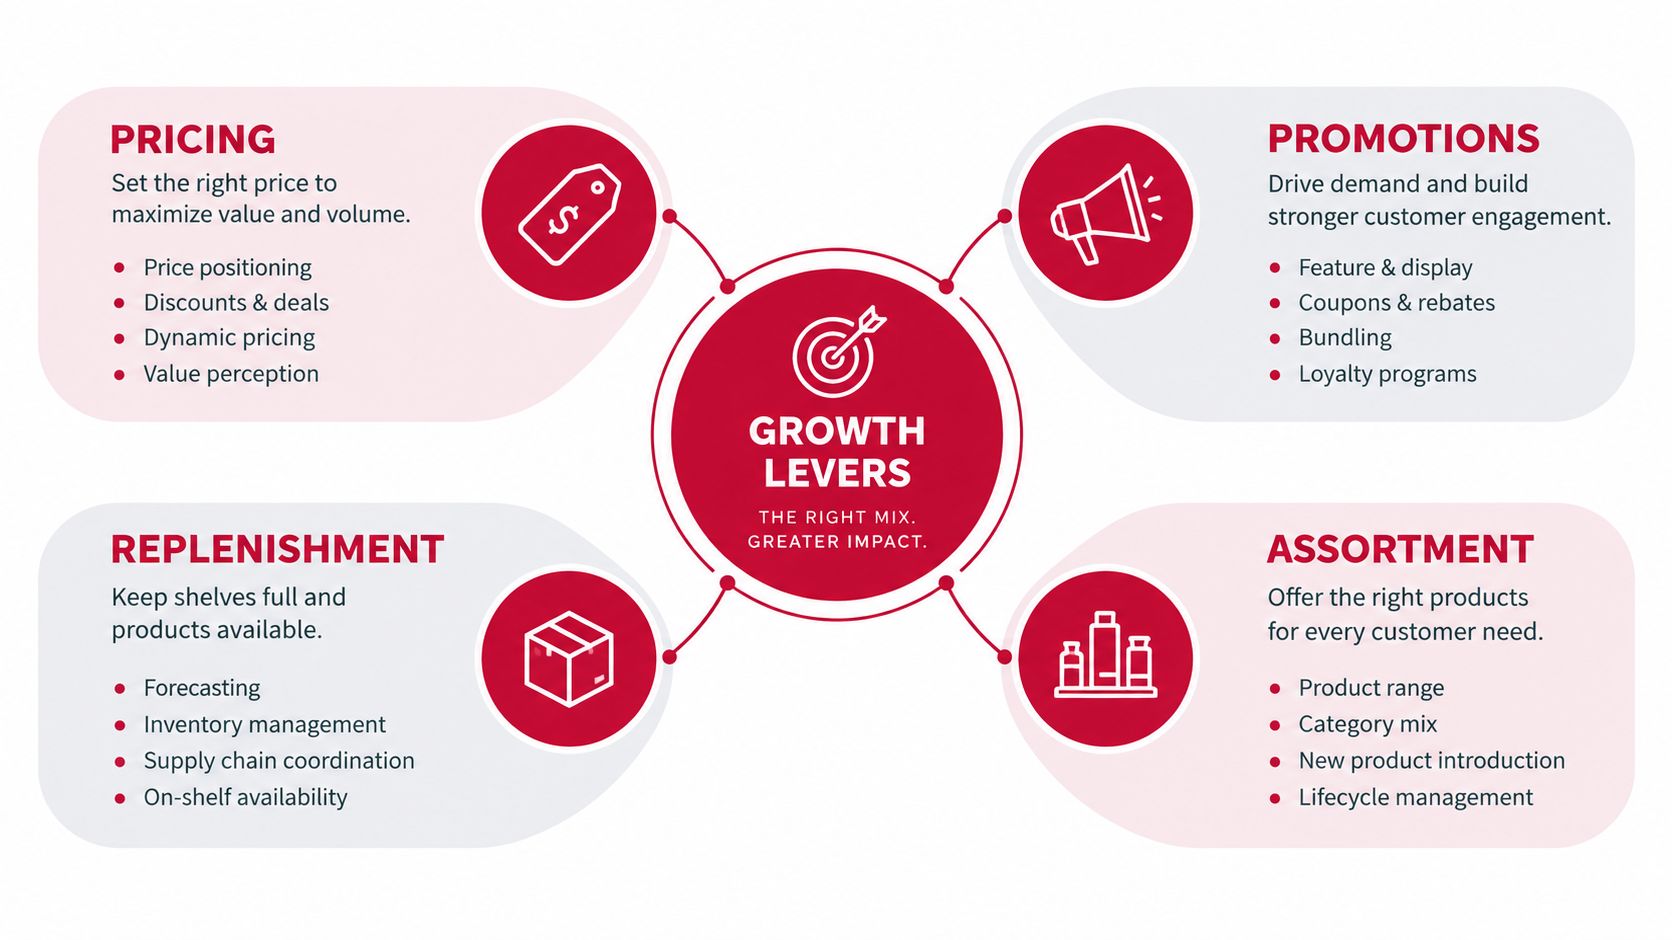
Velocity improves sustainably when operators change the economics around demand, not when they buy more inventory. RedDog's Foundation → Optimization → Amplification sequence works well here. First establish accurate costs, channel data, and availability. Then improve the levers that affect contribution. Only after that should advertising and expansion amplify the system.
Hold the margin floor defined by MAP, wholesale commitments, and channel costs. Test elasticity by comparing price changes with unit velocity, conversion, BSR, and contribution dollars. Racing to the lowest Buy Box price can increase units while reducing the cash produced by every shipment.
A price test only counts as a win if the incremental contribution offsets lost margin per unit. If a promotion lifts velocity but causes TACoS and fulfillment costs to consume the gain, the brand bought movement rather than growth.
Coupons, Vine, and Subscribe & Save have different jobs. Use them selectively on aged units, slow turns, or a launch that needs qualified trial. Don't automatically discount a hero SKU that already has healthy velocity and reliable organic demand.
The operator should record the pre-promotion and post-promotion unit rate, contribution per unit, and days of cover. A promotion that clears excess stock can be rational. A permanent discount on a fast mover can train customers to wait and reset the channel's reference price.
Reorder from days on hand, lead time, and expected demand uplift, not raw trailing sales. Add a 4 to 6 week promotional uplift buffer only when a confirmed event, price change, or media plan justifies it. Otherwise, the buffer becomes hidden overstock.
The same SKU can need different reorder quantities in Amazon FBA and Walmart WFS because the channels receive inventory at different speeds and impose different storage economics. Allocate safety stock where the contribution risk of a stockout is highest, not where the current sales chart is tallest.
Long-tail SKUs consume fulfillment slots, working capital, and operational attention. If an item contributes under 10% of revenue, review its contribution dollars, storage exposure, and strategic role before replenishing it. Consolidating demand into faster-turning pack counts can simplify the catalog, but only if the new pack doesn't create price or conversion resistance.
The four levers work together. Pricing changes demand, promotions change timing, replenishment controls availability, and assortment determines where capital sits.
The hardest velocity problems usually appear after the dashboard number improves. Operators overestimate demand, place larger purchase orders, and discover that the incremental stock is sitting in the wrong channel.
Overestimating velocity inflates replenishment quantities. A short promotion, a temporary ranking gain, or an ad push can make a seven-day rate look like a new baseline. If the purchase order follows that spike, the brand converts forecast error into aged inventory and storage expense.
Amazon's long-term storage exposure becomes especially important as inventory approaches the 365-day point. Walmart WFS also increases storage cost for older inventory, with the highest listed rate applying after 450 days, as described earlier. These aren't abstract accounting concerns. They reduce the contribution left from units that already required product cost, freight, and fulfillment cash.
The next quarter shouldn't be organized around the bestsellers alone. Start with the SKUs where velocity, margin, and aged-inventory exposure disagree.
Pull current SKU-level turns, units per day, days on hand, channel allocation, and aged-inventory exposure. Then sequence actions around the worst offenders. That might mean slowing a purchase order, moving stock between channels, changing a pack architecture, liquidating a tail SKU, or protecting a profitable hero product from a preventable stockout.
Reddog Consulting Group helps CPG founders and operators connect inventory velocity to contribution margin, marketplace performance, and channel planning across Amazon, Walmart, DTC, and wholesale. Book a free 30-minute working session through Reddog Consulting Group to review your SKU-level turns and identify the next margin and replenishment decisions, with no sales pitch.
Leave a comment: