
Published: March 2020 | Last Updated:September 2026
© Copyright 2026, Reddog Consulting Group.

A CPG brand can spend heavily across Amazon and Walmart, watch attributed revenue hold steady, and still lose money on every incremental unit. The problem usually isn't a lack of advertising data. It's that the data is being read inside a silo, while fees, pricing, inventory age, catalog quality, and organic demand determine whether the sale creates contribution margin.
That's the practical answer to what is retail media advertising. It's paid access to retailer-owned shopper attention and purchase signals, but it functions as more than an ad placement. Properly managed, it's an operating system connecting merchandising, media, supply chain, and marketplace economics. Poorly managed, it becomes an automated way to bid up demand the brand already had.
A brand can increase Amazon and Walmart spend, watch reported ROAS remain acceptable, and still see contribution margin per unit fall. Sponsored product CPCs rise, so the team adds bids, protects branded terms, and expands keyword coverage. Revenue may hold while the P&L weakens.
The underlying issue is measurement. Last-click efficiency isn't the same as incremental profit. One benchmark analysis found incremental ROAS is typically 30% to 60% below reported last-click ROAS. Some attributed orders would have arrived through organic search, repeat purchase, or demand already in market. A campaign can therefore appear efficient because it captures shoppers who were close to purchasing. This analysis of retail media and in-house ad-spend decisions examines the difference between attributed and incremental economics.
Practical rule: Treat retail media as a P&L line connected to pricing, logistics, inventory, and merchandising. Keep it out of a marketing-only view.
Retail media's scale makes that operating discipline more important. A WARC forecast reported by Advanced Television projected worldwide retail media investment at $174.9 billion in 2025, rising to $196.7 billion in 2026, or 16% of all ad spend. The same source described growth from roughly $50.7 billion in 2019 to $122.6 billion in 2022 and $150 billion in 2024. Retail media now sits inside the broader advertising system, not just the marketplace team's toolkit.
Before increasing spend, operators should connect four operating variables:
Social discovery can provide another reference point. The insights on purchase signals from social ads help teams compare offsite engagement with marketplace intent and assess whether advertising creates demand or redirects shoppers already searching on a retailer platform. Broader retail insights for assortment, pricing, and channel decisions help connect those signals to the commercial decisions that determine contribution margin.
Retail media advertising is paid promotion placed within, or activated through, a retailer's commerce ecosystem. The retailer owns the inventory and usually controls the shopper data behind the audience. That can include search queries, product views, basket composition, loyalty activity, purchase history, and signals about where a shopper is in the buying process.
The easiest analogy is a shopping mall landlord who also operates the security cameras. The landlord knows which entrances shoppers use, which aisles attract attention, and which stores receive visits before a purchase. Retail media lets brands pay for access to that visibility, while the retailer measures activity closer to the transaction than an open-web publisher usually can.
The ecosystem has four practical layers:
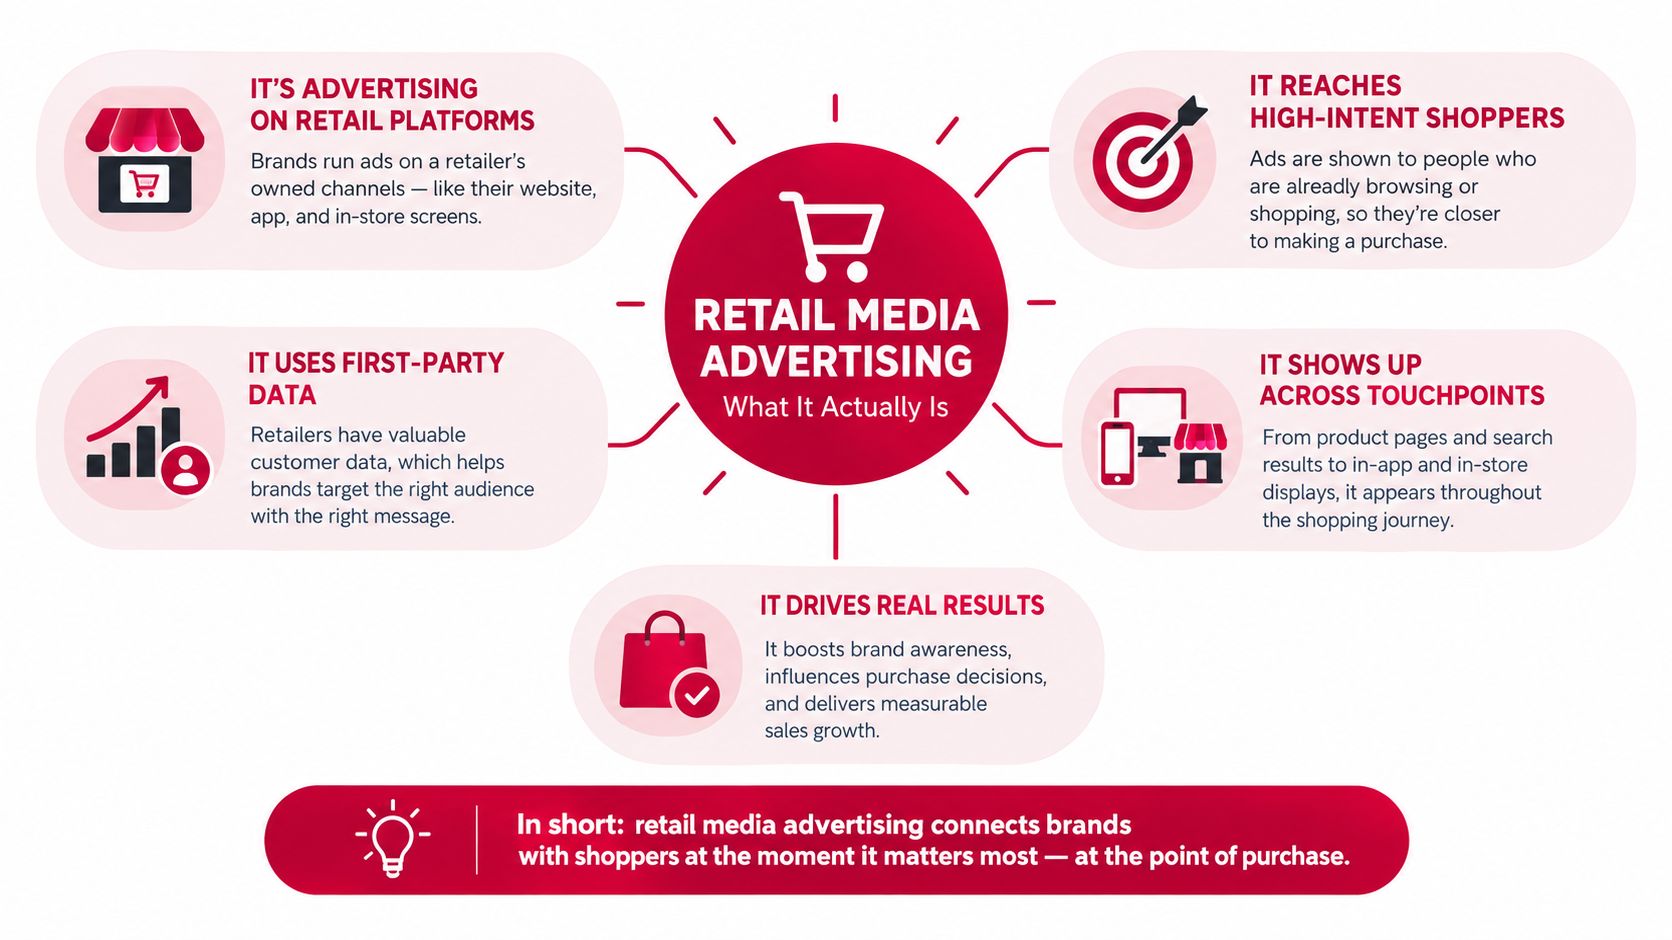
Onsite media appears inside the retailer's website or app. Sponsored Products in search results, product-page placements, Sponsored Brands, and display units all sit close to the point of purchase.
Offsite media uses retailer audience data on external inventory. That may include display, social, streaming television, and other digital placements. The shopper doesn't need to be on Amazon or Walmart at the moment the ad appears, but the audience is built from commerce behavior.
In-store media connects advertising to physical retail. Digital screens, checkout placements, shelf displays, and other store surfaces can support an omnichannel plan, particularly for CPG brands whose sales still depend on physical distribution.
The retailer's first-party data and transaction proximity are the core economic advantages. They also create trade-offs. High-intent inventory attracts strong advertiser demand, while closed platforms make cross-network comparison difficult. The relevant question isn't whether a placement reports conversions. It's whether the placement generated profitable demand after all channel costs.
Retail media formats have different payback profiles. Sponsored Products usually monetize existing search intent fastest, while video, offsite display, CTV, and in-store placements need a broader measurement lens. The mistake is assigning every format the same ROAS target.
Sponsored Products are the volume engine for many Amazon and Walmart programs. Keyword targeting captures active searches, while product targeting places an item against a competing or complementary detail page. These campaigns make the most sense for hero SKUs, launches with adequate availability, and products whose detail pages already convert.
Sponsored Brands defend branded search and present a portfolio or message above individual listings. They can protect a brand's shelf, but branded defense often has limited incrementality because the shopper may already intend to purchase.
Sponsored Display supports product-page conquesting, audience retargeting, and broader consideration. It can work when a brand needs to recover shoppers who viewed a product without purchasing, though view-through reporting deserves skepticism.
Offsite DSP and CTV expand reach beyond the retailer. Amazon DSP and Walmart Connect can use shopper audiences to find in-market or purchase-related segments across external inventory. This becomes more useful when onsite search is saturated or a mature brand needs to create demand before shoppers arrive at the shelf.
In-store placements connect media with physical availability. Retailer programs such as Kroger Boost, Walmart Connect in-store screens, and Albertsons Media Collective can be relevant when the brand's distribution and store-level execution are strong.
For a deeper treatment of Amazon's offsite buying model, use this guide to Amazon DSP advertising for growth.
Keyword targeting captures the language shoppers use. ASIN or product targeting captures competitive and complementary context. Audience targeting uses in-market, lifestyle, lookalike, or purchase-based groups. Retargeting reaches detail-page viewers, cart abandoners, or prior visitors through dynamic product ads.
The operating decision is simple. Use the narrowest signal that matches the business objective, then expand only when the unit economics support it.
| Format | Audience Signal | Best Use Case |
|---|---|---|
| Sponsored Products | Search query, product context | Launches, hero SKUs, demand capture |
| Sponsored Brands | Branded or category search | Brand defense, portfolio discovery |
| Sponsored Display | Product views, shopper audiences | Retargeting and product-page conquest |
| Offsite display | Retailer audience and purchase behavior | Reach beyond onsite saturation |
| CTV | Broader commerce audience signals | Awareness for mature or expanding brands |
| In-store media | Store and shopper context | Supporting physical shelf execution |
The payback profile depends on more than the ad format. A weak listing, poor availability, uncompetitive price, or confused variation structure can make an efficient placement unprofitable. Retail media only works when the product is ready to convert.
Reported ROAS answers a narrow question: how much attributed revenue did the platform assign to advertising cost? It does not show whether the ad created the sale, whether the order generated positive contribution margin, or whether the same budget could have produced more profit elsewhere.
Start by separating captured demand from created demand. Last-click ROAS often credits a shopper who already searched for the brand, visited the product page organically, or buys repeatedly. The gap between reported last-click ROAS and incremental ROAS can reach 30% to 60%, so platform dashboards may overstate the value of bottom-funnel spend. Holdouts and matched-market tests provide a better basis for judging lift and budget allocation.
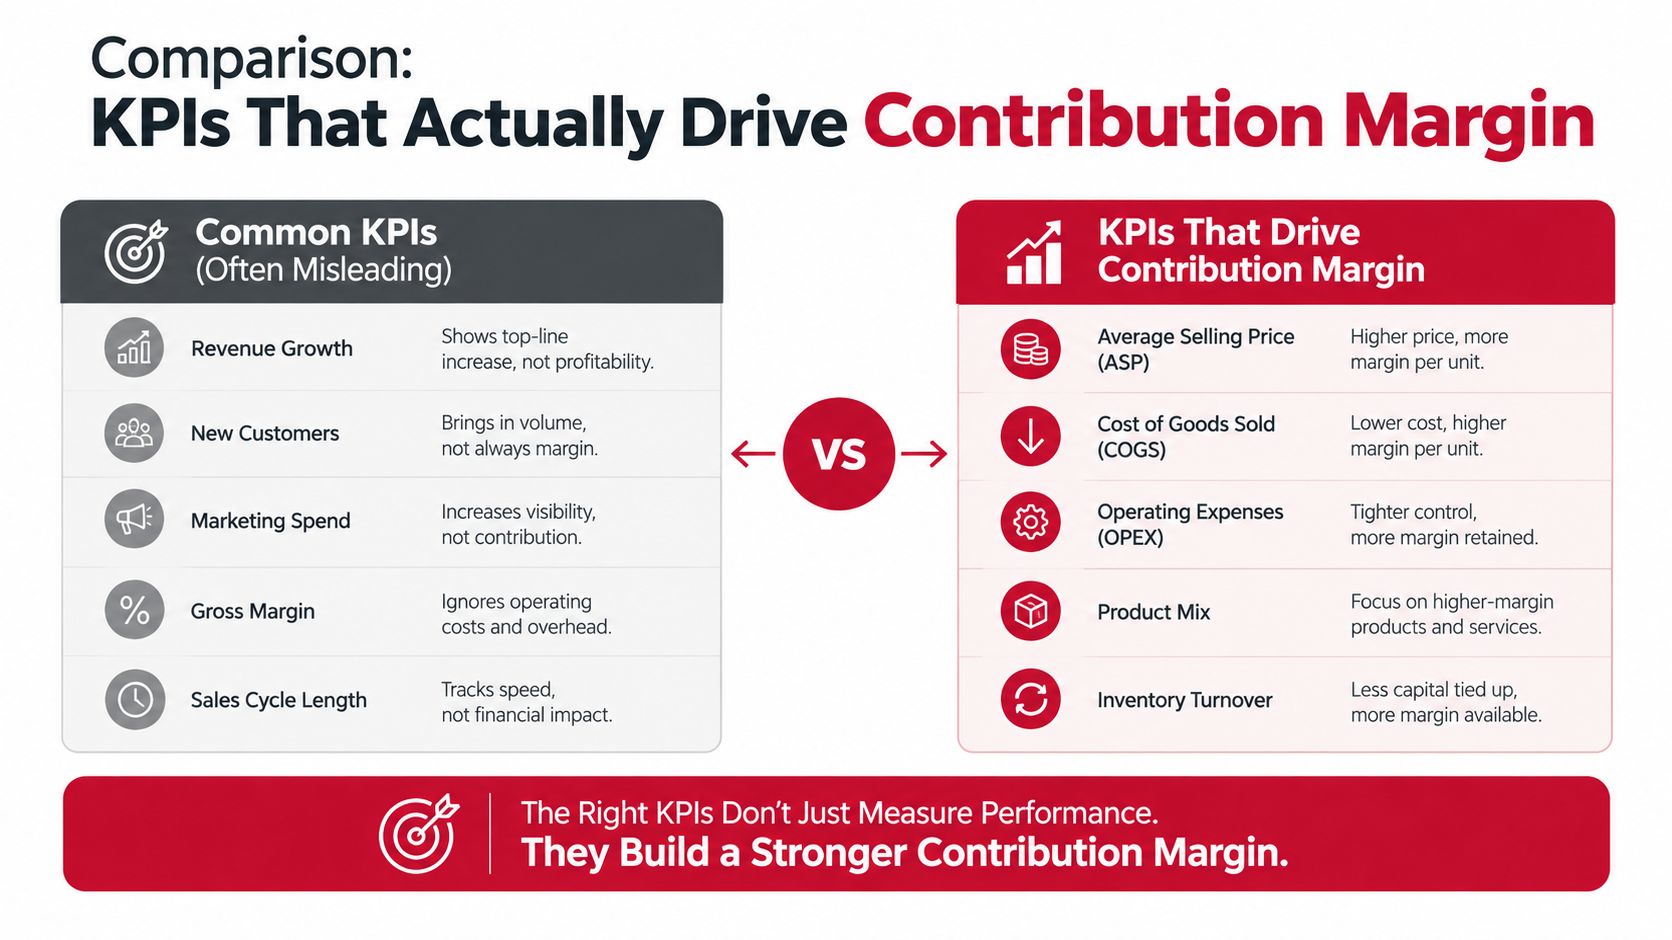
ACoS helps manage campaign efficiency, but it ignores organic sales and total channel economics. TACoS adds total sales context, yet pricing, distribution, seasonality, and organic ranking can move it independently of media quality. MER gives a broader business view, but it can hide which products or placements are consuming margin.
Use a layered operating stack:
Operator view: Use platform reporting for navigation, not as the final source of truth.
Attribution windows require the same discipline. A long window can assign a conversion to an ad after the shopper's intent was already established. View-through conversions are harder to interpret because an impression may count without a meaningful click or observable change in behavior.
Retail media also belongs in a wider operating system. Catalog quality affects conversion, inventory velocity affects whether demand can be fulfilled, and contribution margin determines whether added volume is economically useful. A strong campaign cannot repair a suppressed listing, unavailable hero SKU, or margin structure that leaves no room for media.
The bidding model starts with contribution margin available before media. If an order contributes a limited amount after fees and fulfillment, allowable media cost must remain below that amount. Document the calculation in a consistent contribution margin model, then compare it with actual incremental outcomes rather than reported ROAS alone.
Consider a CPG brand selling a $14 ASIN on Amazon and a comparable item on Walmart. The retail price looks healthy, but the brand's usable margin depends on every deduction between customer payment and cash contribution. Wholesale cost, referral charges, fulfillment, promotions, returns, storage, and advertising all compete for the same revenue dollar.
A simple quarterly walk should begin with net selling price, not gross list price. Deduct the product cost first, then marketplace fees, fulfillment, retailer-funded promotions, expected returns, and media cost per shipped unit. If inventory sits too long, storage and aged-inventory charges need their own line rather than being buried in an operations account.
The exact commercial deductions vary by product and contract, so this illustration uses only verified fulfillment examples and leaves unverified cost lines as placeholders.
| Line Item | Amazon ($) | Walmart ($) |
|---|---|---|
| Selling price | 14.00 | 14.00 |
| Product and wholesale cost | Brand-specific | Brand-specific |
| Referral fee | Brand-specific | Brand-specific |
| Fulfillment example | FBA fee varies by size and weight | WFS fee varies by size and weight |
| Standard-size item under 6 oz | 3.31 | Not comparable in the cited example |
| Item under 1 lb | Not comparable in the cited example | 3.45 |
| Item weighing 1 to 2 lb | 6.92 | 4.95 |
| Storage example, regular period | 0.78 per cubic foot monthly | 0.75 per cubic foot monthly |
| Storage example, peak period | 2.40 per cubic foot monthly | 1.50 per cubic foot monthly |
| Retailer-funded promotion | Brand-specific | Brand-specific |
| Returns and allowances | Brand-specific | Brand-specific |
| Retail media per shipped unit | Campaign-dependent | Campaign-dependent |
| Contribution margin | Calculated after all deductions | Calculated after all deductions |
The FBA and WFS fee comparison shows why weight breaks can change channel preference. A product that looks attractive on one marketplace may lose its advantage after fulfillment is applied. Walmart's official guidance adds a sharper warning for slow movers, with storage at $2.25 per cubic foot per month for inventory stored 366 to 450 days, and $7.50 per cubic foot per month for inventory older than 450 days. Those figures are documented in Walmart's WFS fee guidance.
A reported 4x ROAS can still produce negative contribution when the advertised order carries thin margin and the business absorbs aged inventory, returns, and promotion deductions. The recovery plan is operational: improve velocity, remove long-tail SKUs that tie up storage, correct pack-size economics, and shift budget from low-incrementality branded defense toward non-branded conquest when the latter produces profitable new demand.
Run this walk quarterly by SKU and channel. Update fees, storage exposure, promotional funding, return assumptions, and media cost per shipped unit. Then make budget decisions from the resulting contribution margin, not from a blended account-level ROAS.
Amazon and Walmart shouldn't receive identical budget logic. In the U.S. retail media market, Amazon captured 78.0% of retail media expenditure in 2025, while Walmart held 7.5%, leaving 14.5% for all other networks combined, according to coverage of Walrus Intelligence data in MediaBrief's retail media market report. Another forecast cited by VTEX projected Amazon at roughly 79.7% of the 2025 market, with Amazon and Walmart expected to capture 89% of 2026 incremental retail media dollars. The concentration creates reach, but it also concentrates auction pressure and dependence on a small number of closed ecosystems.
A growth-stage operator should implement the program in sequence rather than opening every format at once.
Audit catalog hygiene before spending aggressively. Check titles, images, attributes, variation families, content compliance, price competitiveness, reviews, and in-stock status. Map the keyword universe into branded, category, competitor, use-case, and long-tail groups. Confirm that each advertised SKU has enough inventory to support the intended demand.
Campaign architecture should separate defense, conquest, and launch objectives. Keep branded terms isolated from non-branded terms. Separate hero products from experimental SKUs. Give Walmart its own structure instead of copying Amazon campaigns and assuming shopper behavior, auction depth, and conversion mechanics are interchangeable.
Set bid ceilings from contribution margin. Review search-term quality, placement performance, conversion rate, organic movement, and new-to-brand indicators on a weekly cadence. Add Sponsored Brands video when the category requires education, Sponsored Display when retargeting has a clear role, and Walmart Connect Sponsored Search or Display when the listing and availability can support the traffic.
Budget bands should be treated as operating hypotheses, not universal rules. Emerging brands may test a smaller share of monthly revenue, while aggressive category capture requires a larger allocation and stronger inventory funding. The correct band depends on gross margin, repeat purchase, retail readiness, and the amount of demand the brand needs to create.
Offsite DSP, CTV, and in-store media belong after the brand has reliable measurement and adequate onsite execution. The IAB Europe retail media report reported that 46% of buyers allocated more than 41% of their digital spend to offsite retail media in 2025, up from 30% in 2024. That shift supports broader planning, but it also makes incrementality and cross-channel reconciliation more important.
| Stage | Amazon Focus | Walmart Focus | Budget Band |
|---|---|---|---|
| Foundation | Catalog, branded and non-branded structure | Catalog, availability, Sponsored Search setup | Controlled test allocation |
| Optimization | Bid floors, placement, search terms, organic rank | Search efficiency, product readiness, display tests | Scale only within contribution limits |
| Amplification | DSP, video, offsite audiences | Connect offsite, CTV, and in-store options | Larger allocation after measurement is credible |
In-house teams offer speed and direct platform access, but they need analytical capacity and a disciplined weekly rhythm. Agencies and DSP partners can provide cross-network process and specialist execution, though brands should demand transparent assumptions, raw performance views, and clear separation between attributed and incremental outcomes. Reddog Consulting Group is one option for brands that need marketplace management, listing optimization, advertising strategy, and inventory velocity modeling connected in one operating plan.
The biggest risk isn't that retail media stops working. It's that the brand scales a media program while the underlying retail system weakens.
Fee compression is easy to miss because advertising reports usually stop at attributed revenue. Aged inventory, fulfillment changes, inbound costs, returns, markdowns, and low-stock conditions can reduce contribution before the campaign manager changes a bid. Walmart's published aged-storage charges, including $2.25 per cubic foot per month after 366 days and $7.50 after 450 days, show why inventory age belongs in the media conversation, not only in the warehouse review.
Measurement becomes harder as brands spread across Amazon, Walmart Connect, Kroger Precision Marketing, Instacart, CTV, and other networks. Each platform has its own audience definitions, attribution windows, reporting cadence, and conversion logic. IAB's projection of 13.2% retail media growth compared with 5.7% total U.S. ad-spend growth indicates that competition for commerce inventory is expanding, which can increase the cost of relying on the same high-intent placements. The figures appear in IAB's digital advertising outlook.
A separate Sensor Tower retail media report reported that U.S. retail media impressions fell 17% year over year to 223 billion in the first half of 2026, with Amazon impressions declining 16%, even as other networks gained ground. That direction reinforces the operational lesson: buying more impressions isn't automatically a growth strategy. Network mix, auction pressure, inventory, and conversion readiness matter together.
The scalable brand isn't the one with the largest retail media budget. It's the one that knows which dollar creates demand, which dollar captures demand, and which dollar only pays for a sale that was already coming.
Retail media works best when RedDog's Foundation, Optimization, Amplification sequence is applied as an operating discipline. Build the catalog and inventory foundation first, optimize against contribution margin and incrementality second, then amplify through offsite, CTV, and in-store placements only when the measurement layer can support the decision.
Reddog Consulting Group offers working support across marketplace performance, contribution-margin modeling, retail media structure, and growth planning for CPG brands selling through Amazon and Walmart. Qualified founders and operators can book a free 30-minute strategy call with Reddog Consulting Group, focused on finding where media, fees, inventory, and catalog execution are helping or eroding margin.
Leave a comment: