
Published: March 2020 | Last Updated:October 2026
© Copyright 2026, Reddog Consulting Group.

Most positioning advice still treats the job as a slogan workshop. Write a sharper sentence, pick a persona, and the shelf will sort itself out. That advice fails the moment a marketplace fee, a storage bill, or a return lands on the order. A product positioning strategy only counts if the promise still leaves contribution margin after channel fees, storage, returns, and ad cost at the price you need to hold.
A supplement brand launches at $24 on Amazon. Rank looks fine and units move. Then Fulfillment by Amazon, returns, and a heavy advertising cost of sales land on the same order, and what looked like a healthy sale barely covers the ad that bought it. The listing was not "under-optimized." The position was priced against the wrong alternative and written for a shopper who would not pay full price twice.
On a search grid or a retail shelf, a shopper lines your product up against three or four alternatives and decides from a few visible cues. Those cues are the position: who the product is for, which alternative it is judged against, the one reason to choose it, and what it costs to win that choice.
Al Ries and Jack Trout formalized this work in 1969 and 1972, then consolidated it in their 1981 book Positioning: The Battle for Your Mind. The operator shift since then is economic. Vague claims and the wrong competitor set get punished by fees, storage, promotions, and returns. What follows is a working sequence: six decisions, behavior-based segments, a provable value proposition, price and pack tiers, channel alignment, the trade-offs that show up before scale, and a KPI check before spend goes up.
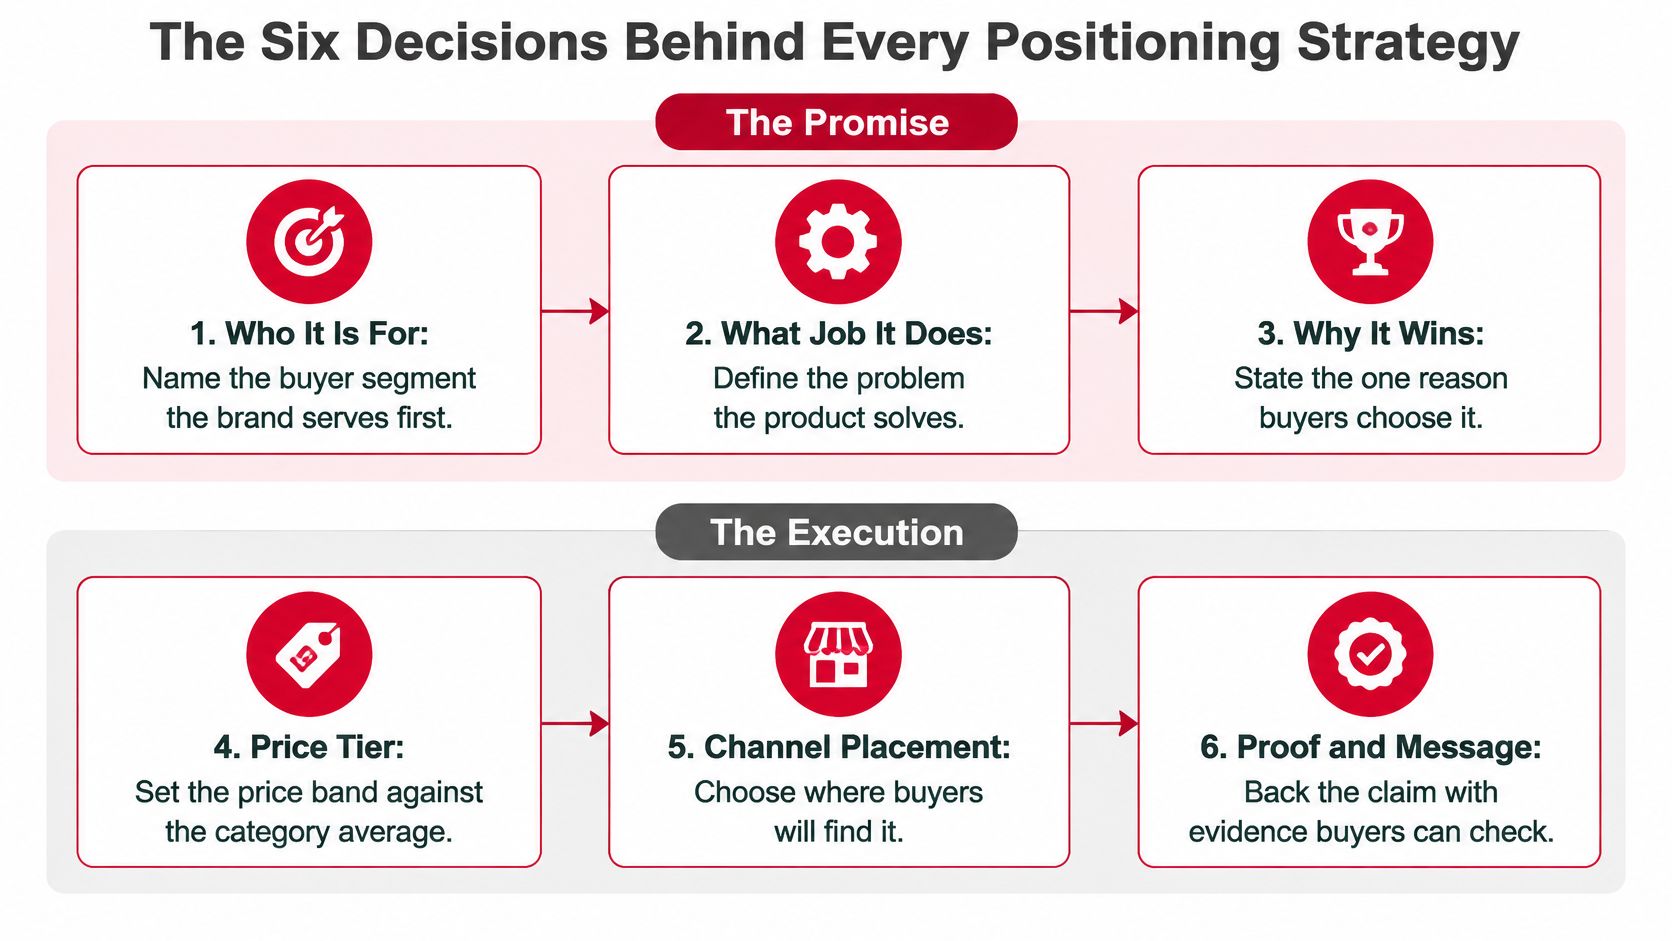
Six decisions run in order. The first three define the promise. The last three make that promise sellable without giving the margin back.
| Decision | Question It Answers | Output You Keep | Failure Signal |
|---|---|---|---|
| Audience segmentation | Which buyers repeat and pay enough to matter? | Two or three segments ranked by contribution per order | Traffic from segments that never reorder |
| Value proposition | Which job does the product do better than the alternative? | One primary job-to-be-done | Listing claims that need three paragraphs to explain |
| Differentiation | What does the alternative get wrong or leave out? | One defensible attribute with proof | Research ranks the attribute highly but shoppers ignore it in tests |
| Messaging | Which words and proof points does the shopper use to decide? | A message hierarchy for each channel | Same claim, different wording, weak click-through |
| Packaging and pricing | Which pack and price keep margin after fees? | Price tiers with pack counts and packed weight | Sales that vanish when discounts end |
| Channel alignment | What stays fixed across channels and what flexes? | Channel role and a fee-tested format for each channel | The same SKU losing margin on one marketplace |
Each decision should leave one artifact, not a deck. A one-page brief per SKU family lists the target segment, primary job, proof points, price tier, and channel role. If the team cannot check the whole position on that page, the position is already too loose to price.
Foundation covers segmentation and the margin model. Optimization covers message, pack, and price tests. Amplification adds channels only after velocity and contribution hold. A new SKU can start at the promise. An existing range should not. Start with a margin audit of current SKUs, then rewrite claims. Rewriting copy on a SKU that already loses money after fees just advertises the loss.
Surveys are useful for language. They are a bad ranking system for who you should build the position around. Stated importance is not willingness to pay, reorder behavior, or an acquisition cost you can afford. A positioning research guide can tell you to measure willingness to pay for the job. Many organizations stop at the ranking question and never connect that answer to fees, inventory, or channel profit.
| Behavior Signal | Where to Pull It | What It Tells You |
|---|---|---|
| Reorder interval | Subscribe and Save data or DTC order history | Whether the segment is a replenishment buyer or a one-time trier |
| Basket size | Marketplace order reports or DTC average order value | Whether the segment buys multipacks or single units |
| Discount dependence | Share of units sold on coupons or deals | Whether the position holds at full price |
| Return rate | Returns report by ASIN or SKU | Whether the product matches the promise made in the listing or on pack |
| Fulfillment cost per order | 3PL invoices and FBA or WFS fee reports | Whether the segment stays profitable after logistics |
| Ad cost per first order | Ad console by campaign and audience | Whether acquisition cost fits inside the contribution pool |
Say a snack brand's survey puts health-conscious parents first. In the order file, that group buys a large share of units on coupons and returns at roughly twice the rate of everyone else. A smaller gym-goer cohort pays full price, reorders about every five weeks, and stays profitable after ads. The louder segment is the wrong target. Customer segmentation that starts with demographics will keep you aimed at the parents. Behavior will not.
A segment is real only when it repeats, pays full price, and clears the contribution floor after its own acquisition cost. Cohort size is the second filter, not the first.
The narrower promise often wins here. Fewer features, one occasion, and a buyer who does not need a coupon can raise contribution and cut operational complexity at the same time.
A position earns its place when customers understand it and the numbers still work after channel costs. Give the product one primary job, then prove that job with evidence a shopper can check. A long list of benefits can blur the choice and leave the buyer unsure what the product does better.
Research published in the Journal of Consumer Research examines how shoppers respond to specialized and all-in-one products. Use specialization as a positioning hypothesis, not proof that your product outperforms alternatives. Test whether buyers recognize the primary benefit, and whether the margin at the required price covers channel fees, storage, returns, and advertising.

For [segment] who [occasion or problem], [product] is the [category role] that [primary job], because [proof], unlike [named alternative], which [trade-off].
Use this as a hypothesis, not a finished claim. For example: for office workers who skip lunch, a protein bar is the snack intended to hold hunger until mid-afternoon. If the brand claims its 20 g of protein supports that outcome, test the claim with customers and substantiate it before using it in marketing. Compare the product with a named alternative, such as a candy bar, without asserting an untested effect. One segment, one occasion, one alternative, one measurable reason. If buyers need several unrelated explanations to understand the benefit, sharpen the position.
Repeat that hierarchy across titles, packaging, and paid search. Treat secondary benefits as supporting evidence, not competing promises. Check that each proof point holds for the product customers actually receive and that the price leaves room for channel costs.
NielsenIQ discusses brand positioning in relation to customer values. Use that idea only when the product can substantiate the promise: sourcing, formula, service, and price all need to support it. State the boundary clearly. The protein bar does not claim to be a meal, a diet, or the cheapest calorie in the aisle. A credible position says what the product does, shows how buyers can check it, and makes clear what it does not promise.
A price position only works if its contribution survives fulfillment, storage, returns, and advertising. Set the fee stack before committing to a price. Nielsen discusses premiumization in relation to differentiated offers and customer needs. Treat any premium-price threshold as a planning assumption to verify against the report and your category, not a universal rule. A higher price needs a clear reason to exist, and cosmetic changes rarely support a durable gap once promotions begin.
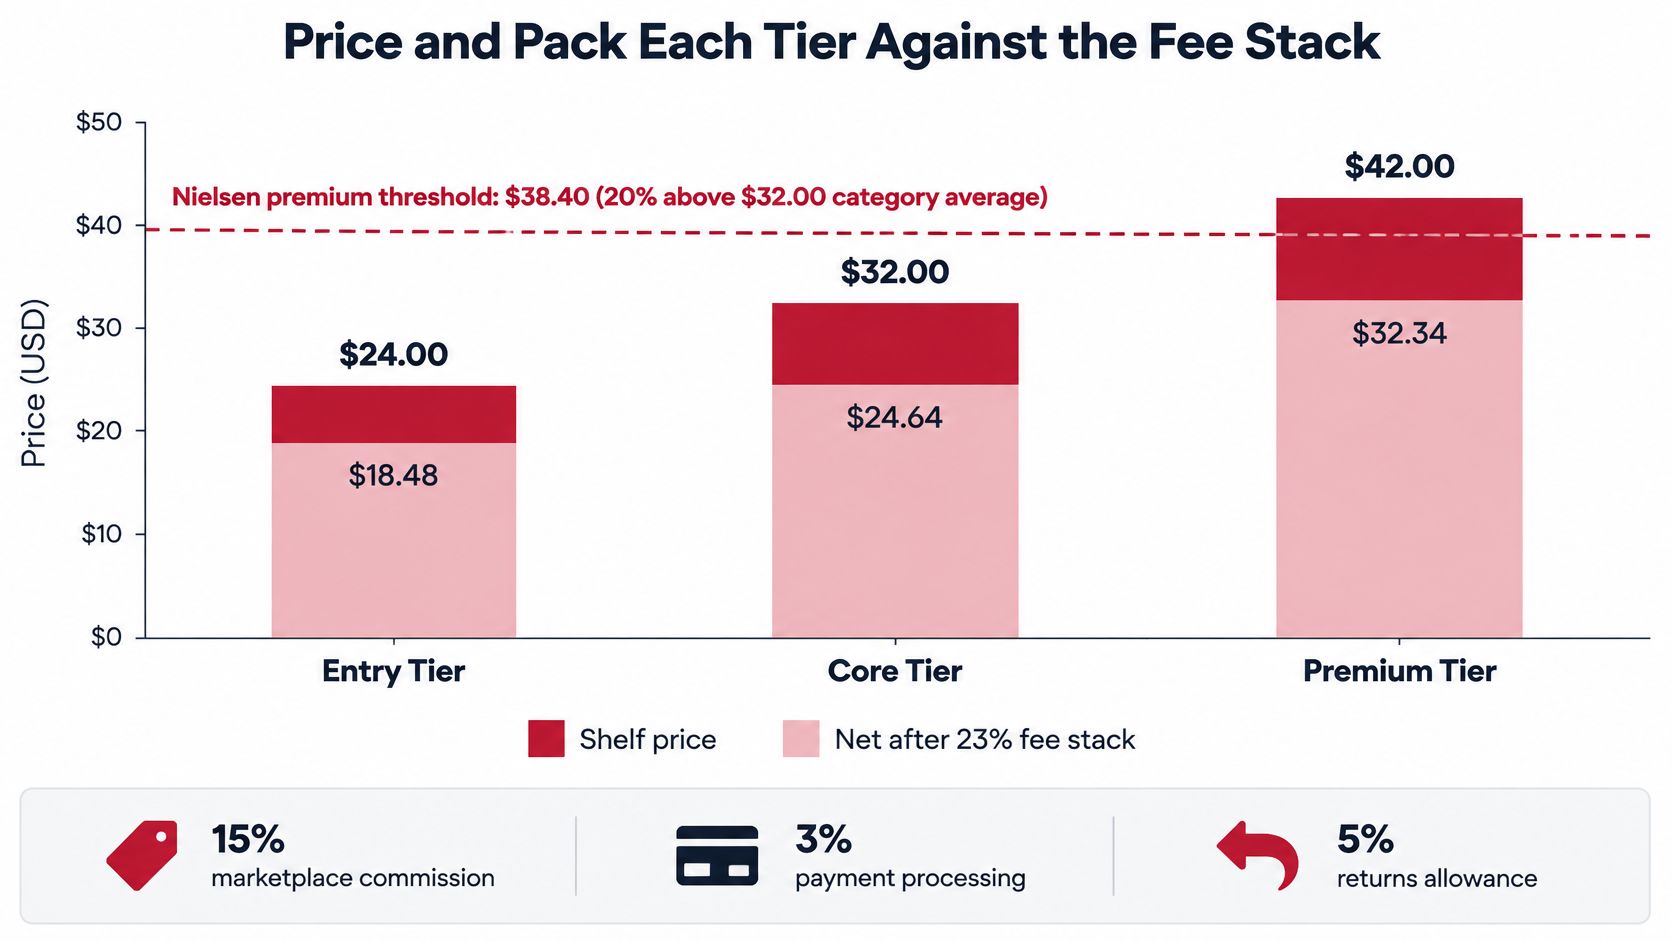
Use the chart as a planning view, not a substitute for your own referral, payment, fulfillment, storage, returns, and advertising costs. Model entry, core, and premium tiers. For each, estimate conversion, repeat purchase, promotion dependence, and contribution. A higher list price earns its place only if the added margin offsets any loss in orders and the discounts you expect to run.
Walmart Fulfillment Services publishes fees that should be checked against the current rate card before setting prices. Use the linked pricing information to build a working estimate, then confirm applicable fees for the product and fulfillment setup. Walmart's weight guidance advises accounting for packaging weight. A product that appears to fit one weight tier can cross into another once its mailer or box is included.
| Price Tier | Example Price and Packed Weight | Fulfillment Load Before Referral and Ads | Contribution Test |
|---|---|---|---|
| Entry | Example: $9.99, 1 lb packed | Model the applicable fulfillment fee and any price-based surcharge | Viable only if contribution works as a traffic SKU or in a bundle |
| Core | Example: above $10, 2 lb packed | Check the current fee for the packed weight | Positive after referral fees, COGS, and ads at the target ACOS |
| Premium | Example: above the category average, 4 lb packed | Check the current fee and any additional weight charges | Holds only if conversion supports the price and promotions stay within plan |
A larger, more protective pack may reduce damage and improve shelf presence, yet cross a fee threshold that erases the benefit. A smaller pack can lower fulfillment costs while raising the price per ounce enough to weaken the value story. How to price products should include packed weight and channel costs, not just competitors' shelf prices.
Test each tier at the target advertising cost of sales and the promotional depth you realistically expect. Include storage, returns, and fulfillment in the calculation. If the position works only before those costs, it is not a viable price tier.
Keep three things identical everywhere: the customer problem, the primary proof point, and the category role. Evidence, wording, pack architecture, and promo logic can flex. Price and promise cannot contradict, or the cheapest channel becomes the actual position.
Syndigo's omnichannel benchmarks found that 86% of surveyed U.S. and Canadian consumers said high-quality descriptions, images or video, and reviews help them choose between higher- and lower-priced options. In 2025, Atomik Research for WooCommerce and Klaviyo found that 43% of more than 6,000 consumers in the United States, United Kingdom, Canada, and Australia research on one platform and buy on another. Shoppers will see the mismatch even if your teams do not.
Channel conflict shows up as retailer complaints, reviews that disagree with the listing, and discounting that migrates to the cheapest door. A different pack count or a softer claim on one marketplace is enough to start that slide. Validate with conversion, repeat, return rate, velocity, and contribution, not awareness.
The failure that hurts most is a position that is correct and expensive to run.
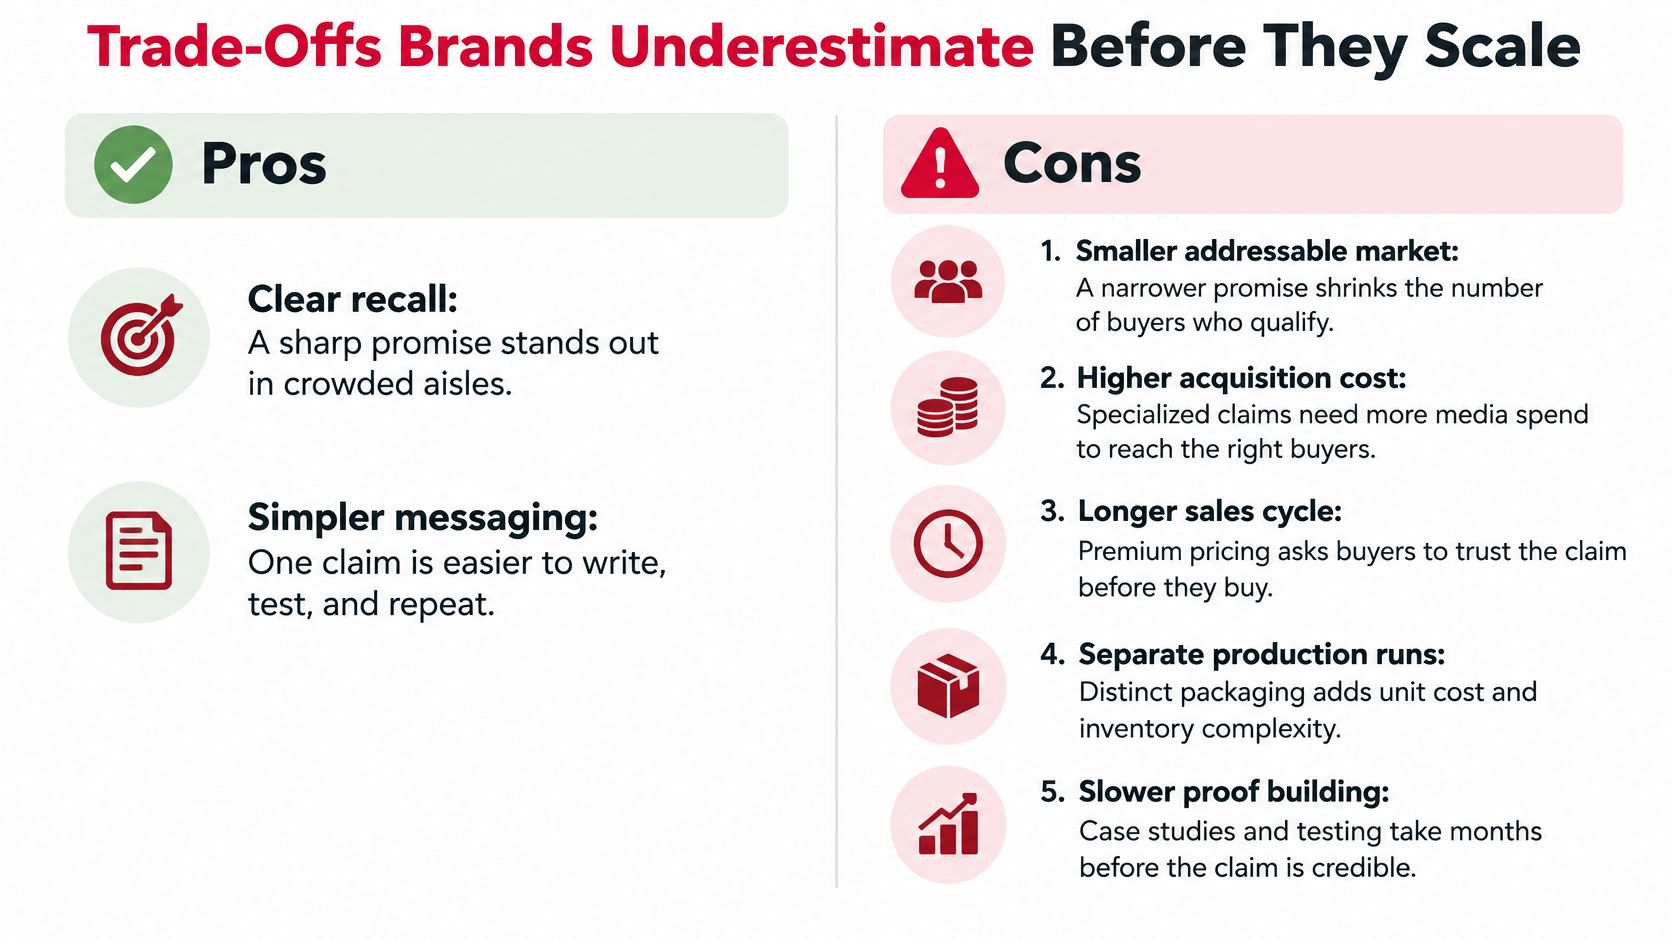
Commit 1,000 units for six months, then sell at half the forecast, and storage plus aging can erase the gross margin the premium price was supposed to create. During Foundation, tie target price and the demand forecast to carton size, sell-through, replenishment, and disposal exposure. In Optimization, watch aging and contribution together.
Attach a number and a review date to each trade-off. Debating it in the abstract is how slow inventory becomes a surprise.
Test price, pack, claim, and content as controlled variants. Judge them on incremental contribution per order, not click-through. Amazon's US 2025 fee update said that, aside from three specified updates, existing US referral and FBA fee types and rates would not change. When margin slips, do not blame a fee change you cannot find. Pressure also comes from ads, promotions, returns, storage, inbound freight, and discounting.
Take a $30 order that leaves $9 after product cost, marketplace fees, fulfillment, and variable logistics. Pre-ad contribution margin is 30%. That 30% is the break-even advertising cost of sales before fixed overhead. At a 20% ACOS, ads take $6 and $3 remains. At 35%, the order loses money before overhead. Set target price and acceptable ACOS from that pool, not from a competitor's advertised price or a revenue goal.
| KPI | How to Calculate It | Healthy Signal | Red Flag |
|---|---|---|---|
| Pre-ad contribution margin | (Price minus product cost, fees, fulfillment, and variable logistics) divided by price | Clears the target floor, such as 30% on a $30 order | Positive only after promotions |
| Break-even ACOS | Equal to pre-ad contribution margin percentage | Target ACOS set below break-even, such as 20% against a 30% ceiling | Actual ACOS above break-even |
| Conversion rate by segment | Orders divided by sessions for the target segment | Rising after content tests | Traffic rising while conversion stays flat |
| Inventory velocity and aging | Units sold per week, plus units aged 181 days or more | Turns within plan and aged units near zero | Aged units growing each review cycle |
| Return rate | Returns divided by units sold | At or below category average | Returns citing the listing or pack not matching the product |
Scale when the target segment repeats, contribution clears the floor at the target ACOS, and aged inventory stays near zero. Hold when one of those fails for two review cycles. Drop a variant when contribution stays negative after promotion. In Optimization, test bundle size and promotional depth against a defined contribution floor. Do not amplify a position that only works at list price on a spreadsheet.
If your position looks sharp on paper and thin once fees, storage, and ads hit the order, Reddog Consulting Group runs working sessions on SKU-level contribution, marketplace performance, and growth planning for CPG brands. Bring your fee reports and the current promise, and use a free 30-minute strategy call as a margin review rather than a pitch. Start with Reddog Consulting Group, or book the session at the CPG retail growth offer.
Leave a comment: