
Published: March 2020 | Last Updated:November 2026
© Copyright 2026, Reddog Consulting Group.

Most advice on how to improve click through rate starts with a better headline, a brighter image, or a higher bid. That order is wrong for a CPG brand selling on Amazon, Walmart, DTC, and wholesale-supported channels. A click isn't free just because CTR looks better in a dashboard. It can pull in low-intent shoppers, burn ad spend against thin contribution margin, and push traffic to inventory that's already costing you storage money.
Treat every CTR gain as a margin decision first. Fix relevance, prove the click converts profitably, then scale it. That's the sequence that holds up when referral fees, fulfillment, discounts, and returns hit the P&L.
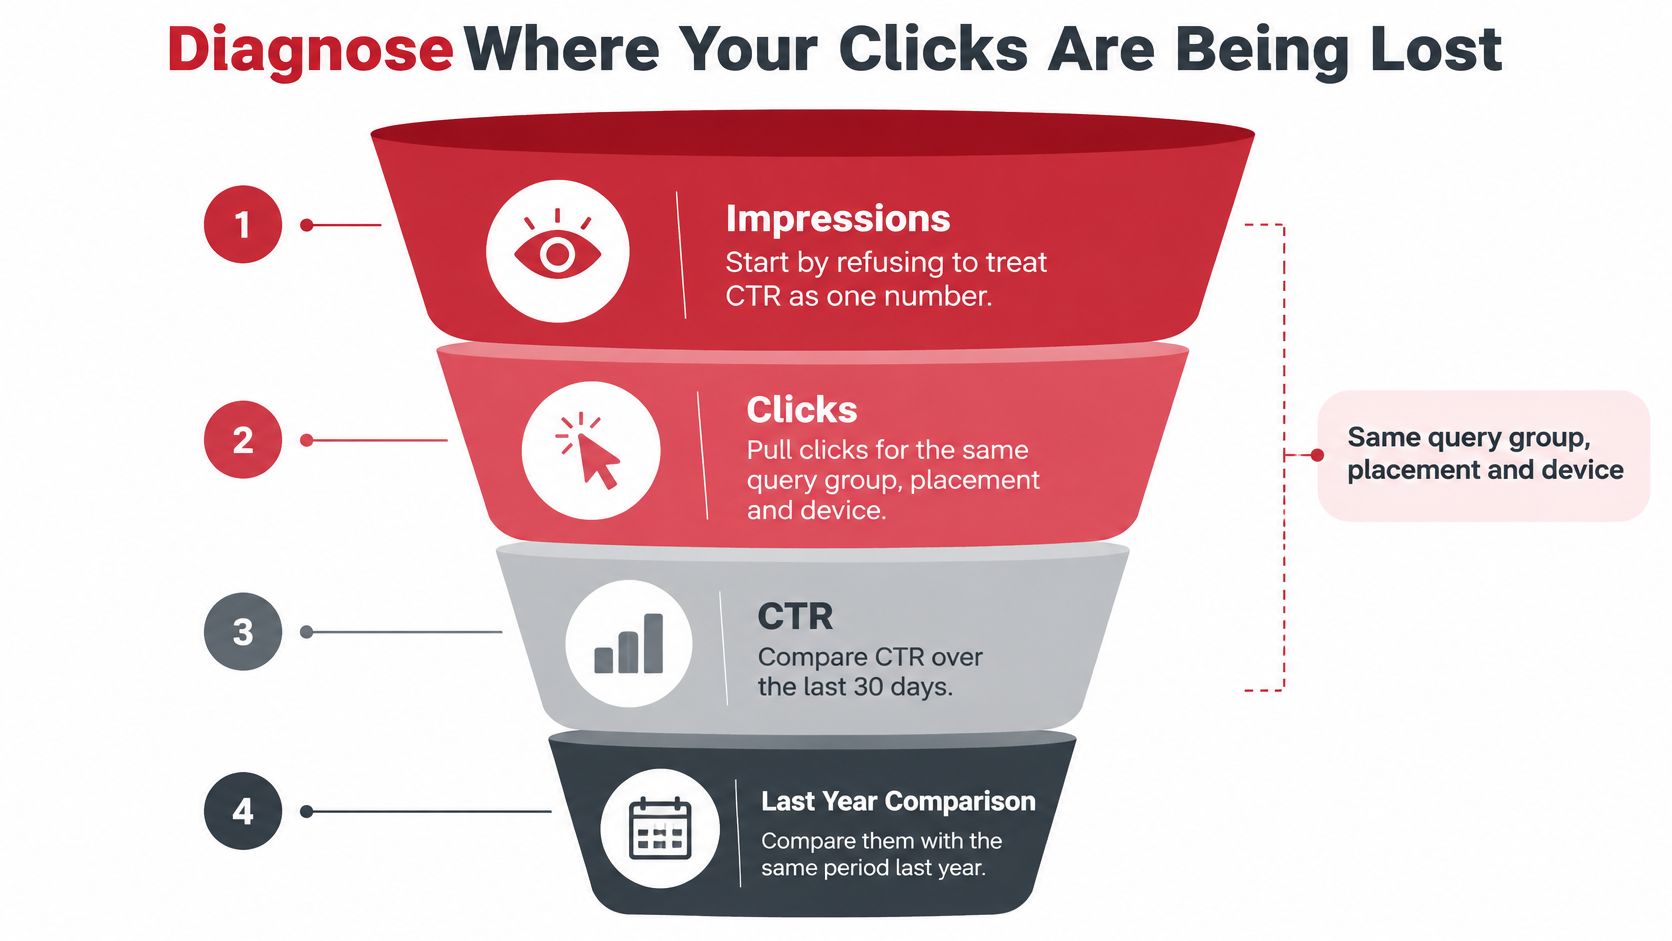
The common mistake is treating CTR as one blended number. A brand average hides the problem because branded search, category terms, competitor terms, mobile placements, and email sends don't behave the same way. Pull impressions, clicks, and CTR for the same query group, placement, and device over the last 30 days, then compare that slice with the same period last year and with the channel norm. If the query mix changed, your CTR didn't necessarily get worse. Your exposure changed.
Google's Quality Score framing is useful even outside Google Ads because it separates three failure points. The Google Ads Quality Score guidance reports the score on a 1 to 10 scale at the keyword level and evaluates expected CTR, ad relevance, and landing-page experience, each classified as "Above average," "Average," or "Below average" against advertisers showing for the same keyword during the previous 90 days.
Each component needs a different fix. Weak expected CTR means the offer isn't earning the click when shown. Weak ad relevance means the message doesn't match the searcher's intent. Weak landing-page experience means the page doesn't keep the promise after the click, so shoppers bounce instead of buying.
Build a simple funnel for each channel. Start with impressions, then clicks, qualified sessions or add-to-cart, purchases, and finally contribution after fees and discounts. Find the stage where the drop is largest against that channel's norm.
Two checks catch most false alarms. First, a CTR drop may come from a new placement, a shift toward broader query matching, or branded terms falling out of the mix rather than a weaker listing. Second, a CTR rise with no sales lift usually means curiosity, not demand. That second pattern is expensive in paid search because you pay for every curious click.
| Channel | Primary CTR metric | Check first | Common trap |
|---|---|---|---|
| Amazon Sponsored Products | Click-through rate by search term | Search term report, grouped by intent | Branded terms inflating the average |
| Walmart ads | CTR by query group and placement | Placement split and query mix | Comparing new and mature listings |
| Organic search snippets | CTR by query and page | Query-level impressions and position | Blaming the title when AI answers cut clicks |
| Category and product list pages | Product-card click rate | Clicks by device and filter use | Clicks rising while add-to-cart falls |
| Email and newsletter | Clicks divided by delivered | Clicks by segment and send type | Comparing a sale send to the all-industry average |
Clean up wasted impressions before you rewrite anything. Broad terms that don't match pack size, use case, or product form dilute CTR and waste spend, which is why NotFair's guide to negative keywords is a practical reference for tightening Google Ads query control. Removing the wrong traffic often raises CTR faster than new copy, and it doesn't cost you a creative revision.
Practical rule: Don't test a new title until you know which funnel stage is losing money. A title fix won't repair a landing page that contradicts the ad.
Close the diagnosis with a one-page sheet. Name the channel, the worst stage, the single change you'll test first, and the number that will prove it worked. Keep CTR on that sheet, but put conversion rate and contribution per visit beside it. If you can't state the guardrail metric, you're not ready to test.
Order matters because each fix changes what the next one can prove. Rewrite the title, swap the image, and add a coupon in the same week, and you get a number you can't interpret. Work through these six steps in sequence, and keep the holdout clean.
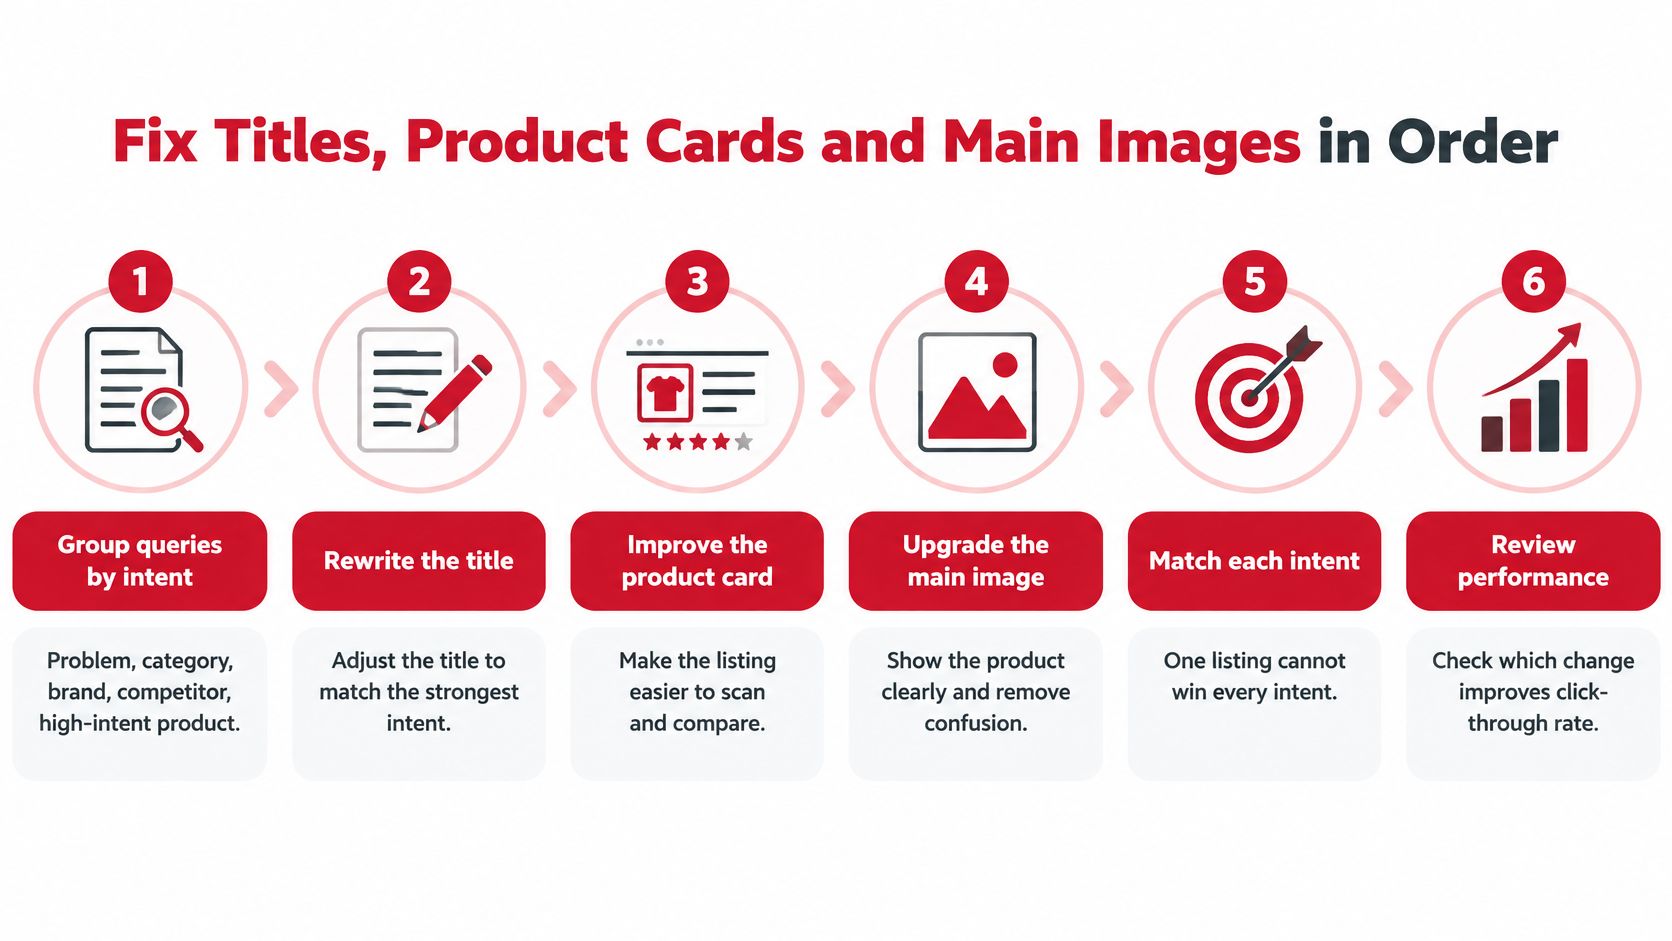
The research behind step 6 is blunt about how much work lists usually need. The Baymard product list research found that 36% of sites had product-list flaws severe enough to harm users' ability to find and select products, and that sites typically required about 35 design changes to reach optimal usability. Expect the first fix to expose the next bottleneck. Plan a second test, and check how your category's shoppers filter and compare before copying a generic layout.
Add video after the title, image, and card data are accurate. The Amazon Sponsored Products page reports that Sponsored Products campaigns using video achieved a 67% higher click-through rate and a 9% higher conversion rate than campaigns without video in the comparison it cites. Treat that as a comparative result, not a guarantee for your SKU.
Video earns its production cost when it answers the objection blocking the click or the sale. Show package size, preparation, dosage, texture, or the use occasion. Don't spend the opening seconds on a logo animation.
The walkthrough below is useful for seeing how image and creative choices play out at listing level before you brief your own test.
If video lifts CTR on a hero SKU but conversion falls because the new traffic expected a different pack size, treat it as a targeting and message problem you now have to pay to clean up. Judge video on ACOS and contribution after referral, fulfillment, coupon, and product costs, and only scale it when you can fulfill the extra orders without a stockout.
Organic CTR is set in the snippet, and the snippet is set by your title, description, and structured data. Start in Google Search Console and pull impressions, clicks, and average position by query and page for the last 90 days. Separate two groups before you touch anything: pages where position held but CTR fell, and pages where position dropped. The first group has a snippet or search-result problem. The second group has a ranking problem, and rewriting the title won't fix it.
Most product and category pages rank for several intents at once. Pick the top query group by impressions and rewrite the title to front-load product type, pack size, and the primary attribute that group is searching for. A title that leads with the brand and a campaign slogan wastes the most-read characters on information the shopper didn't ask for.
Write meta descriptions that answer the purchase question directly. State the price range, availability, or the key constraint, such as caffeine content, allergen status, or compatible device. A description that pre-qualifies the shopper may earn fewer clicks from the wrong people and more from buyers, which is the trade you want on a DTC page where you're paying for fulfillment and returns.
Add Product and Offer markup only where it matches visible page content. Price, availability, brand, and GTIN in the markup must match what the shopper sees on the page. If your schema says in stock and the page says backorder, you've built a click that can't convert.
Add review rating markup only when real customer reviews appear on the page. Don't inflate counts with incentivized reviews that break platform rules, because losing rich results entirely costs more than a modest rating earns you. Rating and review count visible in the result often support the click decision, so review velocity on your highest-impression pages is a fair test variable.
Rich results appear inconsistently and can be suppressed. Judge schema by clicks per impression on the affected query group, not by whether the markup validates.
Direct effort toward queries where the shopper still has to visit to buy. Where an AI summary fully answers an informational question, the click may never happen no matter how strong your title is. Transactional queries with price, pack, and availability questions still require a visit, and that's where snippet work pays back fastest.
Storage is the cost that surprises most sellers. Referral fees are visible at checkout, but storage accrues month after month, and a traffic push that sells the wrong inventory faster doesn't solve it. The same click earns different money on different items, so fee structure comes before any decision to chase more clicks.
Walmart's published marketplace terms state that sellers pay no setup, monthly, or hidden fees, while referral fees are deducted from completed purchases and vary by category and total sales price from 6% to 15%, according to the Walmart Fulfillment Services pricing page. That same Walmart Fulfillment Services pricing schedule lists storage at $0.75 per cubic foot per month from January through September, with an additional $1.50 per cubic foot per month in October through December for inventory stored more than 30 days. Items stored 366 to 450 days are listed at $2.25 per cubic foot per month, and inventory beyond 450 days at $7.50.
Run those numbers against a real SKU. A bulky item occupying two cubic feet and sitting past 450 days costs $15 per month in storage alone. If that item contributes a few dollars per unit before storage, one month of sitting can erase the margin on several sales. Treat a push on that SKU as a markdown decision, not a growth move.
Calculate contribution after referral, fulfillment, advertising, discounts, returns, and expected storage. Not after product cost alone. The referral fee example makes the point: a $20 item facing a 15% referral fee loses $3 before fulfillment or advertising. If only $5 remains before ads after referral, fulfillment, and product cost, break-even ACOS is 25%. Any campaign running above that line loses money on every order it generates, no matter how strong the CTR looks.
Sort your SKUs into two groups before you allocate traffic.
Amazon works on the same logic with its own referral and fulfillment schedule, so run the same contribution test there before you compare channels. Our comparison of Walmart Marketplace and Amazon lays out where the two fee structures diverge for sellers deciding where a SKU belongs first.
The decision rule is simple. Push CTR only on SKUs that will sell through before the next storage tier applies, and pause the push on any SKU whose days of supply are rising. That is the whole test: a click is worth buying when the margin survives every fee attached to the unit it sells.
Start with one formula and refuse to raise a bid until you've run it. Break-even ACOS equals contribution before advertising divided by selling price. That single number tells you the most you can spend on ads per sale before the order loses money.
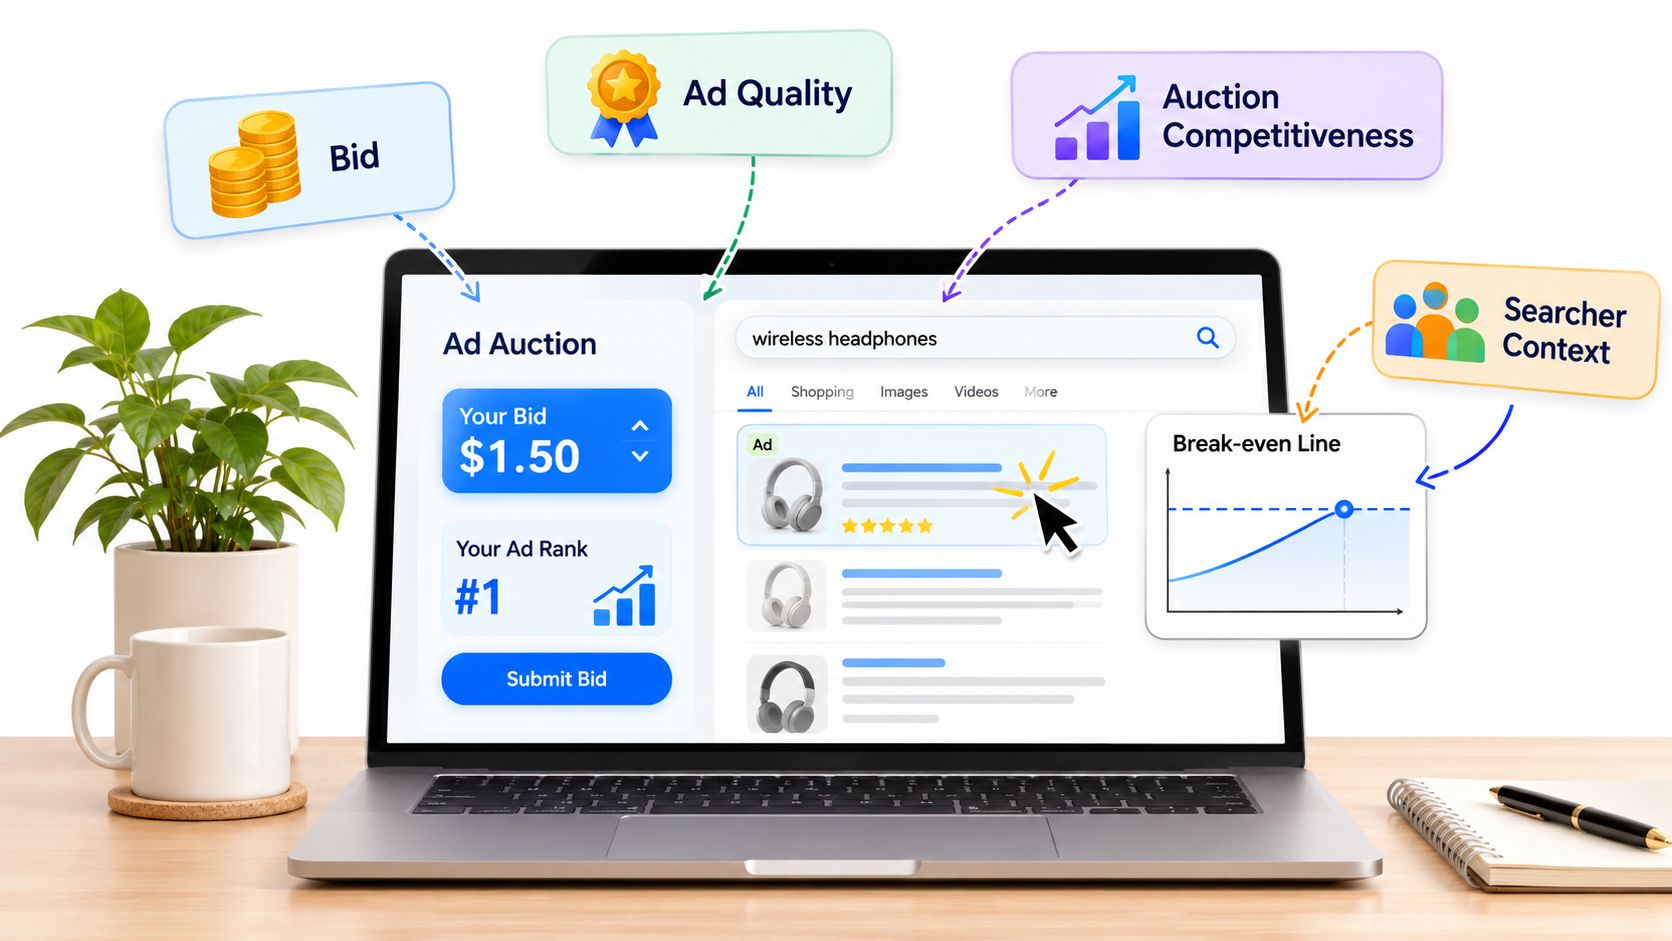
The auction context matters, but it doesn't change your ceiling. The Google Ads Ad Rank guidance explains that Ad Rank is recalculated in each auction and considers the bid, ad quality, Ad Rank thresholds, auction competitiveness, the searcher's context including location, device, time, and query, and the expected impact of assets or ad formats.
Expected CTR affects visibility, but it never works alone. A higher bid buys more exposure, and it can also move you into auctions where cost per click exceeds the contribution left after wholesale or marketplace deductions. Winning more auctions at the wrong price is just a faster way to lose money.
| Scenario | Selling price | Contribution before ads | Break-even ACOS |
|---|---|---|---|
| Item contributing before advertising | $24 | $7.20 | 30% |
| Same item bid at 35% ACOS | $24 | $7.20 | 35%, above break-even and losing money |
| Item facing 15% referral fee | $20 | $5 after referral, fulfillment and product cost | 25% |
The worked case is the one to keep in front of your media buyer. A $24 item contributing $7.20 before advertising has a break-even ACOS of 30%. A bid strategy producing 35% ACOS may lift clicks and rank while destroying unit economics on every order. Multiply that loss across a high-velocity SKU during a promotion and a small percentage gap becomes a serious cash problem.
If you need the underlying math checked against your own catalog, our guide to calculating ACOS walks through the inputs in the order finance will ask for them.
Relevance work still matters inside the auction. The Google Ads guidance on Quality Score and auction quality states that higher-quality ads can produce lower prices and better ad positions, while Quality Score itself is a diagnostic rather than a direct auction input. Improve relevance to bring your CPC down at the same position. Don't chase the score as a target in itself.
A campaign generating strong CTR but losing money after marketplace fees, fulfillment, discounts, and product cost is not a success. The metric that matters is profitable revenue per impression.
Apply the Foundation, Optimization, Amplification sequence here. Resolve query intent and offer relevance first, improve CTR and conversion second, and scale bids only where incremental contribution stays positive. I would not approve a bid increase on a query group that hasn't held conversion at target ACOS for a full test window.
Three published benchmarks give three different answers, and all three are measuring different senders. Pick the one closest to your business before you judge a single send.
The HubSpot State of Marketing benchmark for ecommerce email CTR reported a 2.4% median email click-through rate for e-commerce and DTC retail in 2024, with the top quartile beginning at 5.0%. The Salesforce email benchmarks page states that a typical email marketing click-through rate falls between 2% and 5%. The Smart Insights email statistics compilation shows Constant Contact data with an overall average email click-through rate of 1.4% across industries.
For a retailer, the cross-industry 1.4% figure is a floor, not a target. Use the e-commerce median of 2.4% as your working standard and the 5.0% top-quartile figure as the stretch goal for your best segments. A promotional send to a cold segment and a replenishment reminder to repeat buyers shouldn't be judged against the same line.
A CTR problem sometimes isn't a copy problem at all. If the email lands in spam or a promotions tab your subscribers ignore, even a strong offer won't get clicked. Running a free inbox placement test before a major send helps you confirm the message is reaching inboxes, so you don't rewrite subject lines to fix a deliverability issue.
If placement is clean and CTR still sits below the median, check three things in order. First, does the subject line match the first link in the email. Second, does the first product appear above the fold on mobile. Third, is the offer clear without opening the email at all. Fix those before you test button copy or send time.
A higher CTR can be the wrong result. A test plan that treats clicks as the scoreboard will happily declare a winner that loses money on every session it produces, because a headline promising more than the product delivers lifts clicks and returns at the same time. You pay fulfillment both ways on a sale that should never have happened, and that cost never appears in the CTR column.
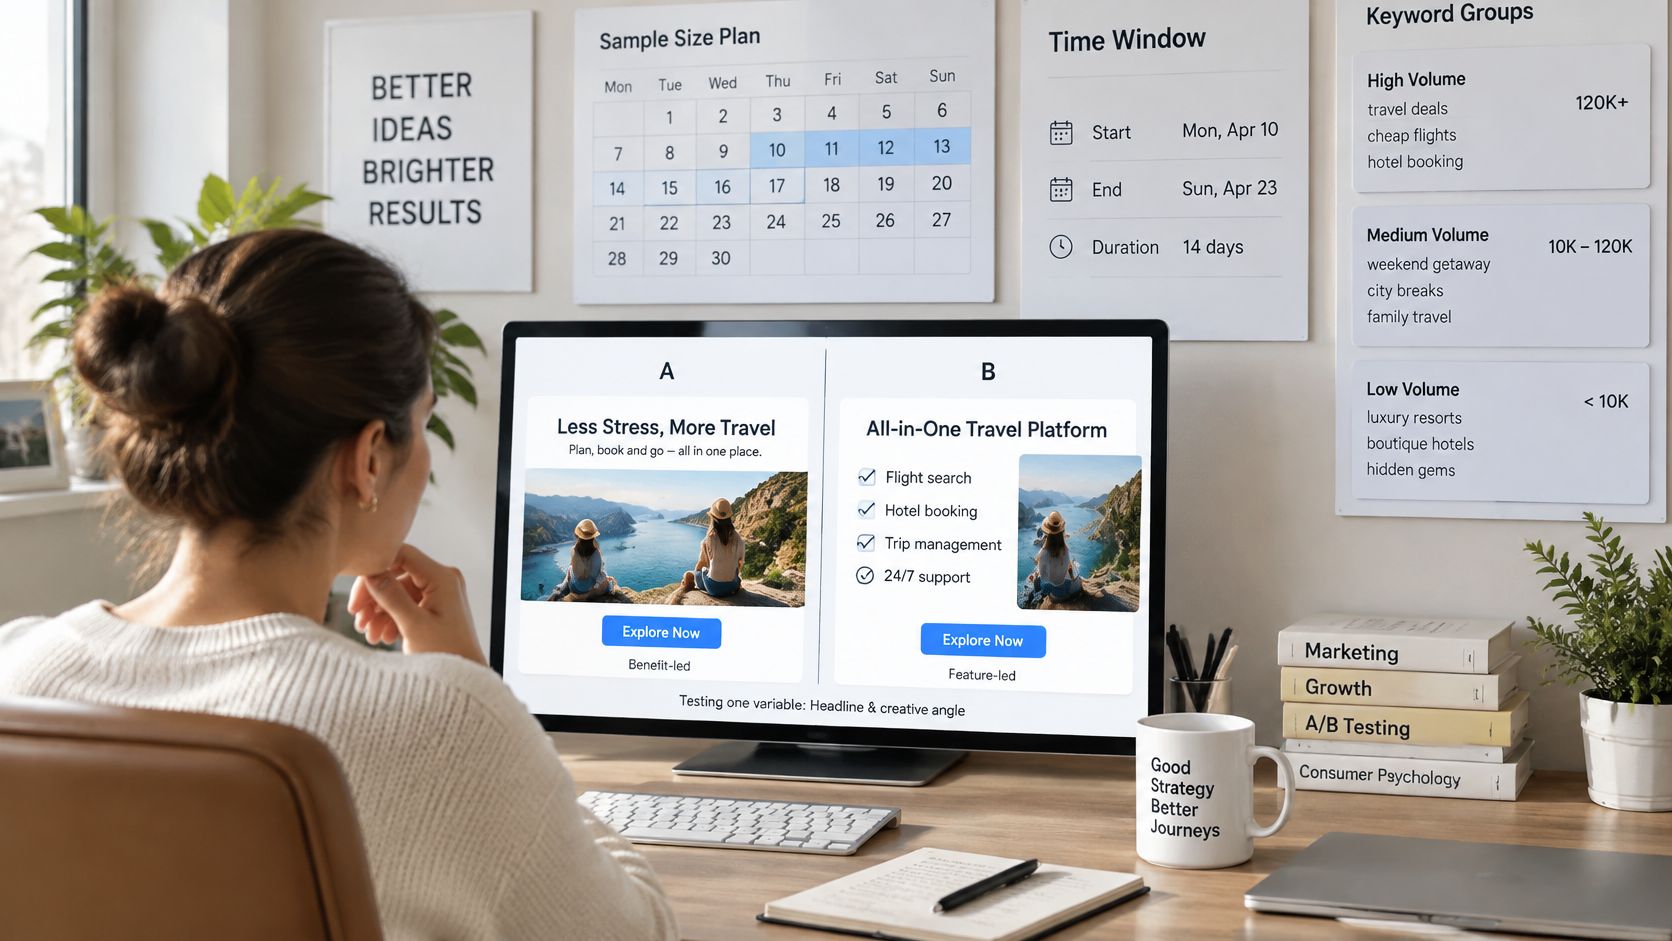
Set the sample size and time window in advance, and exclude query groups with too little volume to read. Change one variable per cell: benefit-led versus feature-led copy, price or promotion visibility, hero-image composition, or keyword placement. Change the image and the headline together and you'll know something worked without knowing what, then repeat the wrong element across the catalog.
Google's expected CTR model normalizes for position and assets before assigning a relative status, and the same discipline applies to your own reads. A variant that ran in a higher position, on a different device mix, or during a sale weekend didn't get a fair comparison. Seasonality matters twice for CPG, since storage fees accrue on the inventory behind those clicks whether or not the traffic converts.
AI summaries change what a good test result looks like. PPC statistics compiled by Hustle Marketers report that Pew Research found users clicked a traditional result in only 8% of visits when an AI summary appeared, against 15% when it did not. The same Hustle Marketers compilation notes the top organic result's CTR can fall by roughly 58% when an AI Overview is present.
Read that as a margin shift, not pure loss. That same compilation reports AI-referred retail traffic converted 42% better than non-AI traffic by March 2026, reversing an earlier pattern in which it converted worse. Once the AI answer absorbs the casual research, the shoppers left to click are already close to a decision.
The real question: If your remaining visits carry higher purchase intent, how do you price the clicks you gave up?
A readout that stops at CTR cannot answer that. Measure the full chain: impression CTR, qualified-session rate, add-to-cart rate, contribution margin per visit, and assisted conversions. The variant worth scaling is the one that gives up a point of CTR and still returns more contribution per visit after referral fees, storage, and return freight.
Write variants that make product fit, use case, price, and constraints explicit. Say who the product is for, what it doesn't do, and what it costs. Messaging that filters at the click beats messaging that filters at the return label, because a curiosity-driven click costs a session, a pick fee, and often two-way shipping.
For informational and early-funnel queries, accept that an AI answer may close the question without a visit. The goal shifts from winning every click to being the brand cited and remembered when the shopper is ready to buy. Spend CTR testing budget on transactional queries where the click still controls the sale, and judge every variant on incremental profit, not click count.
Run these five steps in order. Stop at the first one where the economics fail.
That order maps to Foundation, Optimization, Amplification. Listings and fee math come first, tested improvements second, paid scale last. Before changing bids, recheck the fee schedule, storage rate, and break-even ACOS. A click that clears your CTR target but misses break-even ACOS loses money on the sale.
If you want a second set of eyes on the baseline, RedDog Consulting Group offers a free 5-point growth audit to gauge next steps. Request the free 5-point growth audit to review your CTR baseline against your channel economics before you scale clicks.
If CTR is rising but contribution isn't, Reddog Consulting Group can help you rebuild the work in the right order, from listing and fee foundations through tested optimization to disciplined amplification across Amazon, Walmart, and DTC. Bring your baseline, fee schedule, and break-even ACOS, and we'll pressure-test them against your channel economics. Visit Reddog Consulting Group to start that conversation.
Leave a comment: