Published: March 2020 | Last Updated:January 2026
© Copyright 2026, Reddog Consulting Group.

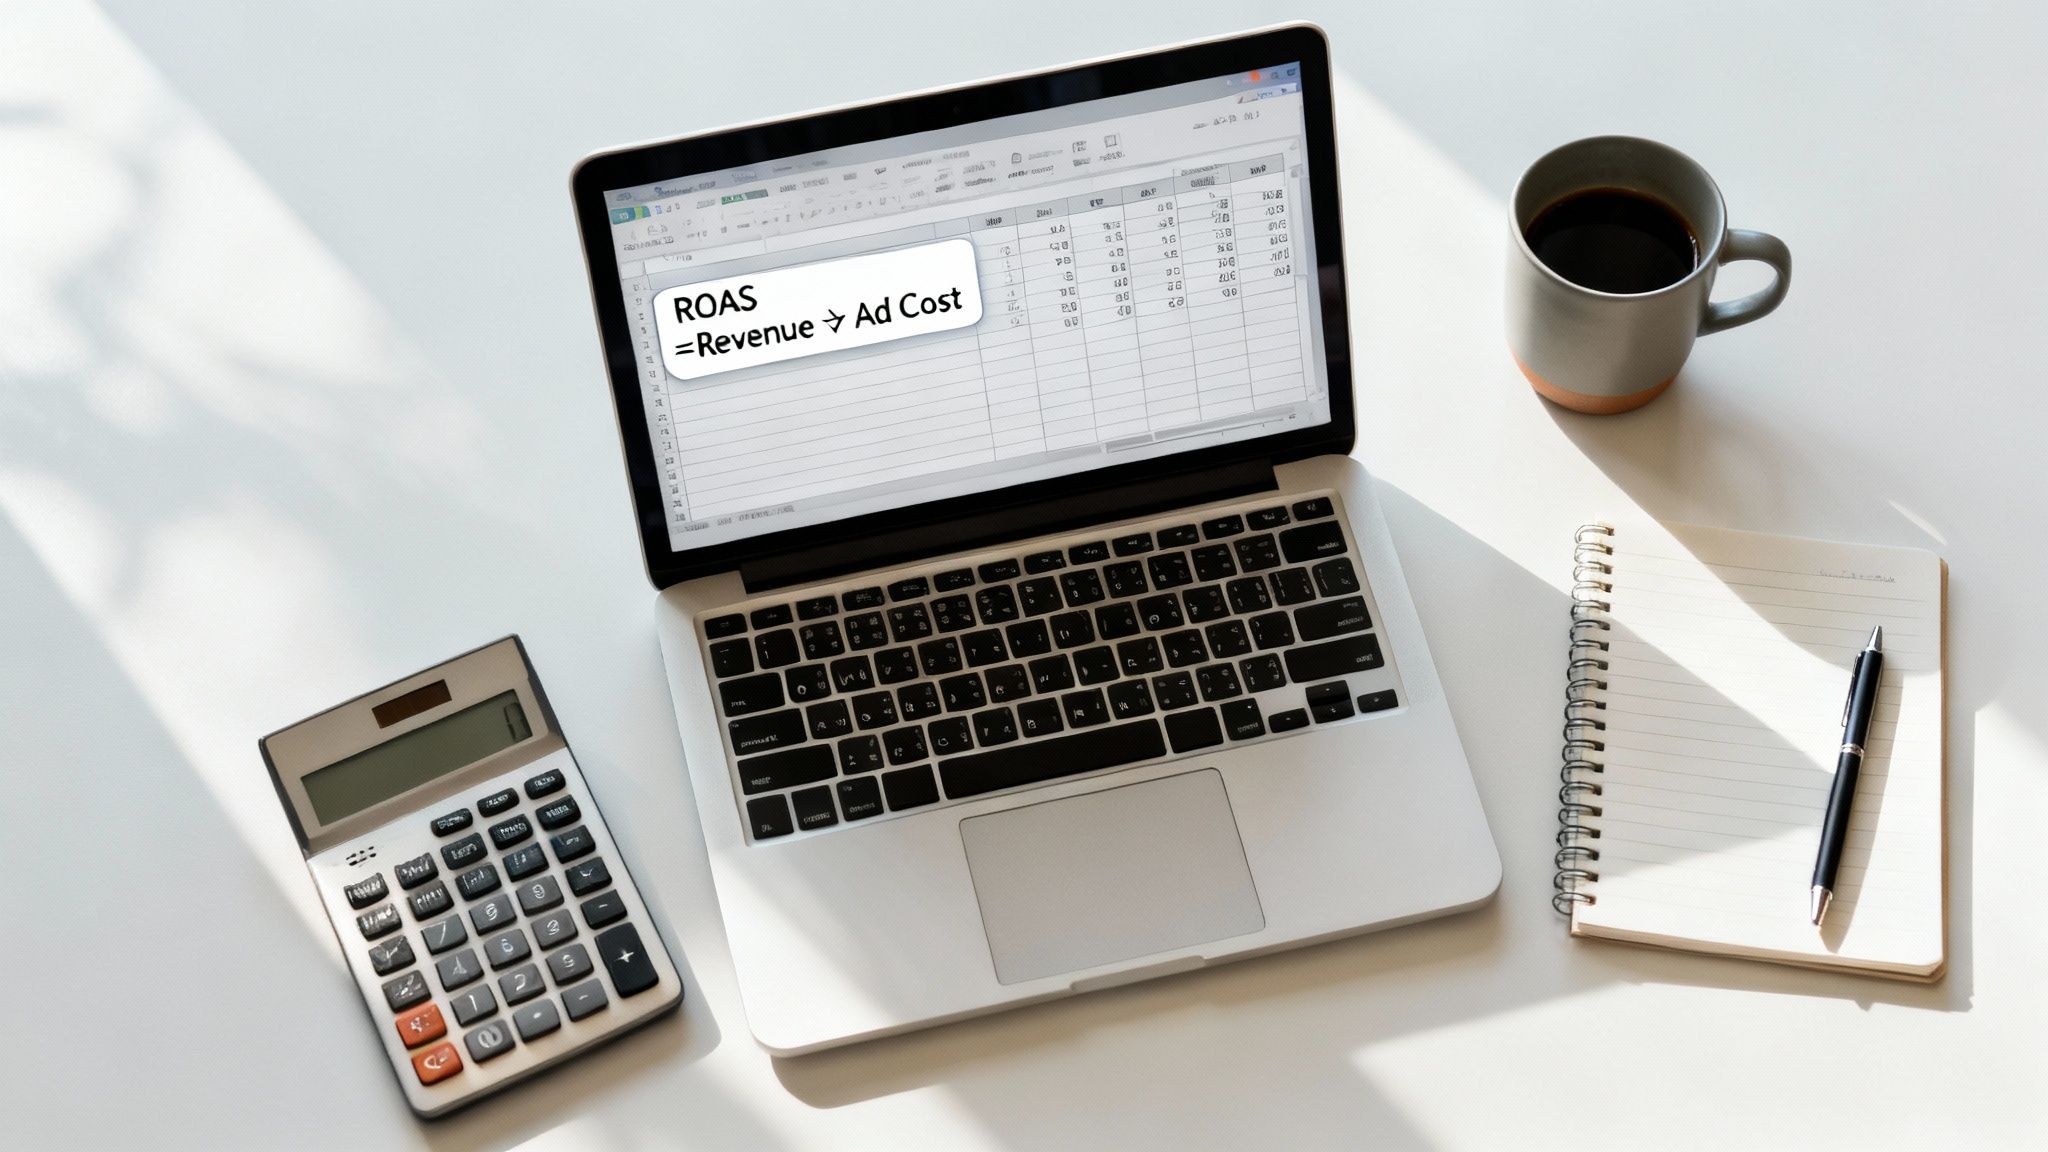
Calculating your Return on Ad Spend (ROAS) is straightforward: divide the total revenue from an ad campaign by its total cost. This single metric cuts through the noise of clicks and impressions to reveal what's actually driving profitable growth for your brand.

Pouring money into ads without knowing the return is just gambling. ROAS is the compass that guides your budget, connecting every dollar spent directly to your bottom line. In a world drowning in metrics, ROAS stands out because it measures what truly matters: profitable revenue. It answers the simple, yet crucial, question: "Is this ad spend actually making us money?"
At RedDog Group, we build client strategies on a powerful framework: Foundation → Optimization → Amplification. A solid understanding of ROAS is the bedrock of this process, providing the clarity needed for sustainable, omnichannel growth.
Consider an eCommerce brand managing over 30,000 SKUs on Amazon and Walmart. To determine if their PPC campaigns are paying off, they look at ROAS. If they invest $100 into Google Ads and generate $400 in sales, their ROAS is a solid 400% (or 4:1), which aligns with the industry benchmark for eCommerce. You can learn more about advertising trends and benchmarks here.
By focusing on ROAS, you stop guessing and start making data-driven decisions. It’s the shift from spending money on ads to investing in measurable, predictable revenue streams.
This metric forces you to look past superficial engagement. A campaign might get thousands of clicks, but if those clicks don’t lead to sales, it’s not growing your business. ROAS holds every ad, every keyword, and every channel accountable to the same high standard: profitability. Mastering this is the first step in any effective ad spend optimization strategy, ensuring your budget is always working its hardest for you.
So, you’ve calculated your ROAS. Now what? The big question is whether that number is good, bad, or just okay. The truth is, "good" depends entirely on your profit margins, operating costs, and overall business health. A 4:1 ratio is often cited as a solid benchmark, but it's not a universal rule.
For a business with high margins, a 3:1 ROAS might be incredibly profitable. For another with razor-thin margins, even a 5:1 might not be enough to break even after factoring in the cost of goods and other overhead.
To help you get a feel for what these numbers mean in the real world, here's a quick reference table.
This table breaks down different ROAS levels and what they typically signal for a business.
| ROAS Ratio | What It Means | Recommended Action |
|---|---|---|
| 1:1 | You're breaking even on ad spend, but losing money. | PAUSE IMMEDIATELY. This campaign is unprofitable once you factor in the cost of goods and other expenses. |
| 2:1 | Likely losing money or barely breaking even. | NEEDS URGENT REVIEW. Analyze your targeting, creative, and landing page. Not sustainable for most businesses. |
| 3:1 | Getting close to profitability for many businesses. | OPTIMIZE. This is a good starting point. Tweak and refine to improve efficiency and push toward a 4:1. |
| 4:1 | Generally considered a healthy, profitable campaign. | SCALE CAUTIOUSLY. You've found something that works. Start increasing the budget while monitoring performance. |
| 5:1+ | Excellent performance. Highly profitable. | AMPLIFY. This is a clear winner. Maximize your budget here and look for ways to replicate this success. |
Remember, these are guidelines. The most important thing is to understand your own numbers. Calculate your break-even point and set your ROAS targets from there. That's how you build a truly sustainable advertising strategy.
Before you can optimize campaigns or scale your ad budget, you need to get the basics right. Mastering the foundational ROAS calculation is the most direct way to measure if your ads are generating revenue and provides the essential data for building a solid growth strategy.
The formula is refreshingly simple:
ROAS = Total Revenue Generated from Ad Campaign / Total Cost of Ad Campaign
This gives you a straightforward ratio. If you spend $1,000 on an ad campaign and it generates $4,000 in revenue, your ROAS is 4:1. For every dollar you put in, you got four dollars back in revenue.
Accuracy is everything. To get a ROAS number you can trust, you need to pull precise data from two places: your ad platform and your eCommerce backend.
Let’s walk through a common scenario for a brand with a Shopify store and a Google Shopping campaign:
Once you have those two numbers, plug them into the formula. This process is nearly identical whether you're pulling cost data from Meta Ads and revenue from BigCommerce or analyzing a Walmart Connect campaign.
A common slip-up is failing to ensure your conversion tracking is properly configured. If your ad platform can't see the sales it's driving, your ROAS calculation will be fundamentally flawed from the start.
Let's put some numbers to this. Suppose your Google Shopping campaign for a new product line had the following performance last month:
Now, apply the formula:
$11,250 (Revenue) / $2,500 (Ad Cost) = 4.5
Your ROAS is 4.5:1, which you can also express as 450%. This is a strong starting point. It tells you the campaign is generating significant revenue relative to its direct cost. This foundational number is your first checkpoint; it confirms whether an ad campaign is generating top-line revenue effectively. However, it's just the beginning. It doesn't account for profit margins or other business costs, but it gives you the essential data needed to start making smarter decisions. For a deeper look into the calculation process, this guide on how to calculate Return on Ad Spend the right way is an excellent resource.
A 4:1 ROAS looks great on a dashboard, but what does it really tell you about your business's health? That surface-level number proves you’re generating revenue, which is a fantastic start. But it doesn’t tell you if you’re actually making money.
To build a truly sustainable growth engine, you have to move beyond this basic metric and ask a much tougher question: "Is this campaign actually profitable?" This is where the conversation shifts from simple revenue to real profit, a core principle in our Foundation → Optimization → Amplification framework.
The basic formula gives you what’s known as Gross ROAS—a measure of revenue efficiency. To get to the heart of profitability, you need to calculate Net ROAS, which factors in all the costs tied to selling your products.
The game-changing difference is the inclusion of your Cost of Goods Sold (COGS) and other variable expenses like shipping, fulfillment, and payment processing fees. Ignoring these costs gives you a dangerously incomplete view of your performance.
Let's walk through a real-world scenario. Imagine you're selling a premium coffee blend on your Shopify store.
Using the basic formula, your Gross ROAS is a killer 5:1 ($5,000 / $1,000). On paper, this looks like a massive win. But let's factor in the actual costs.
Now, your total cost for those 200 bags is $3,400 (200 x $17). When you subtract this from your revenue, your profit is only $1,600. Your ad spend was $1,000, so your actual net profit from the campaign is just $600. Suddenly, your Net ROAS is 1.6:1 ($1,600 / $1,000)—a far cry from the 5:1 you started with.
A high Gross ROAS can easily hide an unprofitable campaign. Net ROAS is the metric that connects your advertising directly to your P&L statement, providing the clarity needed for smart, profitable scaling.
This comparison shows why diving deeper is non-negotiable for serious omnichannel growth.
Looking at the two methods side-by-side highlights the difference between a surface-level check and a true profitability analysis.
| Metric | Basic ROAS | Net ROAS (True Profitability) |
|---|---|---|
| Formula | (Total Revenue) / (Ad Cost) | (Revenue - COGS - Other Variable Costs) / (Ad Cost) |
| What It Measures | Revenue generated for every dollar of ad spend. | Profit generated for every dollar of ad spend. |
| Primary Use Case | Quick, high-level assessment of campaign revenue efficiency. | In-depth analysis of a campaign's actual contribution to the bottom line. |
| Potential Blind Spot | Fails to account for product margins and can make losing campaigns look good. | Requires more data inputs but provides a far more accurate view of financial health. |
One tells you what you're making in sales; the other tells you what you're actually keeping.
Once you have a handle on your true costs, you can calculate one of the most powerful metrics in your arsenal: Break-Even ROAS. This is the absolute minimum ROAS a campaign must achieve for you to not lose money. Anything below this number means you're paying to give your products away.
The formula is straightforward:
Break-Even ROAS = 1 / Profit Margin
Let's stick with our coffee example. The retail price is $25, and the total cost per unit is $17. That leaves a profit of $8 per bag.
This means your campaign must hit a Gross ROAS of 3.13:1 just to cover the cost of the product and the advertising. Your initial 5:1 Gross ROAS looked amazing, but now you know that if it ever dipped below 3.13:1, you'd be actively losing money with every single sale.
Another advanced concept is Incremental ROAS, which measures the sales lift truly caused by your ads, filtering out sales that would have happened anyway. Think about it: a branded search campaign for your company name will almost always have a sky-high ROAS. But how many of those customers were already looking for you and would have converted without the ad?
Calculating this with perfect precision often requires complex lift studies. However, thinking about it conceptually helps you evaluate campaign performance more critically. It pushes you to ask: "Is this ad creating new customers, or just capturing demand that already exists?" This distinction is vital for allocating your budget to campaigns that drive genuine brand growth and amplification.
An omnichannel strategy requires a tailored approach. A single, universal ROAS target doesn't work in the real world. How you calculate and interpret performance for an Amazon Sponsored Brands campaign is entirely different from a TikTok awareness video or a Google Shopping ad.
To succeed with an omnichannel approach, you need channel-specific intelligence. That means getting into the weeds of each platform—from their unique attribution models to their reporting quirks—so you can make informed decisions about where your ad budget goes.
Let's break down how to calculate ROAS on the most critical channels: major marketplaces like Amazon and Walmart, and your own DTC storefront on a platform like Shopify.
On marketplaces, your ad spend does double duty: it drives immediate sales and improves your organic ranking over time. This makes the ROAS calculation more layered. Here, metrics like ACoS and TACoS are part of the conversation.
When calculating ROAS for these channels, don't just glance at the number in the ad console. Consider the broader impact on your product's organic search placement and its overall sales velocity.
For your own DTC site, you're tracking revenue from a diverse mix of traffic sources like Google, Meta, and TikTok. Data integrity is everything, and it comes down to your tracking setup.
Accurate UTM parameters are non-negotiable. These tags added to your URLs tell your analytics platform exactly where a user came from, allowing you to attribute sales to specific campaigns. A robust omnichannel attribution model is essential for getting this right.
An omnichannel brand might see a high ROAS on a Google branded search campaign and a lower one on a Meta prospecting campaign. The key isn't to cut the "underperforming" campaign, but to understand its role in the customer journey and measure its contribution accordingly.
Benchmarks provide context. Google Ads might average a 2:1 ROAS, but competitive retail sectors push for 4:1, especially with Shopping ads. Meta can deliver 4:1 on average and sometimes soar to 6:1 with smart retargeting. The general consensus is that a 4:1 (400%) ratio is often the gold standard for profitable growth on a brand's Shopify site.
This concept map shows how you should progress from a basic ROAS calculation toward a more sophisticated, profit-focused analysis.
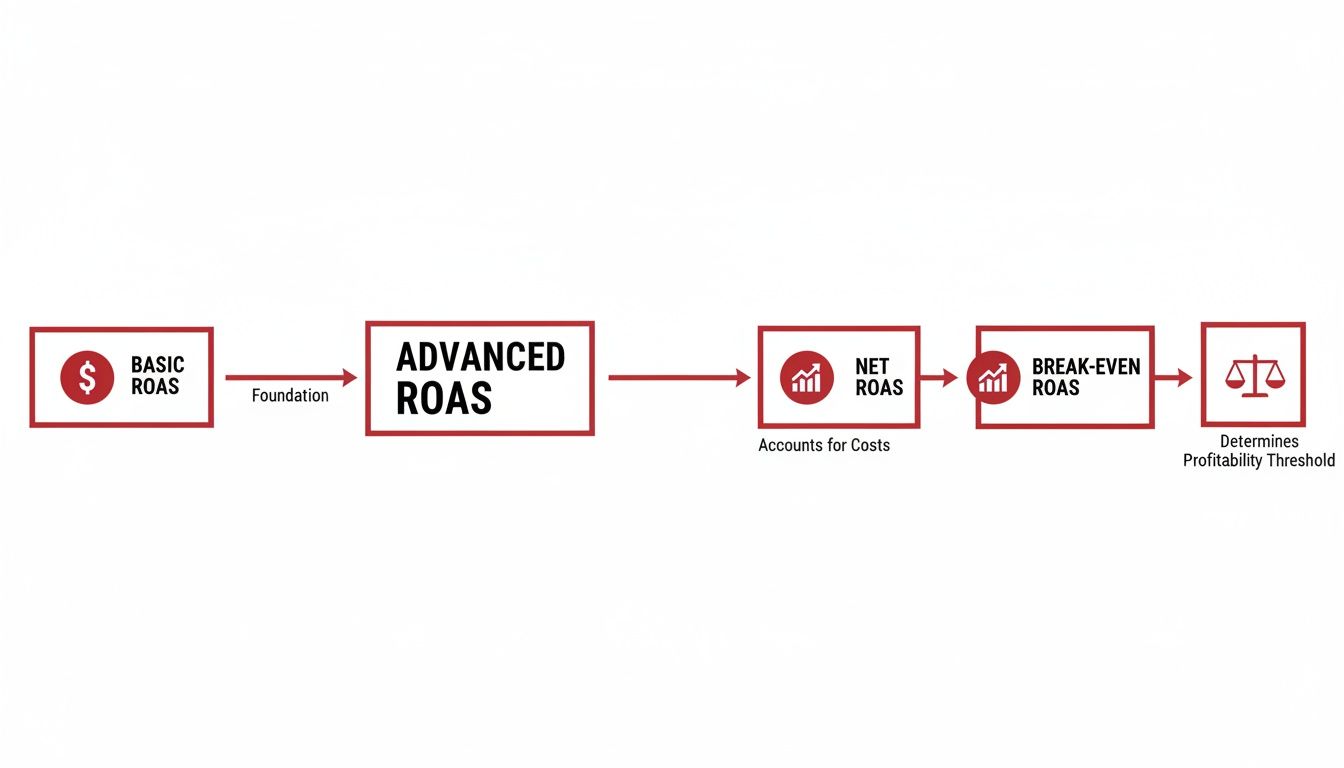
This visual journey makes it clear: while basic ROAS is a good starting point, understanding your Net and Break-Even ROAS is where true strategic clarity begins.
For example, measuring ROAS specifically for your Paid Search Advertising efforts can reveal the direct profitability of those campaigns. A clear-eyed view of your ROAS helps you optimize your budget, ensuring you invest more in channels that not only drive revenue but also contribute to your bottom line. It's a foundational step in building a resilient, scalable growth strategy.
Calculating ROAS is one thing; getting it right is another. That simple formula can hide a world of complexity, and small missteps can lead to flawed data and poor strategic decisions. To get your ad spend working for you, you have to know where the traps are.
One of the most common errors is an over-reliance on last-click attribution, which gives 100% of the credit for a sale to the very last ad a customer clicked. This paints a dangerously incomplete picture of the omnichannel customer journey. A customer might discover your brand through a TikTok video, see a retargeting ad on Instagram, and finally click a Google Search ad to purchase. Last-click attribution ignores the first two touchpoints, making your awareness efforts look worthless.
The Fix: Move toward a multi-touch attribution model when possible. Models like linear, time-decay, or data-driven attribution spread credit across multiple touchpoints, giving you a more realistic view of how different online and offline channels work together to drive a single conversion.
The "Ad Cost" in your basic ROAS formula often just includes the direct media spend. This is a massive oversight. To understand true performance, you must account for all costs associated with running your campaigns.
Commonly Missed Expenses:
The Fix: Expand your definition of "Ad Cost." Sum up your direct media spend plus all associated management, creative, and software fees. This gives you a true Total Ad Cost, leading to a much more honest ROAS calculation.
Judging a campaign solely on the first purchase can be incredibly shortsighted. A campaign might have a modest 2:1 ROAS on the initial transaction, but what if that same campaign acquires customers who make multiple purchases over the next year? Suddenly, its true value is much higher.
This is where Customer Lifetime Value (LTV) comes into play. LTV represents the total revenue a business can expect from a single customer throughout their entire relationship with your brand. Ignoring it means you might prematurely kill campaigns that are actually acquiring your most loyal and valuable customers.
The Fix: Start tracking LTV by cohort (e.g., customers acquired from a specific campaign). Compare the LTV of customers from different channels to their initial Customer Acquisition Cost (CAC). This shifts your focus from short-term ROAS to long-term profitability—a key move for any brand looking for sustainable growth.
Not all campaigns are created equal. A classic mistake is applying the same ROAS target to a brand awareness campaign and a direct conversion campaign. A top-of-funnel video campaign designed to introduce your brand to new audiences will naturally have a lower direct ROAS than a bottom-of-funnel retargeting campaign targeting cart abandoners. Its goal is different—it’s meant to fill the pipeline, not just close the immediate sale.
The Fix: Set different KPIs for campaigns based on their objective in the marketing funnel.
By sidestepping these common pitfalls, you move from just calculating a number to understanding the story it tells. That clarity is the foundation of any successful advertising strategy, allowing you to optimize effectively and amplify what truly works.
Once you get the hang of the formulas, real-world questions start popping up. Calculating ROAS is just step one—knowing what to do with that number is where the magic happens. Here are the most common questions we hear from brands trying to make sense of their ad spend.
This is the million-dollar question, and the honest answer is: it depends entirely on your profit margins. You’ll often hear a 4:1 ratio (or 400%) thrown around as a solid e-commerce benchmark, but that’s just a general guideline. For a business selling high-margin products, a 3:1 ROAS could be wildly profitable. A brand with razor-thin margins might need a 6:1 ROAS just to break even.
The single most powerful thing you can do is calculate your own Break-Even ROAS. Once you know the rock-bottom number you need to hit to avoid losing money, you can set a target that’s actually built for your business and your financial reality.
It's a classic scenario: your Google Ads dashboard shows one ROAS, but your Shopify analytics tells a completely different story. This is normal, and it almost always boils down to attribution modeling.
Neither number is "wrong"—they’re just telling you different parts of the story. The trick is to stay consistent. Treat your primary sales platform (like Shopify) as your source of truth for revenue, but use the data from the ad platforms to get a directional sense of what’s working and what needs tweaking.
If a campaign’s ROAS is in the gutter, it’s time to play detective. A low ROAS is a symptom, not the problem. The real issue is almost always hiding in one of three places:
Start by figuring out where the friction is. By methodically testing and optimizing each of these areas, you can systematically lift your return on ad spend and build a more efficient engine for brand growth.
Ready to stop guessing and start making data-driven decisions that grow your bottom line? At RedDog Group, we help brands build profitable, scalable advertising strategies across every channel. Let's build a growth plan that works. Let’s Talk Growth.
Leave a comment: