
Published: March 2020 | Last Updated:September 2026
© Copyright 2026, Reddog Consulting Group.

Inventory-to-sales ratio is calculated as average inventory value divided by net sales for the same period. Calculate average inventory by adding beginning inventory and ending inventory, then dividing by two, and use the result to guide reorder planning and velocity forecasting.
That distinction matters when a CPG brand is deciding whether to place another purchase order, move stock between Amazon and Walmart, or protect DTC availability. A dashboard can show healthy revenue while cash accumulates in slow-moving units, fulfillment fees rise, and contribution margin weakens. The ratio gives operators a disciplined way to connect inventory held with sales generated.
A brand can look busy and still be managing inventory poorly. The team sees orders arriving, advertising spending, and marketplace revenue moving upward, so replenishment continues by habit. Then storage charges increase, a promotion underperforms, or a key SKU runs out just before the next inbound shipment clears.
The inventory-to-sales ratio makes that tension visible. In plain language, it answers this question: how much average inventory value did the brand carry to produce its net sales during the same period? The formula is:
Inventory-to-sales ratio = average inventory value ÷ net sales
Average inventory usually means beginning inventory plus ending inventory, divided by two. Using the same measurement window for both variables is essential. Monthly average inventory belongs with monthly net sales, while an annual average inventory figure should be compared with annual net sales. Amazon's explanation of the inventory-to-sales ratio supports this same-period approach and explains why average inventory is more defensible than a single balance.

Suppose the inventory ledger reflects stock after a large inbound delivery, but the sales figure covers a period before that delivery arrived. The resulting ratio makes inventory look heavier than it was while those sales were being generated. Reverse the timing, and the ratio can look artificially lean.
That error leads to bad operating choices. A buyer might delay a replenishment because the ratio appears high, even though the stock arrived after the measured sales period. Or a founder might approve another purchase order because the ending balance looked low, even though average inventory had already risen during the month.
A clean ratio also prevents top-line sales from hiding contribution-margin problems. Inventory held in Amazon FBA, Walmart WFS, a 3PL, or a DTC warehouse carries different storage, handling, fulfillment, and working-capital consequences. A company-wide number can hide those differences, so the calculation should start at the SKU and channel level whenever the data allows it.
For a broader operating view, this guide to tracking inventory performance is useful context. The practical point is simple: use the ratio as a velocity check, not as a finance exercise that lives separately from purchasing, pricing, advertising, and fulfillment.
Start with the inventory ledger and the P&L. You need the beginning inventory value, ending inventory value, and net sales for the identical period. Net sales should reflect the sales value used in the business's financial reporting, rather than a marketplace dashboard figure that may exclude or include deductions differently.
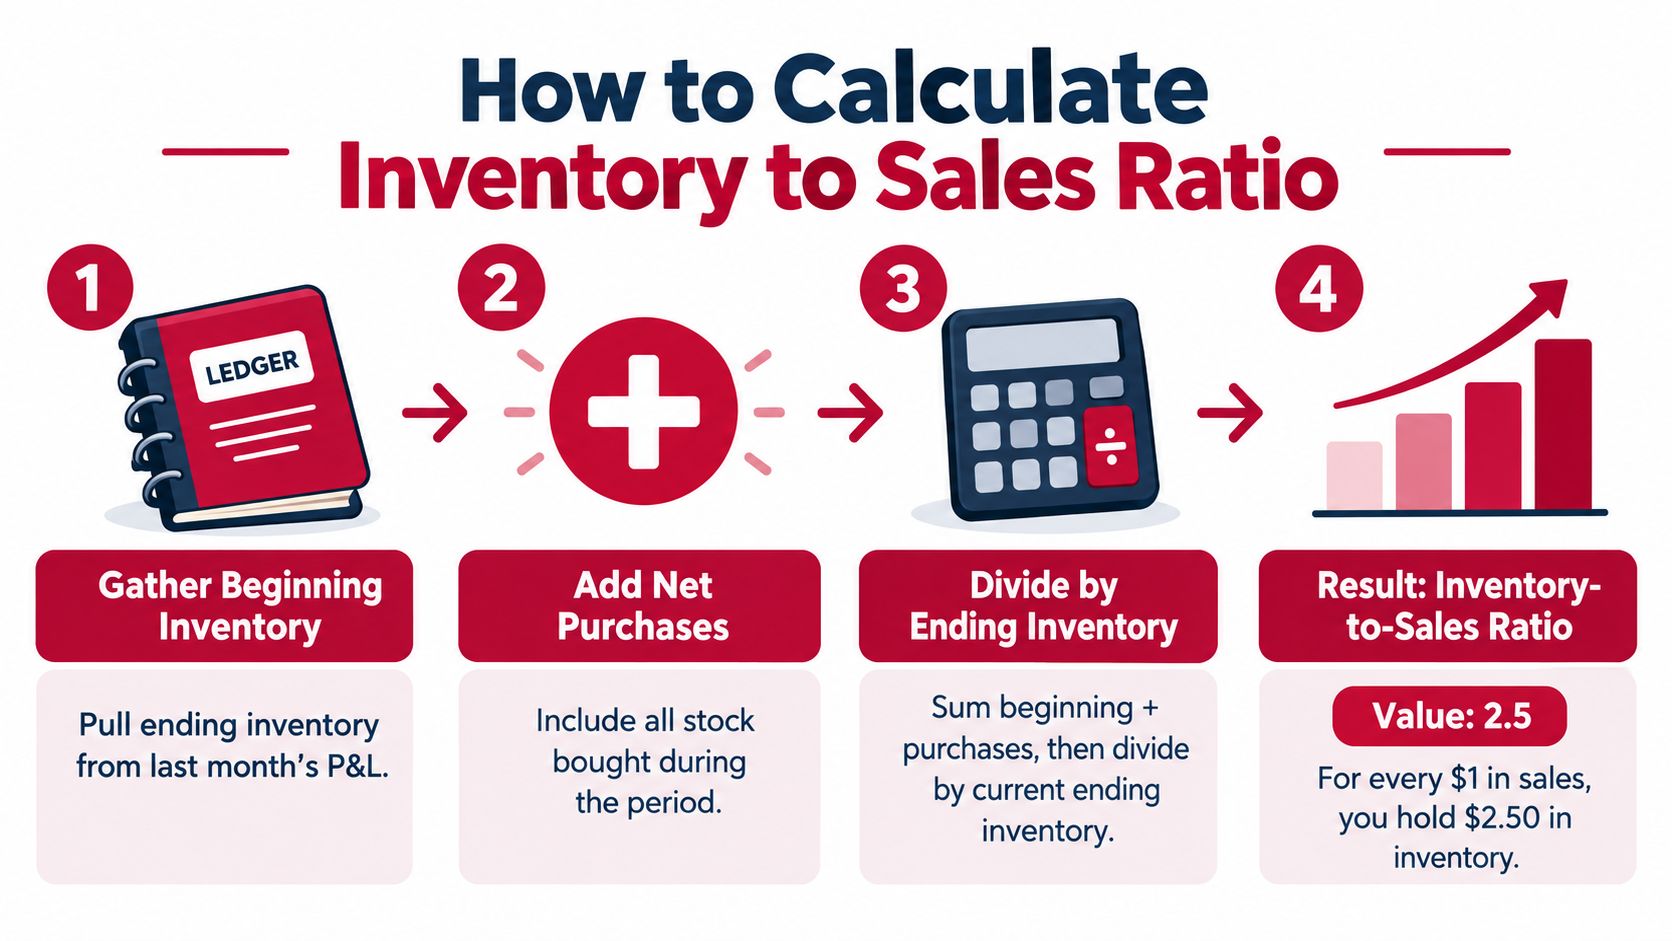
A spreadsheet can remain straightforward:
| Period | Beginning inventory | Ending inventory | Average inventory | Net sales | Inventory-to-sales ratio |
|---|---|---|---|---|---|
| Month | Beginning balance | Ending balance | (Beginning + Ending) / 2 |
Net sales for month | Average inventory / Net sales |
For example, a retailer that uses $1,000,000 in annual sales and $250,000 in average inventory can calculate sales-based inventory velocity as 4 turns per year, as shown in Retalon's inventory turnover example. That example is useful for understanding velocity, but it isn't the inventory-to-sales ratio itself. The ratio compares inventory with sales directly, while turnover is conventionally based on COGS.
Ending inventory is only one point in time. A brand can finish a month with a modest balance after selling through a large build, or finish with a high balance immediately after receiving a container. Neither snapshot tells the full operating story.
Average inventory is more useful because it reflects the inventory carried through the period. Track the calculation monthly for fast-moving SKUs across marketplaces, then review the trend alongside purchase orders, promotions, lead times, and channel sales. This walkthrough of inventory turnover provides related context, but keep the metrics separate when evaluating margin and replenishment.
The calculation becomes useful when it changes an operating decision. A rising inventory-to-sales ratio usually means inventory value is increasing faster than net sales for the measured period. That can point to slowing velocity, over-ordering, a weak promotion, pricing resistance, or a channel mix shift.
A falling ratio can indicate stronger sell-through and better working-capital efficiency. It can also signal that the brand is cutting purchase orders too aggressively, underestimating lead time, or allowing a high-converting SKU to approach a stock-out. The number doesn't tell you which explanation is correct. The surrounding operating data does.
Consider a SKU that begins with a ratio of 0.25, then reaches 0.50 after sales soften while the brand continues ordering on its old cadence. Those values are arithmetic examples of a changing relationship, not universal targets. The practical signal is that inventory is now consuming more value relative to sales, so the operator should investigate before approving another routine replenishment.
Check the change against:
Practical rule: A ratio should trigger a question, not an automatic purchase-order decision.
Use the trend to adjust order quantities, safety stock, and fulfillment mix. If the ratio is rising because Amazon inventory is slow while DTC demand remains strong, transferring or reallocating units may protect cash better than ordering more total stock. If the ratio is falling because a marketplace is consuming inventory faster than expected, the next step may be a smaller, earlier replenishment rather than a large emergency shipment.
Sales velocity is the operational companion to this ratio. This explanation of inventory velocity helps connect units sold and days available to the reorder conversation. The ratio shows the value relationship, while velocity helps determine how quickly the next units will be consumed.
A blended ratio can make a brand look stable while one channel is destroying contribution margin. Amazon FBA, Walmart WFS, and DTC don't create the same economics, even when they sell the same product at the same list price.
Amazon may provide strong demand but charge marketplace and fulfillment fees that change the contribution left after each sale. Walmart WFS can offer a different cost structure and customer reach, while DTC may retain more control over pricing and customer data but require the brand to fund its own acquisition, fulfillment, and retention economics. Inventory held in each channel should therefore be evaluated against the net sales and contribution margin generated there.
| Channel | Typical ratio behavior | Margin impact |
|---|---|---|
| Amazon FBA | Can look efficient when velocity is strong, but may rise when fees, pricing pressure, or slower sales leave stock sitting in fulfillment inventory | Storage and fulfillment charges can erode contribution margin even when revenue remains healthy |
| Walmart WFS | May show a different velocity pattern from Amazon because assortment, demand, and promotional response vary by marketplace | Lower or higher fulfillment cost changes the contribution value of each unit held |
| DTC | Can carry a leaner or heavier ratio depending on campaign timing, repeat demand, and fulfillment planning | Gross margin may look attractive until paid acquisition, shipping, discounts, and handling are included |
The right comparison uses channel-specific average inventory divided by channel-specific net sales for the same period. Don't put all marketplace inventory in the numerator and only recognized ecommerce sales in the denominator. That creates a number with no clear operating meaning.
A high ratio on a profitable DTC SKU may deserve a different response from a high ratio on a low-margin marketplace SKU. The DTC product might have enough contribution after fulfillment and acquisition costs to justify a deliberate inventory build. The marketplace product might need a price change, a tighter reorder, or a shift in advertising before more units are committed.
Inventory also has an opportunity cost. Units sitting in the wrong channel can't serve demand in the channel where they would produce stronger contribution. Before moving stock, account for transfer costs, marketplace prep requirements, delivery timing, and the risk that the receiving channel won't sell through as expected.
Operators need more than a finance dashboard here. Review the ratio beside referral fees, fulfillment expenses, storage charges, advertising cost, discounts, returns, and realized selling price. A channel that reports strong sales but leaves little contribution can mask margin leakage behind a seemingly healthy inventory relationship.
A lower inventory-to-sales ratio isn't automatically better. It can mean the brand is selling efficiently, but it can also mean the team is carrying too little stock to fulfill demand reliably. When operators cut inventory without considering lead times and demand volatility, stock-outs replace storage costs with lost sales, rushed freight, and damaged marketplace momentum.
The problem becomes more acute after fee compression. A brand may lower inventory to protect cash, then rely on emergency inbound shipments or expensive replenishment methods when demand returns. The ratio may improve temporarily, but contribution margin deteriorates because the brand paid more to keep the channel available.

Brands often underestimate four risks:
Use the ratio as a diagnostic tool, not a number to minimize blindly. Review it with open purchase orders, inbound timing, sell-through, safety stock, promotional calendars, and contribution margin by channel.
For a practical response plan after availability breaks down, Carti's stockout recovery tips offer useful operational context. Recovery shouldn't begin only after the shelf is empty. A disciplined operator watches the ratio and velocity together, then decides whether to reorder, reallocate, slow advertising, adjust price, or accept a controlled stock position.
Calculate the ratio consistently, using average inventory and net sales from the same period. Track it by SKU and channel, then compare the movement with contribution margin, pricing, advertising efficiency, open purchase orders, and fulfillment costs.
A rising ratio deserves an investigation into slow movers and purchasing cadence. A falling ratio deserves a check for lost availability before the team celebrates improved efficiency. When working capital is tight, resources on fast funding for inventory can be relevant, but financing should support a sound demand and margin plan rather than cover recurring over-ordering.
A structured growth process moves from Foundation, where the data, catalog, pricing, and channel economics are made reliable, to Optimization, where velocity and contribution are improved, and then Amplification, where profitable demand is expanded. Reddog Consulting Group can help CPG operators connect inventory planning with marketplace performance, pricing, advertising, and channel decisions.
Reddog Consulting Group offers a free 30-minute working session for qualified CPG founders and operators who need to review inventory-to-sales ratios, contribution margin, and marketplace performance. Visit Reddog Consulting Group to book a margin-focused strategy call and turn the metric into a practical growth plan.
Leave a comment: