
Published: March 2020 | Last Updated:October 2026
© Copyright 2026, Reddog Consulting Group.

U.S. retail ecommerce sales reached $1.1926 trillion in 2024, according to the U.S. Census Bureau. That's a substantial purchasing channel, but repeat revenue isn't automatically profitable revenue. A useful ecommerce retention strategy separates customers who return profitably from customers you keep paying to bring back through discounts, shipping subsidies, and advertising.
For CPG operators, the question isn't whether customers reorder. It's whether their next order contributes enough cash after product costs, marketplace fees, fulfillment, incentives, and returns to justify the effort.
Core retention KPIs, formulas and where to read them
| KPI | Formula | Where to read it | Starting read |
|---|---|---|---|
| Repeat-purchase rate | Customers with 2+ orders divided by customers in the cohort | Order export, 12-month window | Compare against your category, not a universal target |
| Time to second order | Median days between first and second order | Cohort report by acquisition month | Set against the category replenishment cycle |
| 12-month retention rate | Customers who bought again in the year divided by customers acquired | Customer database | Bluecore's 2025 overall retail benchmark is 27.4%, meaning customers purchased again the following year, as reported by Shopify |
| Cohort contribution margin | Cohort net revenue minus COGS, fees, discounts, returns and media | Finance and cohort model | Track at months 3, 6 and 12 |
| LTV:CAC | 12-month contribution per customer divided by blended CAC | Monthly acquisition model | Read alongside payback, never on its own |
| Payback period | Months until cumulative contribution covers CAC | Cohort contribution curve | Set by your cash position, not by a benchmark |
Consider a hypothetical DTC coffee brand with $42 blended CAC and a $60 first order at 35% gross margin. That produces $21 before other variable expenses. A $55 second order at the same margin adds $19.25, leaving the relationship $1.75 short of acquisition payback.
A third order of the same size brings cumulative gross contribution to $59.50. In this simplified model, payback happens at the third purchase. Actual contribution payback comes later if fulfillment, payment processing, returns, or retention spending consume that surplus.
The operating target is therefore a path to the third order, not merely a higher blended repeat rate. Start by improving second-order rate and shortening time to second order without overselling inventory or subsidizing unprofitable baskets.
Bain's loyalty analysis reports that a 5% increase in retention can increase profits by 25% to 95%, a range reflecting industry economics rather than a guarantee.
A hypothetical replenishment product consumed in 24 days and a furniture accessory can't share a sensible repeat-rate goal. Consumption, household penetration, purchase occasion, and assortment depth determine what a realistic return looks like.
Silver Spoon Agency's ways to keep existing customers can help generate tactic ideas. Filter those ideas through your unit economics before adding incentives.
Set three numbers this quarter: second-order rate by acquisition month, median days to second order, and cohort contribution at month six. Keep acquisition spend visible, and don't subtract discounts or returns twice when finance has already deducted them from net revenue.
Start with order history, not a promotional calendar. A reminder should reflect when the customer is likely to need the product, not when the marketing team has an empty send slot.
Use this process to turn purchase records into replenishment groups.
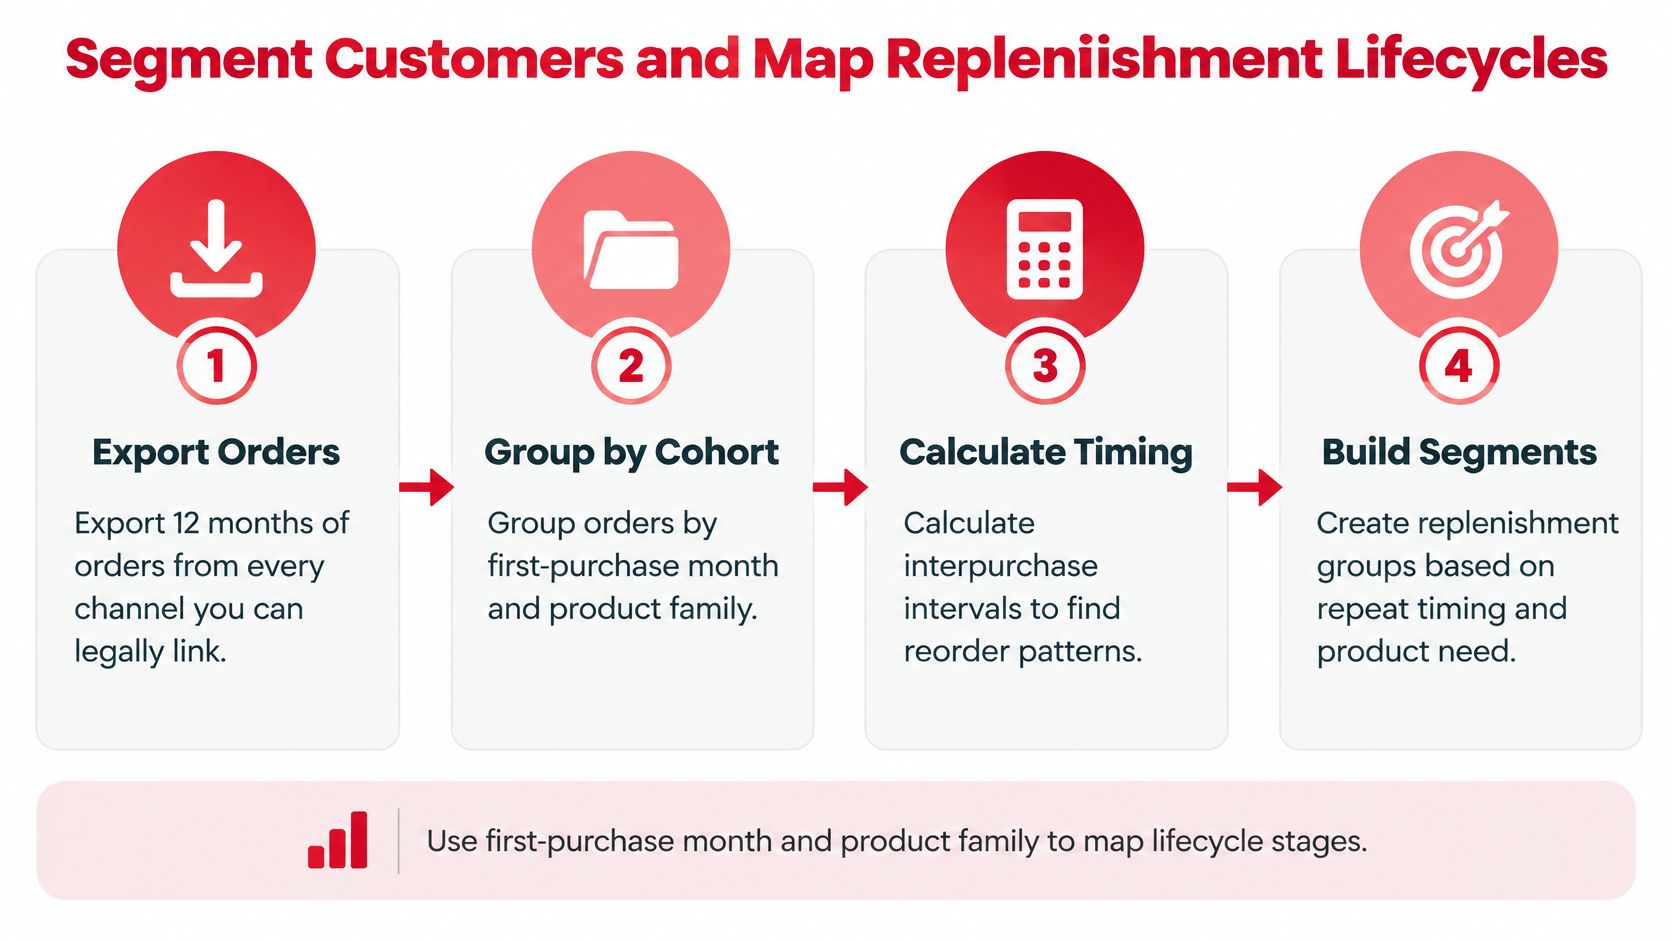
These timings are test settings, not category benchmarks. A household buying several bags of coffee needs a different clock from a customer buying a single bag, even when the SKU is identical.
McKinsey's personalization analysis reports that 78% of consumers say personalized communications make them more likely to repurchase. For an operator, useful personalization means recognizing product need and purchase timing before adding someone's name to a subject line.
Overlay contribution margin, acquisition channel, and recency-frequency-monetary value. A frequent customer ordering a low-margin single unit may deserve a pack-size recommendation, while a profitable replenishment buyer may need only a straightforward reminder.
Timing check: If reminder conversion stays flat across three replenishment cycles in your test, challenge the window before rewriting the copy.
Check whether customers are consuming more slowly, buying elsewhere, or ordering larger packs. Don't assume the message failed when the underlying consumption estimate was wrong.
Channel and on-site tactics by cohort, with the metric to watch
| Channel | Best cohort | Tactic | Watch metric |
|---|---|---|---|
| First-time buyers | Onboarding series with usage tips and a reorder reminder | Second-order rate within 60 days | |
| Lapsing repeat buyers | Replenishment reminder five days before the reorder window | Click-to-order rate and unsubscribe rate | |
| SMS | Opted-in high-margin replenishment buyers | One reminder per cycle with a direct reorder link | Opt-out rate and incremental orders versus holdout |
| On-site account page | Returning visitors | Reorder module showing last basket and one-click repeat | Repeat conversion rate and average order value |
| Post-purchase | First-time buyers after delivery | Delivery confirmation with setup or usage guidance | Refund rate and support contact rate |
| Paid retargeting | Lapsed buyers | Suppress recent buyers; exclude from retention credit | Incremental orders versus holdout |
The timing and measurement windows above are starting configurations to test. Sequence the technology behind them deliberately: rules-based lifecycle automation first, SKU-level reorder models second, machine-learning recommendations last.
Email should carry product education, onboarding, and replenishment because customers can revisit instructions without needing immediate action. Use delivery and order events to stop irrelevant messages. A customer who reordered this morning shouldn't receive an afternoon reminder to buy again.
Before diagnosing weak content, check whether messages reach the inbox. MailAdept's email deliverability guide is a useful reference for separating delivery problems from engagement problems. Keep operational messages distinguishable from promotions so customers can recognize shipping or service information.
Use SMS selectively. I would start with a cap of one reminder per replenishment cycle for explicitly opted-in buyers whose expected contribution supports the channel cost. Don't duplicate an email merely because the SMS integration makes it easy.
For implementation ideas specific to consumer brands, use these CPG email marketing strategies to translate lifecycle stages into messages with a clear purpose.
Put the reorder module on the account page and in the post-checkout area before installing broad recommendation widgets. Returning visitors already know what they bought. Show the last basket, current price, availability, and an easy way to adjust quantity.
Build bundles from actual basket behavior and second-product attach rate, meaning how often customers add a particular product to their next purchase. Category adjacency isn't enough. Coffee filters might support a coffee bundle; an unrelated high-margin accessory might add friction.
Channel dashboards will claim overlapping revenue. Use the holdout design below to decide whether the channel added demand, rather than rewarding whichever platform claimed the last interaction.
Price marketplace repeat orders before increasing demand. Customers can return more often while your business earns less per shipment.
Walmart Fulfillment Services' fee guidance lists no signup or monthly subscription fee and, effective April 2025, standard fulfillment charges of $3.45 up to 1 lb., $4.95 at 2 lb., and $5.45 at 3 lb. The same schedule lists $5.75 plus $0.40 per pound above 4 lb. for items weighing 4–20 lb., with storage at $0.75 per cubic foot monthly from January through September.
Using that schedule in a hypothetical example, a $24 order with $8 landed cost for a qualifying 1-lb. item leaves $12.55 after fulfillment, before referral fees, storage, advertising, and returns. A slow SKU occupying 10 cubic feet incurs $7.50 monthly storage. Allocated across 15 monthly units, that's $0.50 each; across three units, it's $2.50.
Amazon's selling-fee guidance describes referral fees based on the sale price, excluding taxes calculated through Amazon's tax services, plus separate FBA fulfillment fees that vary by category, size, and weight. Amazon's storage guidance bases monthly charges on daily average inventory volume and adds long-term storage charges when applicable.
Use weeks of cover, the time inventory should last at expected sales velocity, alongside incoming purchase orders. A hypothetical SKU with four weeks of cover may not support a reminder campaign if replacement stock arrives later.
Connect campaign planning to a practical replenishment strategy. Judge marketplace repeat orders after referral, fulfillment, storage, and returns, not by sales growth alone.
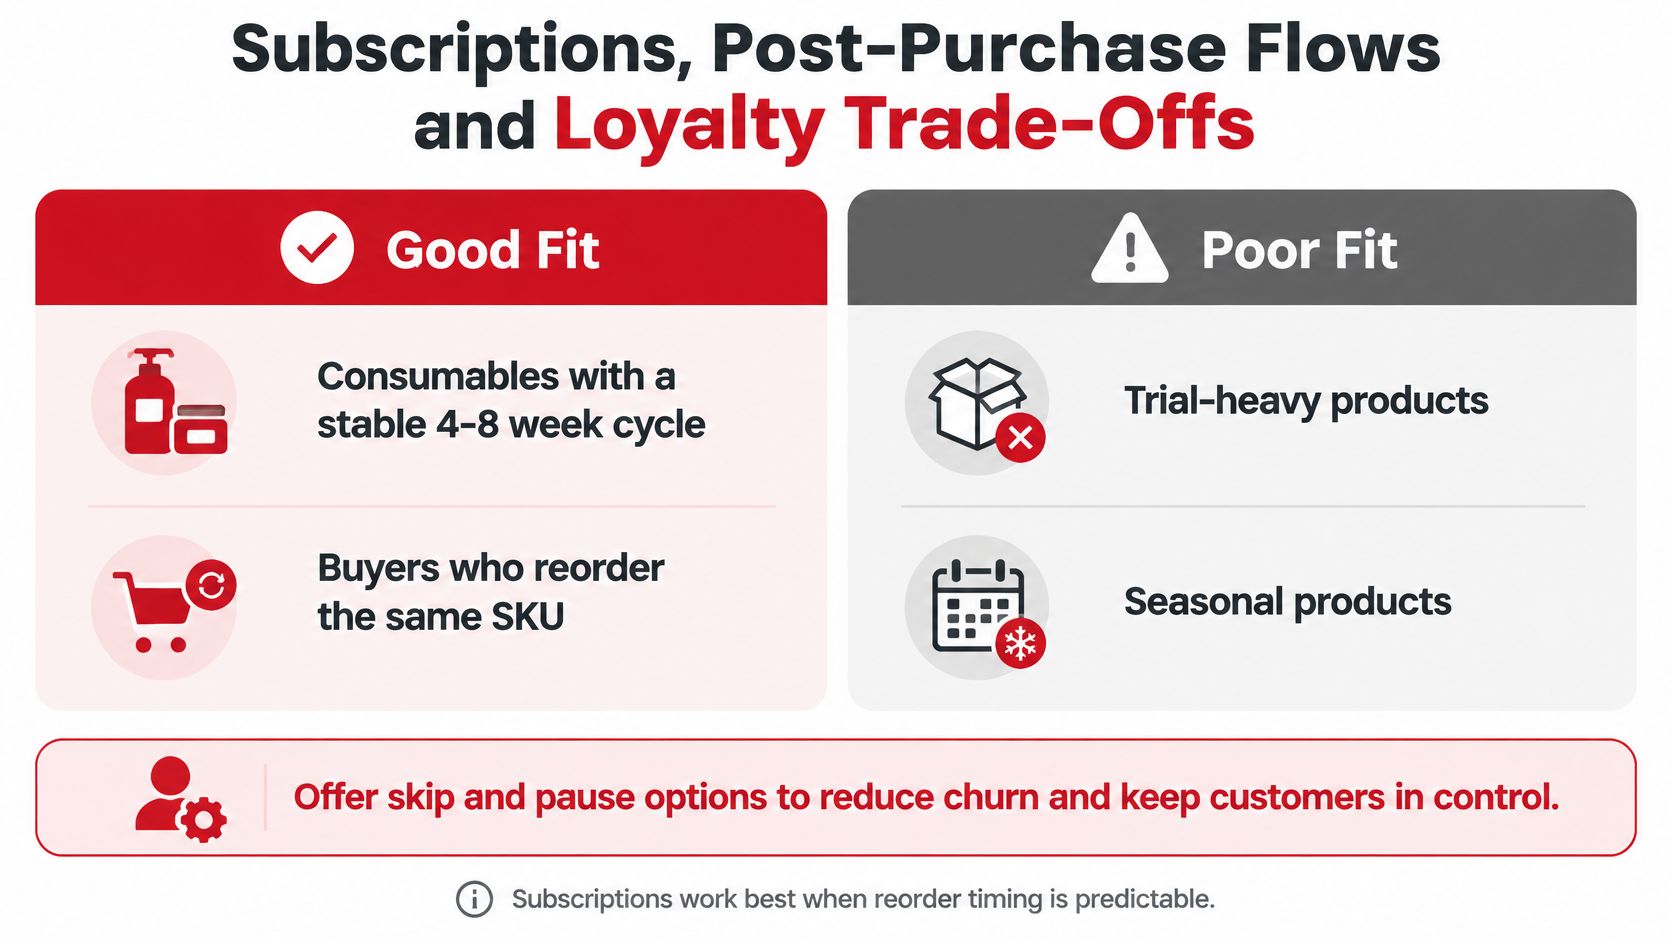
Subscriptions fit predictable consumption and buyers who repeatedly choose the same SKU. As a working example, a stable 4–8 week cycle is easier to support than trial-heavy demand or a seasonal purchase occasion.
Use product fit, not recurring-revenue ambition, to make the initial decision.
Consider a hypothetical $100 product with $65 cost. A 10% subscriber discount reduces gross contribution from $35 to $25, approximately 29% less per shipment, before additional variable expenses.
That discount needs to create enough incremental purchases or operating savings to compensate. Automatic enrollment revenue doesn't answer that question.
Offer skip, pause, and cancel controls with clear billing dates. Monitor skips as a timing signal: customers repeatedly postponing shipments may like the product but dislike the cadence. Presidio's subscription growth guide for DTC brands offers a useful implementation reference once the economics and customer controls are settled.
Use this video as a supplementary discussion resource while evaluating the model.
Rivo's loyalty statistics roundup cites a 2025 loyalty index in which “true loyalty” fell from 34% to 29%. That's a reason to question automatic rewards expansion, not proof that every loyalty program fails.
Points can subsidize purchases customers already intended to make. Members can also learn to delay purchases until the next offer, while frequent messages create fatigue.
A lower repeat rate can be healthier when you stop buying low-margin orders with permanent discounts.
Start with service and product usefulness:
Compare loyalty members with matched nonmembers, recognizing that enthusiastic buyers may self-select into membership. Review complaint and unsubscribe rates before expanding rewards.
Watch for discount dependence, excessive skipping, first-renewal churn, and billing disputes. For marketplace buyers, keep cohort attribution separate unless identity matching is permitted and reliable. Don't turn anonymous repeat-order reporting into an invented customer relationship.
Collect only information you need, explain its use, and give customers meaningful communication choices.
Retention dashboard views and what each one answers
| Dashboard view | Question it answers | Cut by | Review cadence |
|---|---|---|---|
| Cohort retention curve | How fast does each acquisition month decay? | Acquisition month and channel | Monthly |
| Repeat rate by product family | Which products earn second orders? | First product purchased | Monthly |
| Holdout incrementality | Did the flow add orders, or only take credit for them? | Treatment versus control | At test end |
| Contribution per customer | Is retained revenue profitable after fees and returns? | Cohort and channel | Monthly |
| LTV:CAC and payback | When does acquisition pay back? | Channel and acquisition month | Monthly, with cash review |
| Unsubscribe and complaint rate | Is messaging wearing out the list? | Segment and send frequency | Weekly |
Start with acquisition-month curves, comparing customers at the same age. If March cohorts hold steady while July cohorts deteriorate, investigate acquisition mix, product changes, delivery performance, and promotions before blaming a blended seasonal average.
Next, inspect the first product purchased. A trial pack may generate many first orders but weak continuation; a full-size replenishment SKU may produce fewer acquisitions and better downstream economics.
The Smile ecommerce loyalty report describes aggregate improvements in loyalty-related customer measures. Aggregate gains don't establish that your particular flow caused an improvement.
A hypothetical cohort can show a flat retention curve while the holdout reveals no incremental benefit. Customers receiving a coupon may reorder at the same rate as untreated customers, leaving the treated group with less contribution. The campaign dashboard looks productive because buyers clicked the email, but the business paid for behavior that would have happened anyway.
As a starting test design, randomly withhold 5–10% of eligible customers for four to eight weeks, extending the duration or control allocation when order volume is insufficient. Those are planning parameters, not guarantees of statistical adequacy. Cover enough of the reorder cycle to avoid mistaking an earlier purchase for an additional purchase.
Calculate:
Incremental contribution per eligible customer = treatment contribution per customer minus control contribution per customer.
Deduct discounts, fees, fulfillment, returns, rewards, and campaign costs consistently. Keep the allocation random and avoid overlapping offers that contaminate the comparison.
Use a documented customer retention rate calculation so finance and marketing use the same population and observation window.
Expect measured incremental lift to be smaller than attributed lift. That's not a failed measurement system. It's the distinction that keeps you from scaling an expensive illusion.
Build in the order RedDog uses for growth planning: Foundation → Optimization → Amplification. Each phase should earn the next investment through cleaner measurement and stronger economics.
The roadmap keeps advanced targeting behind dependable operations.
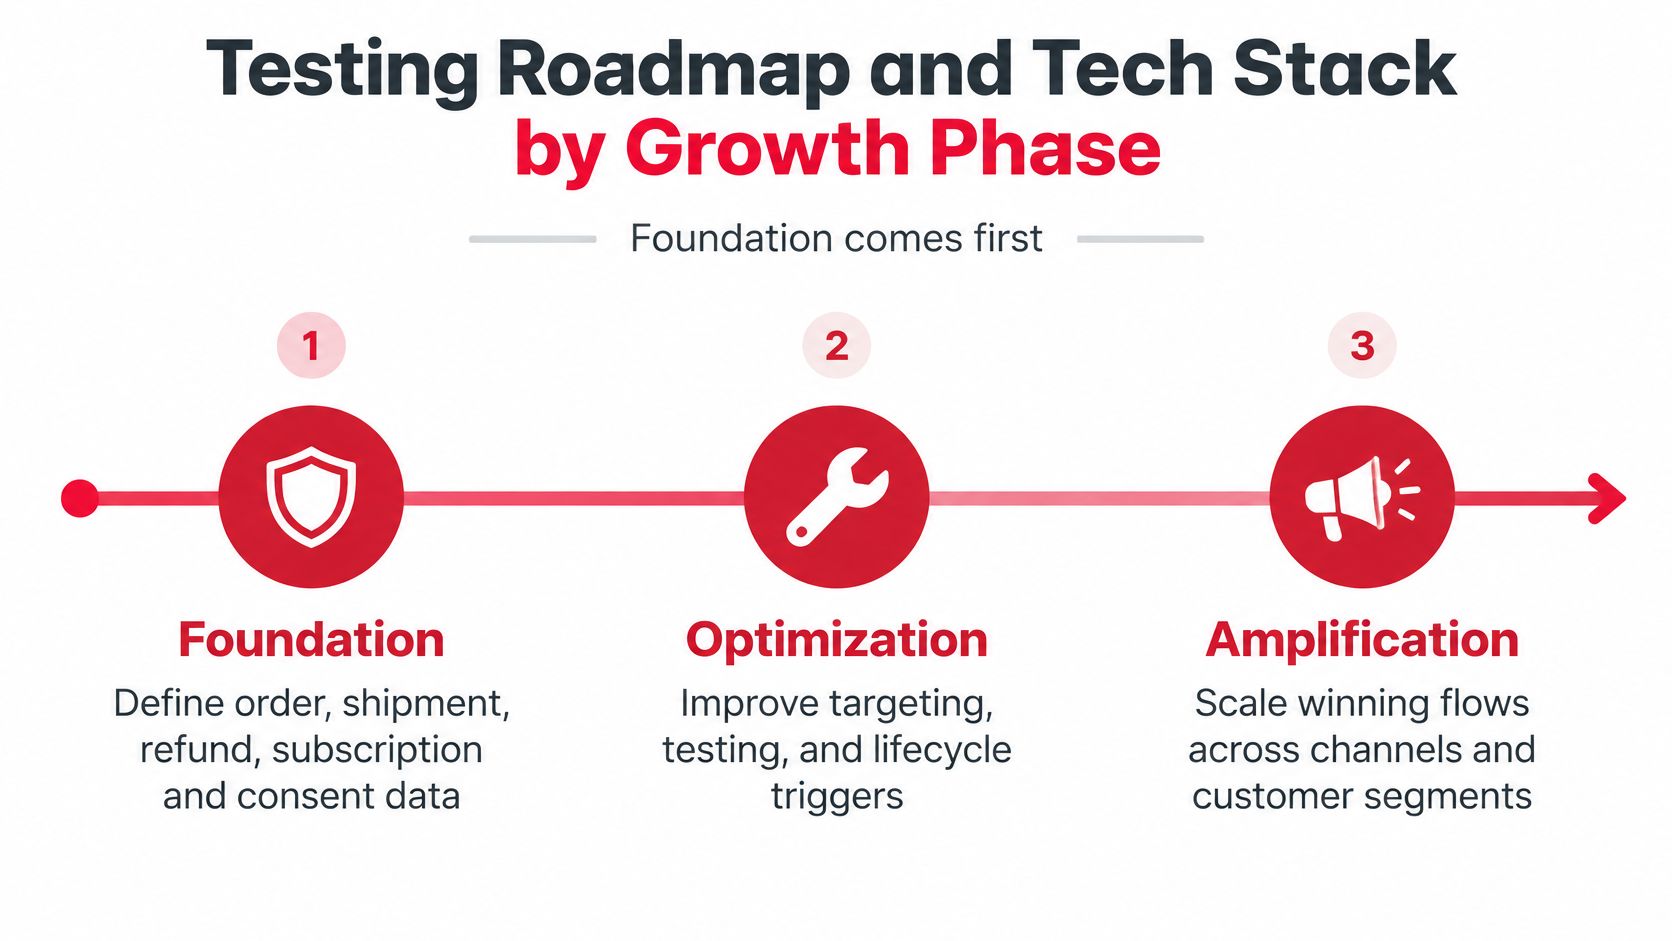
Foundation means trustworthy events and functioning lifecycle flows. Define order, shipment, refund, subscription, and consent events. Build a unified customer key across DTC, email, SMS, loyalty, and permitted marketplace records, without assuming every marketplace buyer can be identified.
Launch welcome, post-purchase, and replenishment flows only after checking cancellation suppression, consent changes, and order-status updates. The milestone is a customer record finance and marketing can reconcile, not merely an integration marked active.
Optimization means choosing better settings through controlled tests. A sample test backlog could compare reminder timing at three, five, or seven days before the window; replenishment incentives of none, 5%, or 10%; subscription against one-time offers; and service benefits against points.
Change one meaningful variable at a time when volume is limited. Use the measurement dashboard's holdout rules rather than creating a different attribution standard for each tool.
Amplification means scaling validated economics. Add SKU-level reorder models, bundles selected by observed attach rate, recent-buyer suppression in paid media, and sample win-back sequences at 30, 60, and 90 days where the product cycle supports them.
McKinsey's retail personalization analysis estimates that scaled personalization can lift total grocery-company sales by 1–2%. That's a useful counterweight to ambitious presentations: meaningful operational gains needn't look spectacular as a percentage of total sales.
The stack needs functional layers, not unnecessary software:
Audit duplicate profiles, stale preferences, and anonymous-to-known matching before buying machine-learning recommendations. A complex model trained on unreliable events produces polished-looking mistakes.
Run a 15-minute weekly test review to stop, scale, or extend experiments. Add a monthly cohort review with finance and quarterly re-segmentation. Assign an owner to each decision so underperforming flows don't remain active just because nobody removed them.
Starting playbooks by brand profile
These are hypothetical starting configurations, not performance benchmarks.
| Brand profile | Priority cohort | Lead tactic | Primary KPI |
|---|---|---|---|
| DTC coffee brand, 24-day cycle | Subscribers on the 24-day replenishment cycle | Subscription with skip option; 10% offer tested against no discount | Contribution per subscriber at month 6 |
| Pet food brand, DTC plus Amazon | Repeat buyers by bag-size cycle | Reorder reminders by bag size; marketplace repeat orders handled on-platform | Contribution after referral and FBA fees per repeat order |
| Snack brand, retail plus DTC | Retail buyers who can be identified | Sampling and recipe content that drives a DTC account | Share of retail buyers identified within 90 days |
| Skincare DTC brand, 45-day routine | Post-purchase education cohort | Routine guide, day-30 check-in, then 45-day replenishment prompt | Second order within 60 days |
Choose using repeat cycle and identifiable revenue, not whichever tactic is easiest to install. An advanced lifecycle program can't target customers you don't recognize or fix a product that customers don't need again.
For the coffee scenario, test whether subscription convenience earns continuation without a discount. Keep contribution per subscriber as the decision metric, and include customers who skip or cancel rather than reporting only active subscribers.
For pet food, bag size is a starting point, not a complete consumption model. Household usage can differ materially. Let DTC buyers adjust their timing, and handle Amazon repeat demand through permitted on-platform tools rather than assuming access to a transferable customer list.
The snack brand has an identity problem before it has an automation problem. Give retail shoppers a useful reason to identify themselves, such as preparation ideas or relevant sampling access. Measure identification only where retail buyer counts are observable; otherwise label the metric as identified participants, not a population-wide conversion rate.
For skincare, check product use and routine adherence before pushing replenishment. A customer with unopened product needs help using it, not another bottle and a discount code.
Begin with Foundation and release incentives beyond a controlled pilot only when the holdout shows positive incremental contribution. Don't scale a program because enrollment, clicks, or repeat rate improved while retained-order margin declined.
Decision rule: Fund the next retention tactic only when it creates additional contribution and fits your inventory and cash constraints.
A narrow, measurable playbook is more useful than a broad program with overlapping claims. Choose the cohort, name the economic constraint, and assign one owner to the first test.
Reddog Consulting Group helps CPG founders and operators connect retention planning with contribution margin, marketplace performance, and inventory decisions. Book a free 30-minute strategy call for a working session on your cohort economics, repeat-order costs, and the first retention test worth funding.
Leave a comment: