Published: March 2020 | Last Updated:January 2026
© Copyright 2026, Reddog Consulting Group.

To calculate your customer retention rate, you only need three numbers: how many customers you had at the start of a period, how many you had at the end, and the number of new customers you gained along the way.
The formula is straightforward: [ (Ending Customers - New Customers) / Starting Customers ] x 100.
While the calculation is simple, the percentage it reveals is incredibly powerful. It tells you exactly how effective your brand is at keeping the customers you worked so hard to win, providing a clear measure of brand health and loyalty.
Vanity metrics like website traffic or social media likes are interesting, but they don't directly translate to revenue. For any omnichannel brand, customer retention isn't just another number—it's the engine that drives sustainable, profitable growth.
Focusing only on acquiring new customers is like trying to fill a leaky bucket. You can pour marketing dollars into the top, but you'll never make progress if your existing customers are leaving. Mastering how to calculate customer retention rate is how you plug those leaks and build a solid foundation for long-term success.

This metric is the first step in RedDog Group’s core growth philosophy: Foundation → Optimization → Amplification. You can't optimize what you don't measure. Knowing your retention rate gives you the foundational data needed to build effective strategies that integrate your online and offline channels, from Shopify and Amazon to your brick-and-mortar stores.
The concept of retention isn’t new. It traces back to the 1990s with the first CRM pioneers who began digitizing loyalty tracking. Today, that has evolved into the sophisticated, integrated dashboards we rely on to understand customer behavior across every touchpoint.
For a modern brand aiming to get its products on the shelves at Walmart or Target, this metric is a critical indicator of brand health. Imagine a brand starts April with 500 customers. They acquire 50 new ones and end the month with 520. Their monthly retention rate is a solid 94%. If they maintain that, they’re on track for a healthy annual rate of over 70%.
This isn’t just theory. It’s a tangible measure of business health that proves why keeping a customer costs up to 700% less than acquiring a new one.
At its core, a high retention rate means you’ve delivered on your brand promise. It's measurable proof that your products, customer service, and integrated brand experience are strong enough to earn repeat business.
Calculating your retention rate isn't just a routine check-up; it's about turning a passive data point into an active growth strategy. A strong retention rate directly boosts your bottom line in several powerful ways:
Just as retention is a key growth lever, it's crucial to understand the financial impact of all your efforts. For instance, knowing how to measure social media ROI gives you a complete picture of how investments are paying off.
By mastering these metrics, you build a resilient customer base that fuels genuine brand growth. Our guide on what is omnichannel loyalty offers deeper insights into building this crucial customer engagement.
If you want to understand the health of your brand, you have to look beyond surface-level sales data. The real story lies in a metric that reveals the strength of your customer relationships: the Customer Retention Rate (CRR). Nailing this calculation is the foundational first step toward building measurable, sustainable growth.
The formula itself is refreshingly simple. It cuts through the noise to deliver one clear, powerful percentage that speaks volumes about your brand's ability to earn loyalty.
Before plugging in numbers, let’s clarify what each part of the equation means. Getting these three variables right is the key to an accurate and actionable calculation.
The logic is straightforward: you're taking your customer count at the end of the period, removing all the new customers you just acquired, and then calculating what percentage of your original customer base is still with you.
The formula for Customer Retention Rate is: CRR = [ (E - N) / S ] x 100
This simple equation tells you exactly what percentage of customers chose to stick around. A higher number is a clear indicator of a healthy business with a strong connection to its audience.
To make it even clearer, here’s a quick reference for each component of the formula.
| Variable | What It Means | Example Data Source |
|---|---|---|
| S (Starting Customers) | The number of existing customers at the start of your period. | Your CRM or eCommerce platform's customer list on Day 1. |
| E (Ending Customers) | The total number of customers at the end of your period. | Your CRM or eCommerce platform's customer list on the last day. |
| N (New Customers) | All the first-time buyers you acquired during the period. | Your sales report filtered for "first-time customers." |
Think of this table as your cheat sheet. The key is to pull your numbers from a consistent, reliable source—like your central CRM or integrated sales platform—to ensure your calculations are always accurate across all channels.
Alright, enough theory. Let's see how this works in a real-world scenario. For brands growing on competitive platforms like Amazon, Walmart, and Shopify, calculating retention is a game-changer that helps achieve that coveted 25%+ year-over-year growth.
After all, acquiring a new customer can cost 5 to 25 times more than keeping an existing one. That fact alone makes this formula one of the most important tools for any brand aiming to hit its revenue goals. A brand that starts a period with 100 customers, adds 20 new ones, and ends with 110 has a retention rate of 90%. That’s the kind of compounding success that builds lasting brand value.
Let's walk through a couple of common examples.
Imagine you run an omnichannel apparel brand and want to calculate your retention for Q1 (January 1st to March 31st).
Let's plug that into the formula:
CRR = [ (5,800 - 1,000) / 5,000 ] x 100
CRR = [ 4,800 / 5,000 ] x 100
CRR = 0.96 x 100 = 96%
A 96% quarterly retention rate is fantastic. It means the overwhelming majority of your customer base from the start of the year stuck with you, demonstrating strong brand loyalty. If you want to dig deeper, this guide on how to calculate customer retention rate for your Shopify store offers more platform-specific tips.
Now, let's look at an Amazon FBA seller who specializes in home goods and wants to check their retention for July.
Here’s how the math shakes out:
CRR = [ (910 - 150) / 850 ] x 100
CRR = [ 760 / 850 ] x 100
CRR = 0.894 x 100 = 89.4%
This monthly snapshot shows they held onto nearly 90% of their existing customers. This is a solid result, especially during a high-traffic event like Prime Day that attracts many new, deal-seeking shoppers who may not become repeat buyers.
The biggest takeaway? The best formula is useless if your data is messy. Always double-check that your customer data is clean and integrated across all sales channels to get a true picture of your business's health.
The core Customer Retention Rate formula gives you a powerful, high-level snapshot of your brand’s health. It tells you if you're keeping customers. But to drive real growth, you need to understand why. This is where cohort analysis comes in—the Optimization phase of our growth model.
A single retention number lumps everyone together: the loyal fan who bought from your first product drop, the bargain hunter from a Black Friday sale, and the new customer from a recent TikTok campaign. Each of these groups behaves differently. Cohort analysis allows you to separate them and track their behavior over time to uncover deeper insights.
Think of a customer cohort as a specific group of customers who share a common trait within a defined period. The most common approach is grouping them by acquisition date—for example, everyone who made their first purchase in January.
By segmenting customers, you can answer much more strategic questions. Instead of just knowing your overall retention is 85%, you can uncover insights like:
This level of detail transforms retention from a passive metric into an active diagnostic tool. You can finally pinpoint which strategies are bringing in high-value, long-term customers and which are just attracting fleeting buyers.
This diagram breaks down the basic formula that underpins all retention calculations, including the ones you'll use for each cohort.
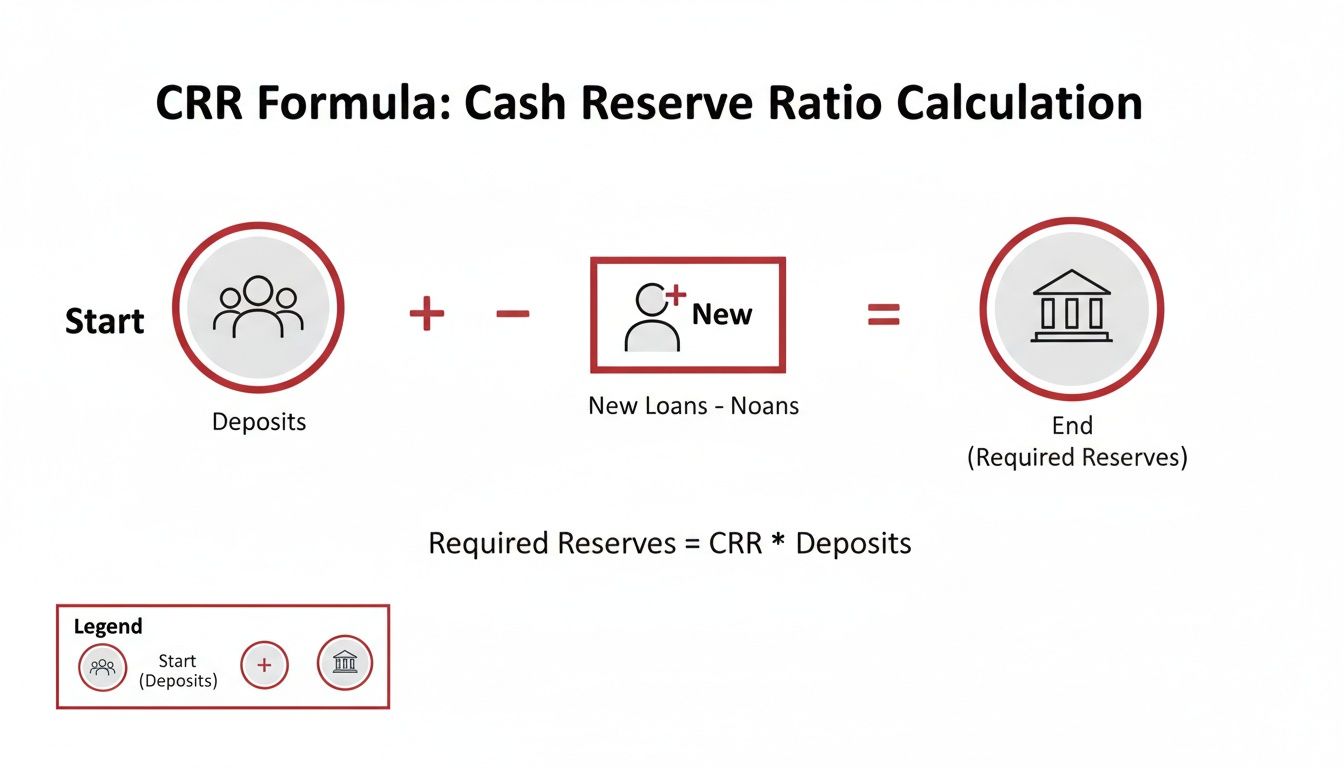
The visualization clearly shows how you isolate your starting customer base by removing new acquisitions from your final count. This is the core logic you'll apply to each individual cohort you analyze.
You don’t need fancy software to get started. A simple spreadsheet is all it takes to build your first cohort analysis table and start spotting powerful patterns. The goal is to see what percentage of each cohort comes back to make another purchase in the months after they first joined.
Let’s imagine a DTC snack brand wants to analyze its performance from Q1.
Here’s the data you’ll need:
Your finished table might look something like this, showing the percentage of the original cohort that returned to buy again in each following month.
| Acquisition Month | Cohort Size | Month 1 | Month 2 | Month 3 |
|---|---|---|---|---|
| January 2024 | 500 | 25% | 18% | 15% |
| February 2024 | 650 | 35% | 28% | 22% |
| March 2024 | 600 | 28% | 21% | 17% |
By looking at this table, you can immediately spot a powerful insight. The February cohort is outperforming the others significantly. Their retention is stronger across the board.
The immediate next step is to ask why. What was different in February? Perhaps you ran a highly targeted omnichannel campaign that attracted a more aligned audience, or maybe you launched a new product that really resonated with first-time buyers.
This is the real power of cohort analysis. It doesn't just give you a number; it gives you a clear direction for your investigation. By connecting these retention patterns to your marketing, product, and operational activities, you can make data-driven decisions that systematically improve customer loyalty. Understanding these connections is central to what we explore in our guide on the role of omnichannel analytics.
This cycle of analysis and refinement is the heart of true optimization. It’s about using precise data to double down on what works and fix what doesn’t, ensuring your brand grows stronger and more profitable with every customer you acquire.
So you've crunched the numbers and have your customer retention rate. The next logical question is, is it any good? This is where many brands get stuck, comparing their performance to broad, often irrelevant averages.
The truth is, a "good" customer retention rate isn't a universal figure. It depends entirely on your industry, business model, and even your product's lifecycle.
Think about it: a subscription box service lives and dies by monthly loyalty, making a high churn rate an immediate red flag. In contrast, a seasonal apparel brand might only expect repeat purchases once or twice a year from their core customers. The retention standards for these two businesses are worlds apart.
Understanding this context is crucial. It stops you from chasing unrealistic benchmarks and helps you focus on what actually moves the needle for your business.
While your own historical data is the best measuring stick, industry benchmarks provide a solid starting point. They offer a sense of what’s typical and help you determine if you're in the right ballpark or if there's a significant opportunity for improvement.
Different sectors have vastly different retention patterns, driven by factors like purchase frequency, product cost, and whether they're a "need" or a "want."
Here's a look at some typical retention benchmarks. This table gives you a comparative view to help gauge your brand's performance against others in your space.
| Industry | Average Annual Retention Rate | Key Influencing Factors |
|---|---|---|
| Retail & eCommerce | 63% - 75% | Product quality, customer service, and integrated loyalty programs are major drivers. |
| SaaS / Software | 75% - 85% | High switching costs and deep integration into daily workflows lead to stickier customers. |
| CPG / Subscription | 70% - 80% | Convenience and recurring value are critical; churn often happens after initial promotions end. |
| Professional Services | 80% - 85%+ | Strong client relationships and proven results are the foundation of high retention. |
As you can see, the expected rates vary significantly. A CPG brand with a 72% annual retention rate might be crushing it, but a SaaS company with the same number could have a problem. These numbers provide the context you need to set your first goals.
Here's the most important takeaway: while industry benchmarks offer a quick gut check, your most important competitor is your past self.
A brand that improves its retention from 65% to 70% year-over-year is demonstrating real, sustainable growth. That steady, upward climb is far more valuable than hitting a generic industry average once. It's about building a durable business, not just a magic number.
Your primary goal should be to establish a baseline and then consistently move the needle upward. Incremental gains in retention compound over time, leading to significant increases in profitability and customer lifetime value.
This shifts the focus from external validation to internal optimization—and that’s the foundation of a healthy, growing business.
Knowing where you stand is just the first step. The real work is turning that knowledge into a concrete plan. Instead of just aiming for a bigger number, use the data to inform specific, measurable actions.
Here’s how to translate your benchmark awareness into a real growth strategy:
This is how you build a resilient customer base—by measuring, analyzing, and improving methodically. You stop chasing abstract numbers and start actively strengthening the relationship between your brand and the people who keep you in business.
Knowing your customer retention rate is the first step. Actually improving it is where real, sustainable growth happens. This is the "Amplification" phase of our growth framework—turning raw data into measurable results that directly impact your bottom line.
Once you have your retention baseline and understand which customer cohorts matter most, you can deploy targeted strategies to keep more of them coming back. The goal isn’t to launch a dozen initiatives at once but to pick a few high-impact tactics that strengthen the customer relationship across all channels.

These are not complex, resource-draining projects. They are practical, scalable methods designed to deliver tangible improvements in customer loyalty and, ultimately, your retention numbers.
The moments immediately after a customer clicks "buy" are your greatest opportunity to set the stage for a second purchase. Too many brands go silent here, only to reappear weeks later with a generic sales pitch. A strong post-purchase email sequence nurtures that relationship when their excitement is at its peak.
This is about more than just sending a shipping confirmation. A great sequence adds genuine value and reinforces their decision to choose you.
This type of sequence transforms a one-time buyer into an engaged customer, making them far more likely to return.
In an omnichannel world, the unboxing experience is often the first physical interaction a customer has with your brand. A generic brown box with a product inside is a massive missed opportunity. A memorable unboxing experience creates a powerful emotional connection that bridges the online and offline worlds.
It doesn't have to be expensive. Small, thoughtful touches can make a huge impact on how a customer perceives your brand.
An elevated unboxing experience turns a simple delivery into a shareable moment. It’s a physical manifestation of your brand's attention to detail and care for its customers, making them feel valued from the moment the package arrives.
Try incorporating a few of these elements:
These details create a "wow" factor that customers remember and often share on social media, giving you free, authentic marketing.
Loyalty programs work because they tap into basic human psychology—we like to feel rewarded for our commitment. A well-designed program gives customers a clear, compelling reason to choose your brand over a competitor for their next purchase, whether online or in-store.
The key is to keep it simple. A complicated points system can confuse and frustrate customers. A straightforward, easy-to-understand program is always more effective. For a deeper dive, you can learn more about how to increase customer lifetime value with 5 proven tactics in our related guide.
Here are a few ideas to get you started:
By systematically rolling out even one or two of these strategies, you can begin to see a measurable lift in your customer retention rate. It's all about consistently delivering value and showing customers you appreciate their business long after the initial sale is made.
Once you start tracking your customer retention rate, a few practical questions almost always come up. Getting these details right is key to trusting your data and ensuring your insights are genuinely useful for your growth strategy.
Here are some of the most common questions we hear from omnichannel brands, along with clear, practical answers.
For most eCommerce and DTC brands, calculating your retention rate monthly is the sweet spot. It's frequent enough to give you timely feedback on marketing campaigns or site changes without becoming a major administrative task. This rhythm helps you spot trends as they’re happening.
Of course, there are exceptions. If your business has a longer sales cycle—like high-end furniture or custom equipment—a quarterly calculation probably makes more sense. On the other hand, if you're a high-growth startup rapidly launching new products, a weekly pulse check can help you catch issues early.
The most important thing is consistency. Pick a frequency that fits your business model and stick to it. That's how you get clean, reliable trend data over time.
This is a great question that gets to the heart of defining an "active customer" for your brand. There's no single right answer, but you do need a clear, consistent rule.
A common and effective approach is to define an active customer as anyone who has purchased within the last 12 months.
Under this rule, if a customer who last bought from you two years ago returns and makes a purchase today, you would count them as a "new" or "re-activated" customer for this period. They wouldn't be part of your starting customer base for the retention calculation. Whatever rule you choose, just apply it the same way every time you run the numbers.
The key to accurate retention tracking isn't finding a perfect, universal definition of an 'active customer'—it's creating a clear definition for your business and applying it without fail. Consistency is what makes your data trustworthy.
Yes, and you absolutely should. This is where retention data transforms from a simple health metric into a powerful strategic tool. Breaking down retention by segments unlocks the deeper insights needed to guide your entire growth strategy.
For instance, you can calculate retention for:
They are two sides of the same coin, measuring customer loyalty from opposite angles.
They are inversely related. So, if your customer retention rate for the month is 85%, your churn rate is 15%.
While both numbers tell a similar story, framing your goal around "retention" often creates a more positive and proactive mindset for your team. It shifts the focus toward the goal of creating loyalty, not just preventing loss.
At RedDog Group, we know that calculating your numbers is just the beginning. Real growth comes from turning those insights into a powerful omnichannel strategy that drives measurable results. If you’re ready to move from data to action, we’re ready to help.
Leave a comment: