
Published: March 2020 | Last Updated:September 2026
© Copyright 2026, Reddog Consulting Group.

A CPG brand can have a campaign dashboard that looks healthy while the P&L gets worse. Bids are reduced, branded terms carry the account, ACOS falls, and the team reports an efficiency win. Meanwhile, discounts deepen, fulfillment costs rise, organic sales soften, and the contribution dollars left after advertising shrink.
That's why the ACOS vs TACOS question requires more than two formulas. ACOS helps manage paid-media efficiency. TACOS shows how advertising relates to the whole Amazon business, but it still doesn't tell you whether the revenue is profitable. The operating answer sits underneath both metrics, in contribution margin by SKU, channel, and fulfillment path.
The practical sequence is Foundation → Optimization → Amplification. First, establish accurate unit economics and retail readiness. Then improve campaigns, listings, pricing, and inventory flow. Only after that should you amplify spend across a portfolio. For broader context on reading commercial performance, sales insights for e-commerce can help teams think beyond isolated campaign results.
This guide puts the comparison into operating terms. You'll see how the denominators work, how to calculate break-even ACOS, why TACOS can improve while profit declines, and how FBA, Walmart WFS, pricing, and portfolio mix change the decision.
A brand manager reviews the weekly Amazon report and sees a campaign ACOS below its previous level. The obvious response is to call the agency or media buyer and ask for more of the same. But the account's total revenue is flat, organic sales aren't compensating for paid demand, and the brand is relying on coupons to convert traffic. The campaign improved. The business didn't.
This situation appears often in CPG because advertising sits beside several moving parts. A fee change affects unit contribution. An inventory shortage pushes the team toward a higher-margin variant or forces a campaign pause. A price increase may protect dollars per unit but reduce conversion. ACOS records the relationship between ad spend and attributed revenue, not the full chain of economic consequences.
TACOS gives the operator a wider view by including total sales, including organic sales. That makes it useful for judging whether paid media is supporting broader demand rather than buying transactions. It still isn't a profit metric, though. A business can produce a better revenue ratio while earning less per unit.
Instead of asking, “What's our target ACOS?” start with three questions:
The answers determine whether an efficient campaign deserves more budget or less. They also determine whether a rising TACOS is acceptable during a launch, or whether it signals a listing, price, or margin problem.
The sections below use a comparison table, SKU-level break-even math, and channel economics to build a decision system. The goal isn't to force ACOS or TACOS into a single “correct” KPI. The goal is to connect both metrics to contribution dollars before changing bids, budgets, or assortment.
The denominator changes the meaning of the report. ACOS uses ad-attributed revenue. TACOS uses total revenue. That distinction is simple, but it affects whether you're evaluating a campaign or the business around the campaign.
ACOS formula
ACOS = Ad Spend ÷ Ad Revenue × 100
If you spend $1,000 and Amazon attributes $2,500 in ad revenue, ACOS is 40%, calculated as $1,000 divided by $2,500. The metric answers a narrow question: how much advertising spend did you use to generate the sales assigned to those ads? That makes ACOS useful for bid adjustments, search-term decisions, placement analysis, and campaign-level budget control. The definition and formula are also outlined in this Amazon advertising metrics guide.
TACOS formula
TACOS = Ad Spend ÷ Total Revenue × 100
If the same $1,000 in spend sits alongside $5,000 in total revenue, TACOS is 20%, calculated as $1,000 divided by $5,000. Total revenue includes ad-attributed and organic sales, so TACOS puts paid media in the context of the entire Amazon sales base.
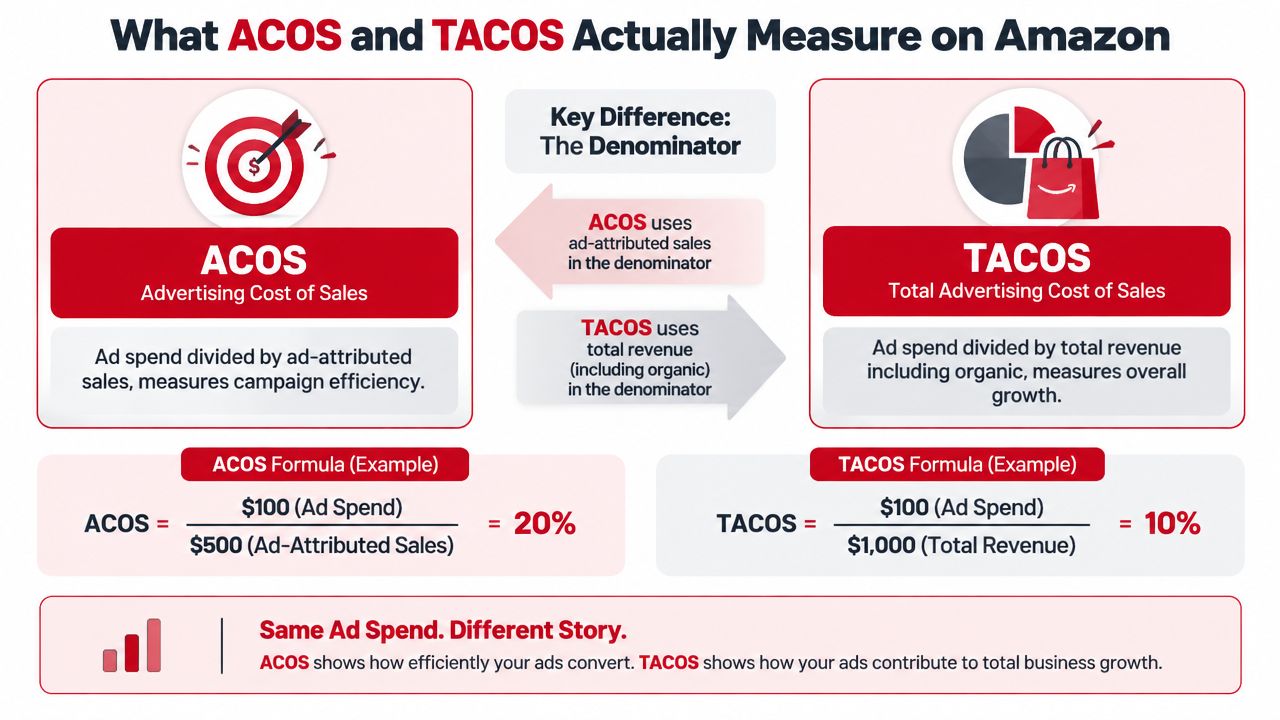
ACOS is the faster campaign-control metric. It can tell you that a keyword, product target, or placement is consuming too much paid revenue. TACOS is the broader business-health metric because it shows the share of total revenue allocated to advertising.
Neither one equals profit. Both divide spend by revenue, while contribution margin also has to absorb product cost, marketplace fees, fulfillment, discounts, and other variable costs. Teams looking to connect paid activity with broader commercial outcomes can also review revenue attribution on Amazon, particularly when paid media influences sales that aren't directly captured in campaign attribution.
The useful comparison isn't “which metric is better?” It's “which question are you trying to answer?” ACOS is appropriate when you're deciding whether a campaign deserves its current bid or budget. TACOS is appropriate when you're judging how much of the total business is being supported by advertising.
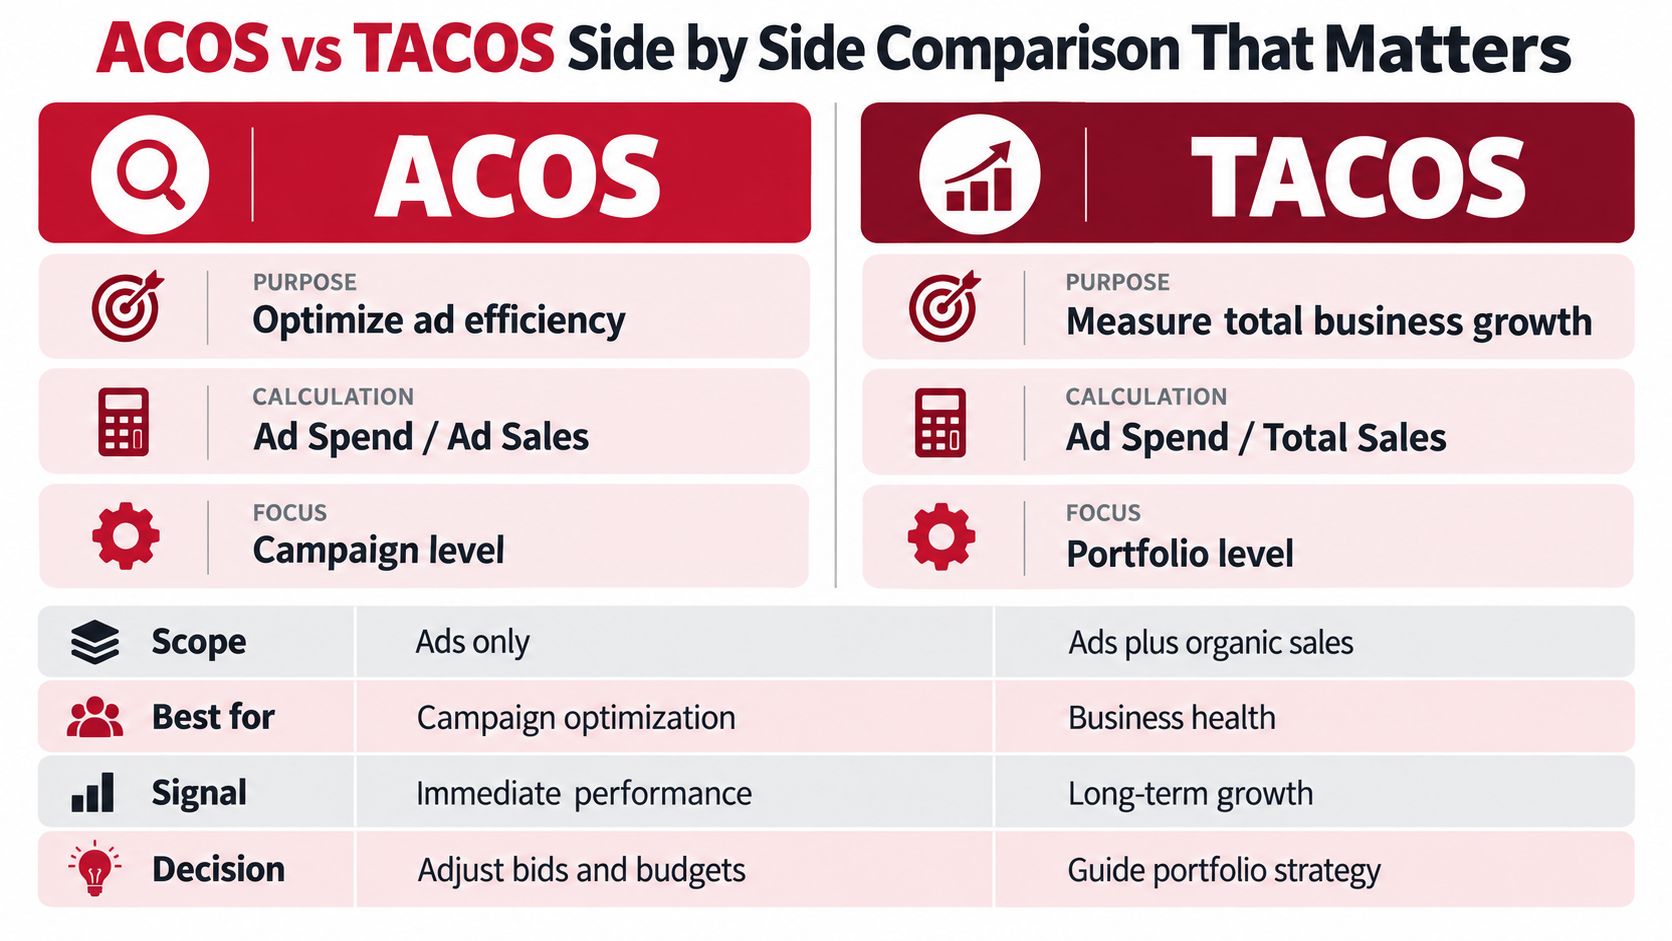
| Criteria | ACOS | TACOS |
|---|---|---|
| Primary purpose | Optimize paid advertising efficiency | Evaluate advertising against total business revenue |
| Calculation | Ad spend divided by ad-attributed sales | Ad spend divided by total sales, including organic |
| Scope | Campaign, keyword, placement, or ad group | SKU, category, channel, or portfolio |
| Best operating use | Bid, budget, and targeting decisions | Demand, organic contribution, and business planning |
| What it reveals | Whether paid transactions are efficient | Whether advertising spend is proportionate to total sales |
| What it hides | Organic sales and full-business effects | Contribution margin, discount cost, and per-unit profit |
A lower ACOS can result from better conversion, stronger targeting, or cutting expensive traffic. Those outcomes aren't equivalent. If the cuts reduce visibility and organic sales, the campaign report may improve while the brand loses momentum.
TACOS helps identify that wider effect. When total revenue grows around stable advertising spend, TACOS can decline because organic sales make up more of the business. That's a positive signal, but it still needs a margin check. Revenue can rise through a coupon, a lower price, or a less favorable fulfillment mix.
The key differentiator: TACOS checks whether ads are creating broader demand or merely buying transactions. It doesn't prove that the demand is profitable.
Use ACOS to isolate the paid-media lever. Use TACOS to evaluate whether the paid-media system is supporting the SKU and portfolio. An operator might accept a higher ACOS for a discovery campaign while watching TACOS, inventory, conversion, and contribution dollars at the business level.
ROAS is another way to express paid efficiency, but teams still need to connect it to margin and objectives. For practitioners evaluating ways to optimize ROAS with AdStellar AI, the same discipline applies. A stronger revenue-to-spend ratio matters only when the underlying sales produce acceptable contribution.
Break-even ACOS starts with the money left after variable product and marketplace costs, before advertising. That amount is the SKU's pre-ad contribution margin. If advertising consumes all of it, the unit reaches break-even. If advertising consumes more, the unit loses contribution before overhead.
The basic relationship is:
Break-even ACOS = Contribution Margin Before Advertising
A SKU with a 28% contribution margin before ads has a theoretical 28% break-even ACOS. The calculation and interpretation are detailed in this break-even ACOS and TACOS contribution margin guide. Advertising above that level starts to erase the contribution generated by the unit.
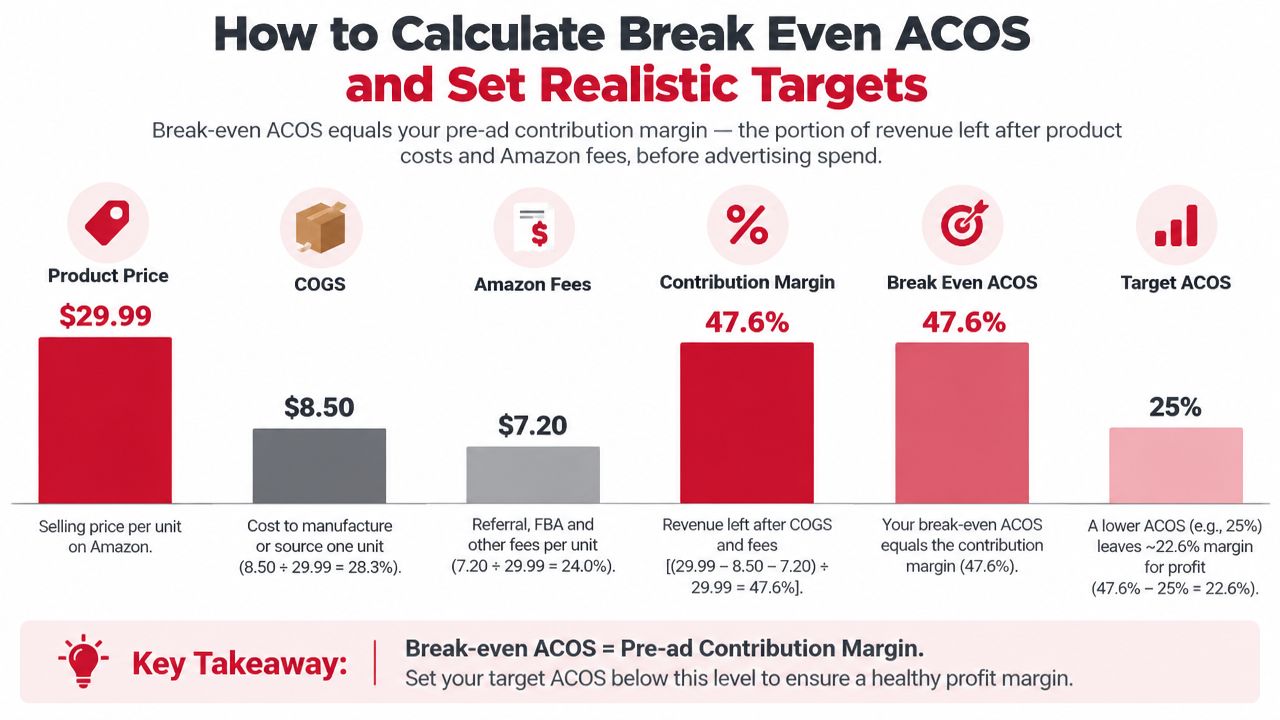
Take a product priced at $30, with $8 in manufacturing cost and $10 in Amazon fees. The unit leaves $12 in pre-ad profit, calculated as $30 minus $8 minus $10. That represents a 40% break-even ACOS, because $12 divided by $30 equals 40%. Performance below 40% remains profitable before other costs, while performance above 40% loses money on that contribution basis. The same example is documented in this Amazon PPC KPI reference.
That number is a ceiling, not a target. If the operator wants to retain contribution after advertising, the target ACOS must sit below break-even by the intended profit buffer. The correct gap depends on the role of the SKU, the launch plan, and the rest of the cost structure.
Account averages create bad decisions because they blend different economics. A hero SKU may support aggressive discovery spend, while a long-tail variant has thin contribution and should carry a tighter ceiling. Build the model at the ASIN level and include:
Pricing changes the denominator and the dollars left after fees. Coupons reduce realized revenue without necessarily reducing fulfillment or product costs. Fee increases can turn a previously acceptable target into a loss, even when campaign performance hasn't changed.
A margin-aware ACOS target is therefore a controlled operating range. It shouldn't be copied across a category, inherited from an agency dashboard, or selected because it looks efficient. Use the guide to calculating ACOS as a reference point, then validate every target against current SKU economics.
ACOS and TACOS become more useful when the operator stops treating Amazon as a self-contained media account. Fulfillment, channel fees, inventory velocity, and assortment mix determine how much revenue can safely be purchased.
A comparison of fulfillment models illustrates the issue. A 2026 comparison lists Amazon FBA standard-size fulfillment at roughly $3.06 to $6.92+ per unit, while Walmart WFS is listed at about $3.45 to $7.50+ per unit. Those ranges come from the Walmart seller calculator comparison. The operational lesson is more important than the ranking: model contribution by channel and unit, rather than assuming higher top-line volume creates better economics.
A portfolio TACOS can look acceptable because a mature hero product generates substantial organic revenue. That result can mask a newer flavor, pack size, or channel-exclusive variant that requires heavy paid support and leaves little contribution after fees.
The reverse also happens. A new SKU can carry a high TACOS while creating useful demand, improving assortment visibility, or moving inventory that would otherwise age. Whether that investment makes sense depends on its strategic role and the contribution created across the portfolio, not on the ratio alone.
Inventory shortages create a direct trade-off. If a campaign accelerates velocity beyond replenishment capacity, the brand may lose ranking, disappoint customers, or shift demand toward a lower-margin substitute. If inventory is overstocked, a controlled advertising push may be rational even when the short-term ACOS is less attractive, provided the clearance economics are explicit.
RedDog's Optimization stage matters. Before Amplification, the team needs aligned pricing, merchandising, listing quality, fulfillment, and inventory planning. A broader discussion of the cost structure sits in this Amazon advertising cost analysis. The central rule is straightforward: TACOS measures revenue share, not total profit.
The right primary metric changes with the SKU's job. A launch, a mature profit driver, and a defensive branded campaign shouldn't share one target because they sit in the same ad console.
A new flavor or pack size usually needs discovery. Early campaigns may accept weaker ACOS while the team tests search terms, audience response, creative, and retail readiness. TACOS becomes the broader guardrail because it shows how much of the total SKU revenue depends on paid support.
That tolerance needs an end point. If conversion remains weak because the detail page, price, reviews, or offer is not competitive, increasing spend only buys more expensive traffic. Foundation work comes first, then Optimization, then Amplification.
A seasonal CPG item may justify a temporary investment to capture demand while inventory is available. The operator should set the decision around contribution dollars, stock coverage, and the value of the selling window. A lower ACOS achieved by suppressing spend may be the wrong outcome if it leaves inventory stranded after the season.
TACOS helps show whether the push is expanding total sales, while ACOS identifies the campaigns wasting budget. Review both alongside realized price and contribution per unit.
A mature SKU with stable organic demand usually deserves tighter ACOS control. If marketplace fees rise, recalculate break-even before changing bids. The right response might include pricing, packaging, fulfillment, or assortment changes, not just a demand to reduce advertising.
After a fee increase, use contribution margin as the primary limit, ACOS as the campaign control, and TACOS as the business trend. A campaign can meet its old ACOS target and still fail the new economics.
Brands often underestimate how easily a lower TACOS can hide profit erosion. A discount can lift total revenue while reducing realized price. A fee increase can reduce contribution without changing campaign attribution. A weak listing can make additional spend look like a media problem when the constraint is retail readiness.
TACOS is broader than ACOS, but it still measures advertising as a share of revenue. It doesn't include contribution margin, so profit can worsen while TACOS improves. Use the metrics in sequence:
Start by rebuilding the model with current costs. Then separate launch, harvest, and defense objectives instead of forcing one target across the account. Finally, review ACOS, TACOS, contribution per unit, and inventory velocity together before moving budget.
If you're a CPG founder or operator, Reddog Consulting Group offers marketplace performance and growth planning grounded in contribution margin, pricing, operations, and advertising economics. Book a free 30-minute strategy call as a working session to review your SKU margins, ACOS and TACOS targets, and the next practical move for profitable scale.
Leave a comment: