
Published: March 2020 | Last Updated:November 2026
© Copyright 2026, Reddog Consulting Group.

Most advice about CPG marketing starts with more channels, more content, and more advertising. That's the wrong starting point if every additional order leaves less cash to replenish inventory. A growing brand needs demand, but it also needs to know what remains after the retailer, marketplace, fulfillment provider, and ad platform take their share.
CPG marketing is the coordinated work of creating demand for frequently purchased packaged goods and converting it profitably in stores, on marketplaces, and direct to consumer. Those goods include food, beverages, household products, personal care items, and pet products.
It isn't a media plan or social calendar run separately from price, pack size, and stock. The working toolkit includes brand positioning, packaging, price architecture, promotion depth, distribution, search visibility, retail media, and a channel P&L that shows what each sale kept.
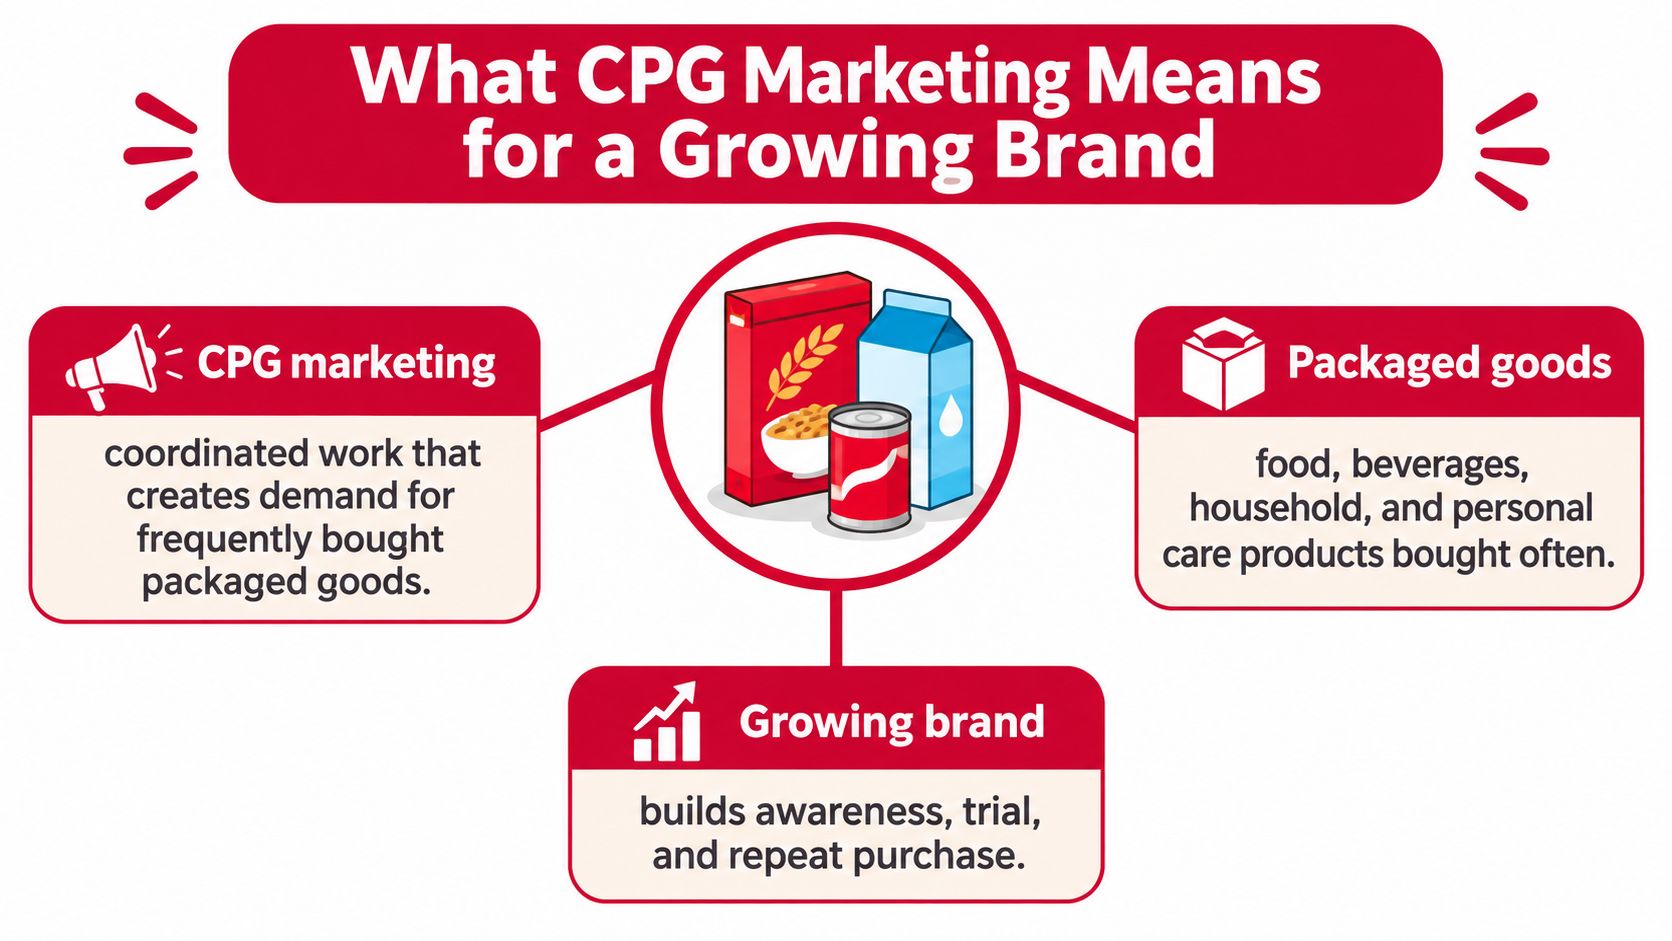
McKinsey's analysis of digital CPG commerce explains why brands must connect online research with purchase execution rather than manage digital and physical retail as separate businesses. A shopper can discover a product online, inspect its ingredients on a marketplace, and buy it during a grocery trip.
For a growing brand, that means marketing decisions need commercial inputs. A compelling product page can't compensate for unavailable inventory, and a promotion isn't successful just because it moves units.
The operating standard: An impression that dies in fees, trade spend, or a stockout is not growth.
The practical answer to “what is CPG marketing?” therefore includes both persuasion and execution. Give shoppers a reason to choose the product, make it easy to buy, and preserve enough contribution to supply the next purchase. Shared definitions help marketing, finance, and operations make that decision using the same arithmetic.
Marketplace reports, retailer scorecards, and a founder's P&L can describe the same sale differently. Use these terms as decision rules, not dashboard decorations.
| Term | Plain meaning | Decision it drives |
|---|---|---|
| Trade spend | Price concessions paid to retailers, including allowances, slotting, coupons, and co-op media | Net price the brand actually keeps |
| Contribution margin | Net revenue minus COGS, channel fees, fulfillment, returns, promotions, and ads | Whether a SKU or channel earns the next dollar |
| ACOS | Ad spend divided by ad-attributed sales | Bid ceiling compared against break-even ACOS |
| ROAS | Ad-attributed sales divided by ad spend, the inverse of ACOS | Platform reporting only, never a profit measure on its own |
| Velocity | Units sold per store or listing per week | Whether a shelf or search position earns its place |
| Weeks of cover | Units on hand divided by weekly sell rate | Whether ads should run or pause |
| Sell-through | Units sold by the retailer to shoppers | Whether sell-in shipments reflect real demand |
| Incrementality | Sales that wouldn't have happened without the spend | Whether the ad credit is deserved |
ACOS and ROAS are inverted versions of the same calculation. Neither includes the full cost of earning the sale. Break-even ACOS needs a separate calculation using contribution before advertising.
Sell-in and sell-through also describe different events. Shipping cases into a distributor's warehouse records a commercial transaction, but it doesn't establish shopper demand. Read velocity alongside weeks of cover so a fast-selling listing doesn't become an avoidable replenishment failure.
Content quality isn't just attractive photography. Rip Van's explanation of why transparent ingredient lists matter is a useful resource when reviewing how clearly a food brand explains its product.
Clear ingredient, pack-size, and usage information helps shoppers evaluate the offer. Measure that work through purchasing behavior and returns, rather than treating content completion as the outcome.
Start with the transaction, not the advertising dashboard. A marketplace selling price isn't the amount available to pay for product, promotion, and growth.
Amazon's referral-fee guidance defines the fee base as total sales price, including item price, delivery charges, and gift wrapping, with rates determined by category; a $24.99 item in a 15% category incurs about $3.75 in referral fees alone. That deduction comes before fulfillment, storage, advertising, discounts, returns, or COGS.
A product that appears to generate healthy gross profit can therefore leave very little spendable contribution. Don't treat marketplace deductions as a distant overhead allocation. Assign them to the SKU and transaction that created them.
Small prices create a different problem: fixed fulfillment consumes a larger share of revenue. Walmart's WFS fee card lists $3.45 for products weighing a pound or less, $4.95 at two pounds, and an additional $1 for products priced below $10. Under that schedule, a $9.99 item weighing a pound or less faces at least $4.45, approximately 44.5% of price, while the base charge represents approximately 13.8% of a $24.99 item.
Those are fulfillment comparisons, not complete channel margins. Referral fees and the rest of the cost stack still need payment.
Amazon's 2026 U.S. fee notice states an average FBA increase of $0.08 per unit, generally effective January 15, 2026, and an average $0.25 increase for small standard-size products priced from $10 to $50.
Consider the illustrative SKU associated with that fee change: a $19.99 price, $6.00 COGS, approximately $3.00 referral fee, a prior $3.50 fulfillment fee, and $2.00 in other variable costs. It leaves approximately $5.49 before ads, or 27.5% break-even ACOS; adding the fulfillment increase leaves approximately $5.24, lowering break-even ACOS to 26.2%.
The fee notice establishes the cost change; the SKU figures are a worked illustration, not a universal fee quote. A campaign that previously cleared its ceiling can fail without any deterioration in click or conversion performance.
| Case | Charge that bites | Result | What is still unpaid |
|---|---|---|---|
| $24.99 Amazon item in a 15% category | Referral on total sales price | About $3.75 | FBA, storage, ads, returns, COGS |
| $9.99 WFS item, 1 lb or less | Base fee plus under-$10 surcharge | At least $4.45, about 44.5% of price | Walmart referral, COGS, storage, ads, returns |
| $24.99 WFS item, 1 lb or less | Same $3.45 base fulfillment fee | About 13.8% of price | Referral, COGS, storage, ads; pack size changes the share |
| $19.99 SKU before the 2026 fee move | Pre-ad contribution about $5.49 | Break-even ACOS about 27.5% | Ads; calculation includes $6 COGS, about $3 referral, $3.50 fulfillment, $2 other variable costs |
| $19.99 SKU after +$0.25 FBA | Pre-ad contribution about $5.24 | Break-even ACOS about 26.2% | Ads; the tighter ceiling can make a scaled campaign unprofitable |
Calculate channel contribution as selling price minus COGS, referral, fulfillment, storage, promotions, advertising, returns, and variable logistics. If you start with net revenue, don't subtract the same discount again.
Use a consistent contribution-margin calculation, and distinguish break-even from your required profit floor. Recalculate before increasing spend, not after discovering that last year's acceptable campaign is losing money.
The shopper's path runs through discovery, evaluation, conversion, and the next purchase. No channel owns that entire path, even when its dashboard claims the final transaction.
McKinsey's examination of the CPG e-commerce profitability dilemma makes the commercial issue clear: digital growth needs to work alongside distribution and channel economics. Moving revenue online isn't enough if the new fulfillment and acquisition costs consume the benefit.
The purchase journey needs a different operating response at each stage.
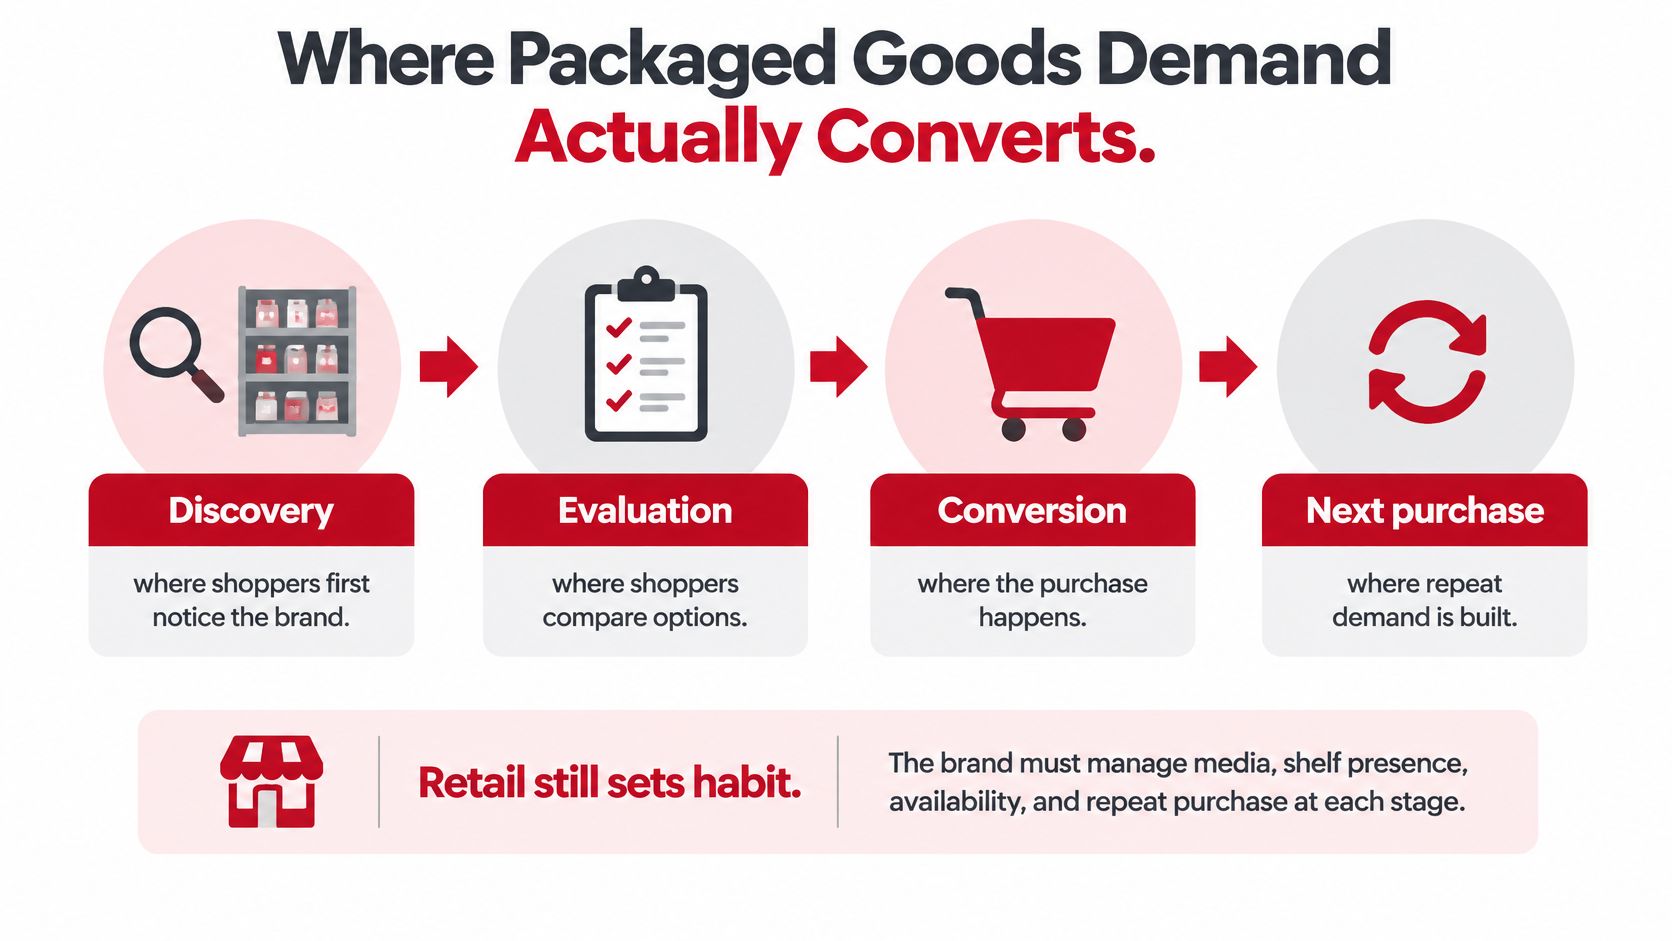
On Amazon, manage sponsored placements alongside organic search, product content, reviews, price, and availability. More awareness won't fix an unclear pack count or an unavailable offer. Compare the resulting advertising cost with the SKU's actual contribution ceiling.
On Walmart, evaluate the delivery promise and pack price together. A convenient offer can still be uneconomic if fulfillment absorbs too much of the transaction. Weekly velocity matters because a profitable unit sitting in storage isn't replenishing cash.
DTC and Shopify provide control over landing pages, offers, email, SMS, and the repeat-purchase path. That control doesn't guarantee superior economics: paid acquisition and shipping can consume the apparent advantage over wholesale.
Social can assist these channels without closing the order itself. Deloitte's 2025 Retail and Consumer Trends report found that 64% of Gen Z consumers used social media to research products and 35% used it to discover products in 2025. For planning creator-led discovery, Sup's resource on ecommerce influencer marketing provides context for a channel that shouldn't be judged solely by immediate checkout attribution.
For wholesale and physical retail, getting authorized is the beginning. Shelf placement, planogram execution, replenishment, and promotion depth determine whether shoppers buy the product.
U.S. consumers made an average of 5.2 grocery trips per month in 2025, up from 4.9 in 2024, according to FMI figures reported by FoodNavigator. Those recurring trips create opportunities for trial and replenishment, provided the product is on the shelf.
| Channel | Demand lever | Conversion lever | Health metric |
|---|---|---|---|
| Amazon | Sponsored products plus organic search | Content, reviews, price, in-stock | Contribution after fees versus break-even ACOS |
| Walmart | On-site search and the WFS delivery promise | Pack price versus fee share | Unit contribution and weekly velocity |
| DTC and Shopify | Paid social plus owned email and SMS | Offer, landing page, repeat path | Repeat rate and contribution after CAC and shipping |
| Wholesale and physical retail | Distribution, shelf, and retailer media | Promo depth and planogram | Sell-through and margin after trade spend |
Deloitte's retail outlook reported that omnichannel shoppers spent 1.5 times more per month than single-channel shoppers in 2025. That comparison supports planning across channels, not assuming that opening more accounts will cause higher spending.
Choose marketing distribution channels according to where your shopper buys and where your economics hold. Channel presence without a contribution floor is expansion without a financial test.
Don't buy awareness for a SKU whose contribution floor, claims, and replenishment are still guesses. Foundation → Optimization → Amplification is an operating order, not a set of campaigns to run simultaneously.
Reddog's process starts with Foundation, establishing the base for operations, sales, and marketing strategies. Optimization & Expansion enhances and scales existing operations; Amplification drives awareness, engagement, and conversions through targeted marketing.
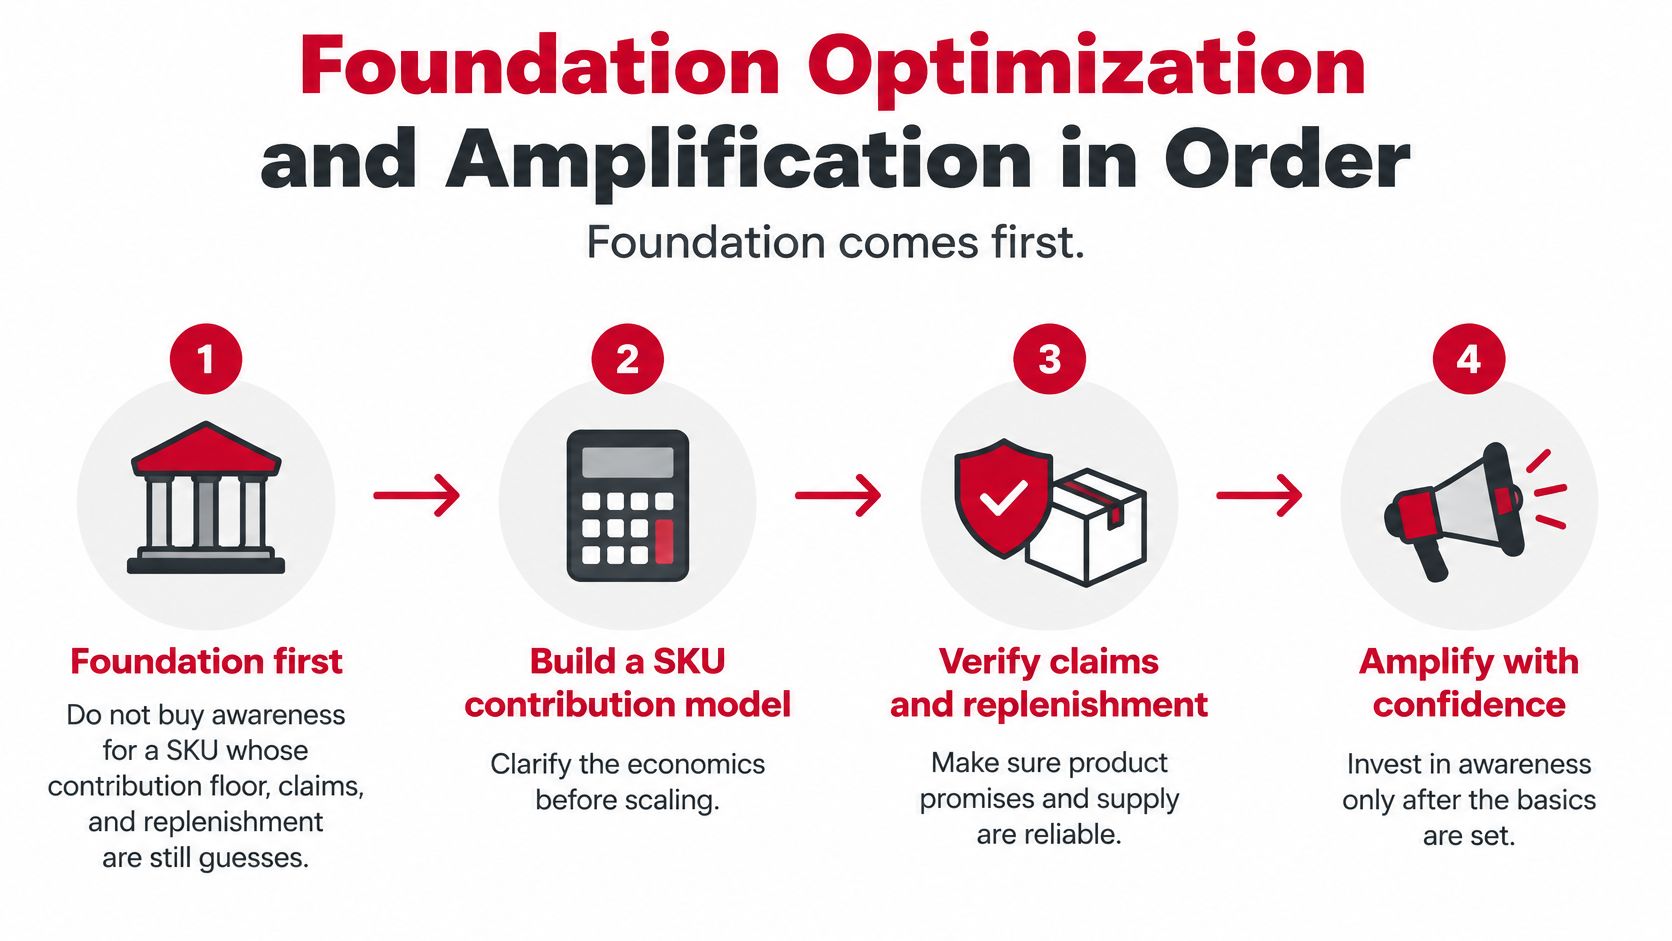
Build the SKU contribution model before approving traffic. Include the actual selling price, product cost, fee stack, variable logistics, and expected returns, then assign an owner to update it when inputs change.
The operational work belongs beside the model:
A launch is ready when those controls work, not merely when the creative is approved.
Test multipacks after single-unit demand and contribution are understood. Sharing a fulfillment event can improve order economics, but the larger carton also commits more product and cash before the shopper buys.
Set promotion guardrails before issuing coupons. Specify the lowest acceptable net price, required contribution, available inventory, and conditions that end the test.
McKinsey's precision revenue-growth-management analysis supports connecting shopper behavior, promotion response, and financial outcomes rather than judging promotions through revenue alone. Give each part of the funnel an accountable owner: consideration through qualified traffic, conversion through offer execution, and customer value through repeat purchasing and basket development.
Scale a working commercial system, not a temporary discount that makes the dashboard look efficient.
Increase investment only where incremental contribution supports it. Where feasible, use matched geographic tests, holdout audiences, or controlled promotion periods to distinguish additional demand from sales that moved between channels.
The lifecycle follows the same discipline. Launch emphasizes Foundation; growth emphasizes Optimization; broader scale earns Amplification. Adding doors should follow evidence that the existing assortment can sustain contribution and replenishment.
The common failure is amplifying a hero SKU before separating product demand from discount response. Keep the handoff explicit: Foundation before traffic, Optimization before broader pack and promotion experiments, and Amplification against current economics.
Treating omnichannel as a content problem leads brands to optimize messages while leaving inventory, pricing, and measurement disconnected. The harder job is coordinating media, merchandising, operations, and stock when no team has a complete view of the shopper.
That coordination requires a shared commercial plan, not just a shared campaign calendar.
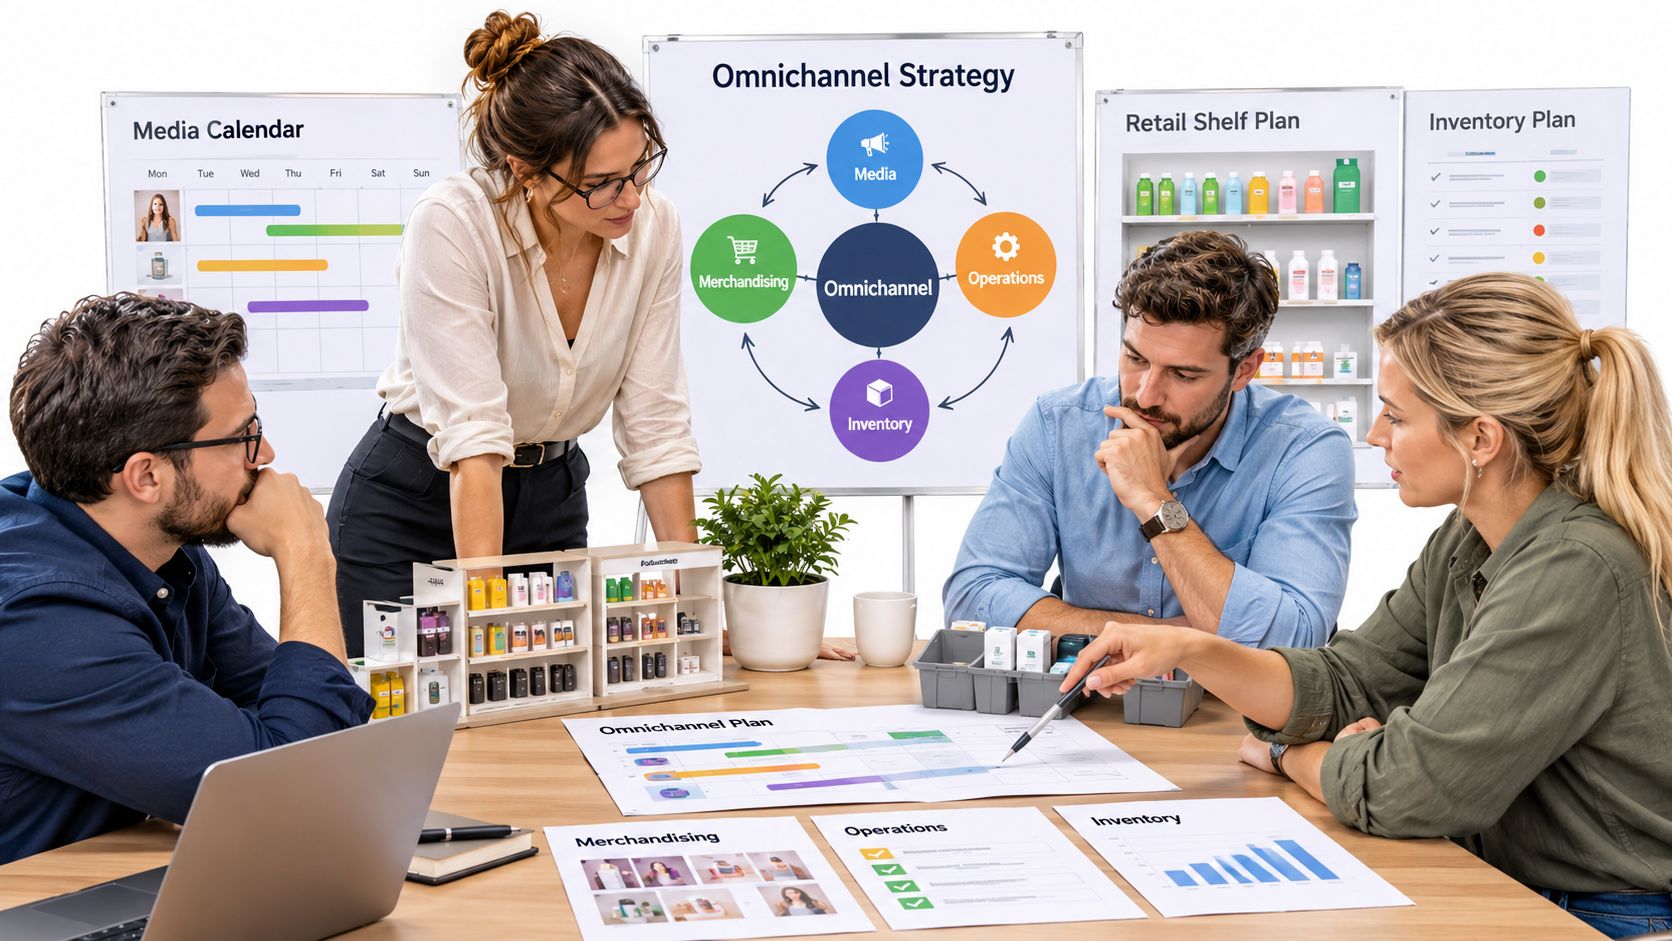
McKinsey's State of Consumer 2025 reports that 32% of consumers globally use social media for product research, up from 27% in 2023. A shopper can encounter a product there and later complete the purchase through marketplace search or a store.
If the brand gives the closing channel all the credit, it can overfund conversion advertising while cutting the packaging, discovery, reviews, and retail execution that supported the purchase. The marketplace may be capturing existing intent rather than creating additional demand.
A lower attributed ROAS can be the better commercial result when the spend produces stronger repeat purchasing, better realized prices, or healthier retailer velocity. That's a reason to test, not permission to excuse weak campaigns.
Multipacks can improve fulfillment economics while slowing inventory turns. A shopper willing to try a single unit may reject a larger commitment, leaving the brand with more cash tied to each unsold carton.
Pricing decisions also travel across accounts. Undercutting retail partners through DTC can create commercial friction or contract-related deductions, while matching every marketplace coupon can teach customers to postpone full-price purchases.
Use this operating discussion alongside the coordination plan.
The FTC's advertising and marketing guidance requires advertising claims to be truthful, non-deceptive, and evidence-based. Review objective claims across packaging, listings, sustainability language, and influencer content before they go live.
Keep the evidence tied to the product version and approved wording. If a listing is removed or a retailer rejects stock, the commercial consequence isn't just a copy revision. Inventory may remain unavailable for sale while storage and replenishment obligations continue.
Maintain a short cross-channel scorecard:
No platform should own the entire explanation of performance. Reconcile its claims with what shoppers bought, what operations supplied, and what finance retained.
Consider a hypothetical quarter for a shelf-stable beverage launched as an Amazon single. The figures below are scenario assumptions, not a fee quote or reported brand result.
In month one, assume a $14 selling price, $4.20 COGS, a 15% referral fee of $2.10, $3.50 fulfillment, and $0.80 variable prep and returns reserve. The calculation leaves $3.40 before advertising, giving approximately 24% break-even ACOS.
The operator launches at an 18% target ACOS and holds price when a competitor coupons. That target leaves a cushion, but it isn't a promise of business-level profit: fixed expenses still need funding from the remaining contribution.
A competitor's coupon is an input to review, not an instruction to abandon your price floor.
In month two, suppose a 20% coupon increases units by 40%, while the assumed dashboard credits sales before the discount and reports higher ROAS. The shopper pays $11.20, but the team celebrates attributed revenue instead of reconciling settlement proceeds.
Recompute the scenario using a referral deduction of $1.68, unchanged $4.20 COGS and $3.50 fulfillment, and a prep and returns reserve increased to $0.90. Pre-ad contribution is now just $0.92, giving approximately 8.2% break-even ACOS on net sales, before any separate coupon administration charge.
The discount is already reflected in net price, so it mustn't be deducted again. Even without double-counting it, the promotion has removed most of the advertising headroom.
Assume the unit lift also consumes two weeks of planned cover early. Replenishment arrives late, the SKU stocks out for nine days, and organic visibility weakens. The team has bought a temporary sales lift while interrupting availability for shoppers who might have paid full price.
In month three, the operator ends the blanket coupon and tests a four-count pack against only a limited portion of forecast demand. The pack shares a fulfillment event, but it also puts more product cost in each carton and may discourage trial.
The test needs its own dimensions, fulfillment quote, contribution model, and reorder forecast. Don't assume that combining units preserves the single-unit fee.
For a concrete example of how a replenishment offer can be presented, review Mouthology's invitation to simplify your routine with Mouthology refills. The relevant design question is whether the customer understands the next-order mechanism and can use it comfortably.
In this scenario, Amplification stays off until four weeks of observation show repeat or subscription uptake and out-of-stock days near zero. Revenue and ROAS described an attractive promotion; contribution and weeks of cover described a business that wasn't ready to scale.
The next channel can add revenue and still weaken the business. Before assigning inventory or advertising spend, confirm that each SKU clears its contribution-margin floor after fees, logistics, promotions, and trade costs.
The decision is whether Amazon, Walmart, DTC, or wholesale should receive the next unit of inventory and the next dollar of spend. Use revenue attribution to separate sales credit from the question of which investment merits more funding. A channel receiving credit for a sale does not automatically deserve more budget.
Prepare the details needed to test the proposed expansion:
Reddog Consulting Group offers omnichannel retailing and marketing, along with analytics and reporting to support retail decisions across platforms. Its three-stage process moves from Foundation to Optimization and Expansion, then Amplification. The sequence connects operating foundations and existing-channel improvements with targeted marketing, rather than treating more spend as the default path to growth.
Before scaling, compare the contribution expected from the proposed channel with the inventory and spending it will consume. Bring a hero SKU's economics and recent advertising and promotion costs to a conversation with Reddog Consulting Group through reddog.group. The review should make clear which assumptions need testing and whether the next investment can support profitable growth.
Leave a comment: