
Published: March 2020 | Last Updated:November 2026
© Copyright 2026, Reddog Consulting Group.

You open the marketplace dashboard Monday morning and sales look fine. Your hero SKU is growing, advertising return looks efficient, and gross margin sits where it always has. Then cash gets tight, a storage bill jumps, or a retailer deduction lands, and you can't explain where the profit went.
That's the gap brand profitability analysis closes. It doesn't ask whether you sold more. It asks which SKU, in which channel, at which price, kept money after every variable cost that sale created. If you can't answer that by SKU and channel, you're scaling on reports that were never built to make that decision.
Say a $24.99 SKU shows a 40% gross margin on its Amazon sales report, but leaves roughly 12% contribution after referral fees, FBA fulfillment, advertising, returns, and payment costs. Nothing is fraudulent in that report. It's incomplete. Gross margin stops at product cost, while the channel keeps charging you long after the click.
A useful profit waterfall forces every layer into the open, in order. Stop at contribution margin for channel decisions, because that's the line the channel controls. Overhead belongs below it, allocated carefully, not blended into a number you use to set ad bids.
| Line item | What belongs in it | Where the number comes from | Common error |
|---|---|---|---|
| Gross sales | Units times listed or invoiced price before deductions | Order reports and invoices | Treating marketplace sales as brand revenue |
| Deductions | Retailer allowances, trade terms and promotional funding | Retailer statements and settlement files | Booking them below contribution instead of above net revenue |
| Net revenue | Gross sales minus deductions | Calculated per channel | Mixing channels with different deduction timing |
| Referral or commission | Marketplace referral or commission fee on each sale | Settlement files | Using the listed rate and ignoring tiered or category fees |
| COGS | Landed product cost per unit | Purchase orders and costing sheets | Leaving out packaging and replenishment waste |
| Inbound freight and duty | Cost to bring units to the fulfillment point | Freight invoices and customs entries | Spreading it evenly across SKUs by volume |
| Fulfillment | Pick, pack, ship and marketplace fulfillment fees | Settlement files and 3PL invoices | Ignoring surcharges on low-price or heavy items |
| Advertising | Variable media spend attributed to the SKU | Ad consoles and tagged spend | Dividing total spend evenly across SKUs |
| Returns and chargebacks | Refund cost net of recovered inventory | Returns reports and chargeback logs | Booking returns in a different period from the sale |
| Payment fees | Card, marketplace or platform processing charges | Processor reports | Replacing actual fees with a flat percentage |
| Contribution margin | Net revenue minus all variable costs above | Calculated per SKU and channel | Confusing it with gross margin |
| Allocated overhead | Shared warehouse, service and software cost | Activity drivers | Allocating by revenue |
| Controllable operating profit | Contribution minus overhead the channel can change | Calculated | Including fixed costs the channel cannot influence |
Deductions sit above net revenue because you never earn that money. If a retailer funds a promotion from your invoice, booking it as a marketing expense below contribution flatters both revenue and margin.
Freight belongs in landed cost, assigned by weight, cube, or shipment, not spread evenly. A bulky, low-price SKU that rides free under an even split will look like a winner until you ship more of it.
Returns must hit the same period as the sale. Book them a month late and last month looks profitable while this month looks broken, and you'll chase a problem that is really timing.
Practical rule: Reconcile the model to the general ledger by channel and month before you trust any number in it. If it doesn't tie out, it's an opinion with formatting.
Build this once at transaction level and you'll stop relitigating the same margin argument every month. The workflow below follows the approach described in academic customer-profitability research on activity-based costs, which warns that reliable analysis needs accurate revenue and cost data, multi-period measurement, future downstream costs, and customer-specific cost drivers, and that retrospective analysis is often unreliable when that data wasn't captured at the time.
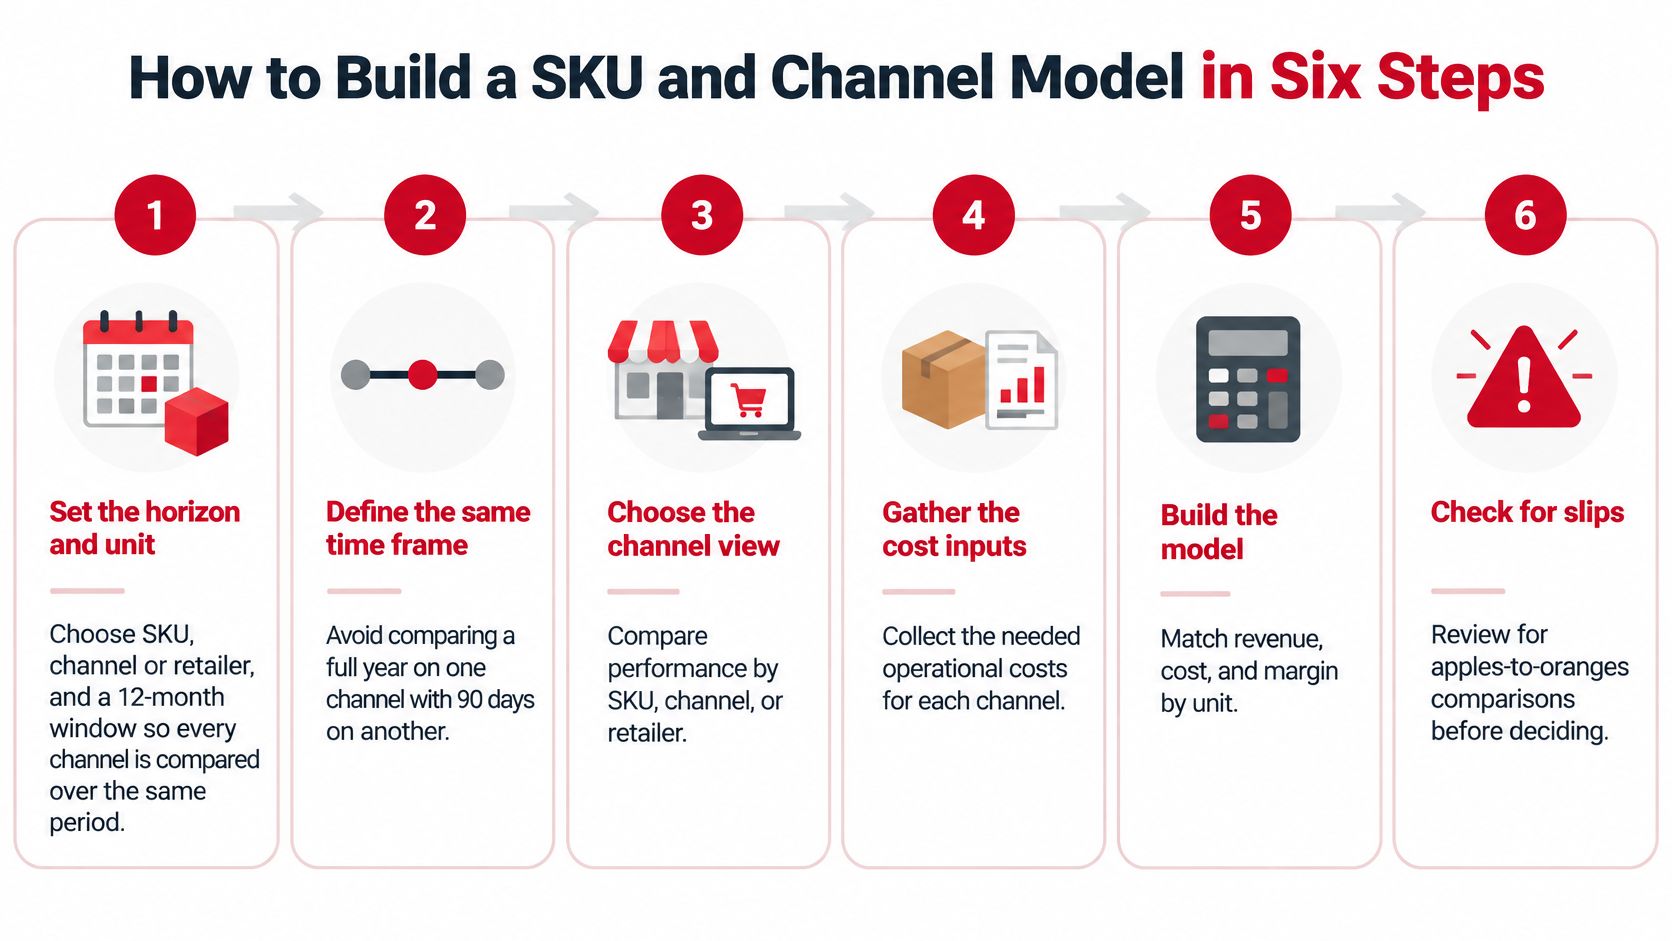
Your output is a waterfall from net sales to contribution to controllable operating profit, with separate scenarios for price, promotion, ad spend, fulfillment, and inventory velocity. If a decision involves repeat purchase or channel lifetime value, add retention, cross-sell, and future downstream costs explicitly. Don't bury them in a first-order margin number.
The same product earns four different margins in four channels. Not because demand changes that much, but because each channel charges you in a different place.
Start with Amazon, where price-band placement directly moves your fee. Under Amazon's 2026 U.S. FBA fee changes, standard-size products priced from $10 to $50 receive an average fulfillment-fee increase of $0.08 per unit, while small-standard products in that band rise by $0.25 per unit on average. Products priced below $10 receive a relative fulfillment-fee advantage of approximately $0.86 per unit versus standard-size products priced at $10 or more, according to the same documentation.
On a SKU with only $2.00 of pre-fulfillment contribution, that $0.25 increase removes 12.5% of contribution. A modest price increase that crosses the threshold can therefore make you less money at a higher price.
Walmart cuts the other way. Under Walmart's published marketplace pricing, items with shipping weight of 1 pound or less carry a $3.45 fulfillment fee, products priced below $10 incur an additional $1 fee, hazardous-material items add $0.50, and apparel adds $0.50. A sub-$10, one-pound hazmat item faces at least $4.95 before referral fees, advertising, product cost, freight, returns, or discounts, roughly 49.5% of a $9.99 price.
| Cost layer | Amazon FBA | Walmart WFS | DTC | Wholesale |
|---|---|---|---|---|
| Fulfillment | Standard $10 to $50 band, small-standard most exposed | Weight based, plus low-price and category surcharges | Your warehouse or 3PL pick, pack, and ship quote | Freight terms set in retailer or distributor agreement |
| Referral or commission | Category referral fee on sale price | Referral fee on sale price | Platform fee plus actual payment processing | Retailer deductions and trade terms in your agreement |
| Advertising | Sponsored ads, measured by ACoS | Sponsored ads, measured by ROAS | Paid social and search, measured by CAC | Trade promotion funding by retailer and mechanic |
| Storage | Monthly charge by product size | Charge by cubic foot and inventory age | Warehouse rent allocated by pallet or bin position | Case pack requirements and fill rate penalties |
| Main margin risk | Size or price-band threshold moves | Low-price surcharge and aged stock | CAC above first-order contribution | Deductions and forecast error |
DTC looks clean because there's no referral fee, but paid acquisition, payment fees, and parcel shipping do the same job. Wholesale looks clean because there's no ad console, but deductions, trade terms, chargebacks, and forecast error decide the result after the purchase order ships.
Fill each cell from your own settlement, processor, and retailer data. Mark any cell you can't source as an open item. An honest blank is safer than an estimate you'll later treat as fact.
Break-even ACoS equals contribution margin before advertising. If a SKU keeps 30 cents of each sales dollar before ads, any ACoS above 30% loses money on that sale.
The target for keeping a margin after ads is just as direct. Subtract the after-ad margin you want from the pre-ad margin you have.
| Contribution before advertising | Break-even ACoS | Target ACoS for 5% after-ad margin | What it means |
|---|---|---|---|
| 20% | 20% | 15% | Any ad spend above 20% of sales loses money |
| 30% | 30% | 25% | A 25% ACoS keeps the 5% after-ad margin |
| 40% | 40% | 35% | More room, but check incrementality before scaling |
This is why platform ROAS misleads operators who don't convert it. A 4.0 ROAS is a 25% ACoS. That looks efficient in a console screenshot, but it loses money every day on a SKU with 20% pre-ad margin. Before you raise bids, review what Amazon advertising actually costs by format and objective against the margin that SKU can support.
Break-even math assumes the ad caused the sale. Often it didn't. Branded search, retargeting, and marketplace placements near the buy box frequently claim buyers who were already coming. As Skai reports in its 2026 retail media measurement research, 75% of advertisers prioritize incrementality, while only 24% reported successfully measuring profit margins and 22% successfully measuring customer lifetime value.
Build a no-investment baseline forecast first. Count only the units above that baseline, convert them to incremental contribution margin, then subtract variable media, discount, fulfillment, and inventory costs. That matches the approach in Columbia's marketing-investment framework, which evaluates spend through incremental contribution, the expected return from the next dollar, and complexity cost, across acquire, retain, and grow value.
Pause or redesign any campaign whose incremental contribution profit does not cover its fully loaded variable cost. Cutting spend that harvests existing demand can raise profit without losing real growth.
Test brand and off-site awareness separately. They rarely produce clean last-click returns, but they can create new buyers whose repeat economics justify a lower initial return. Judge them with a control group or geo test, not with the same ACoS target you use for harvest campaigns.
Aged stock often leaks more cash than a weak gross margin. A thin margin at least moves. Dead inventory charges you rent, ties up cash, blocks space for sellers, and ends in a markdown anyway.
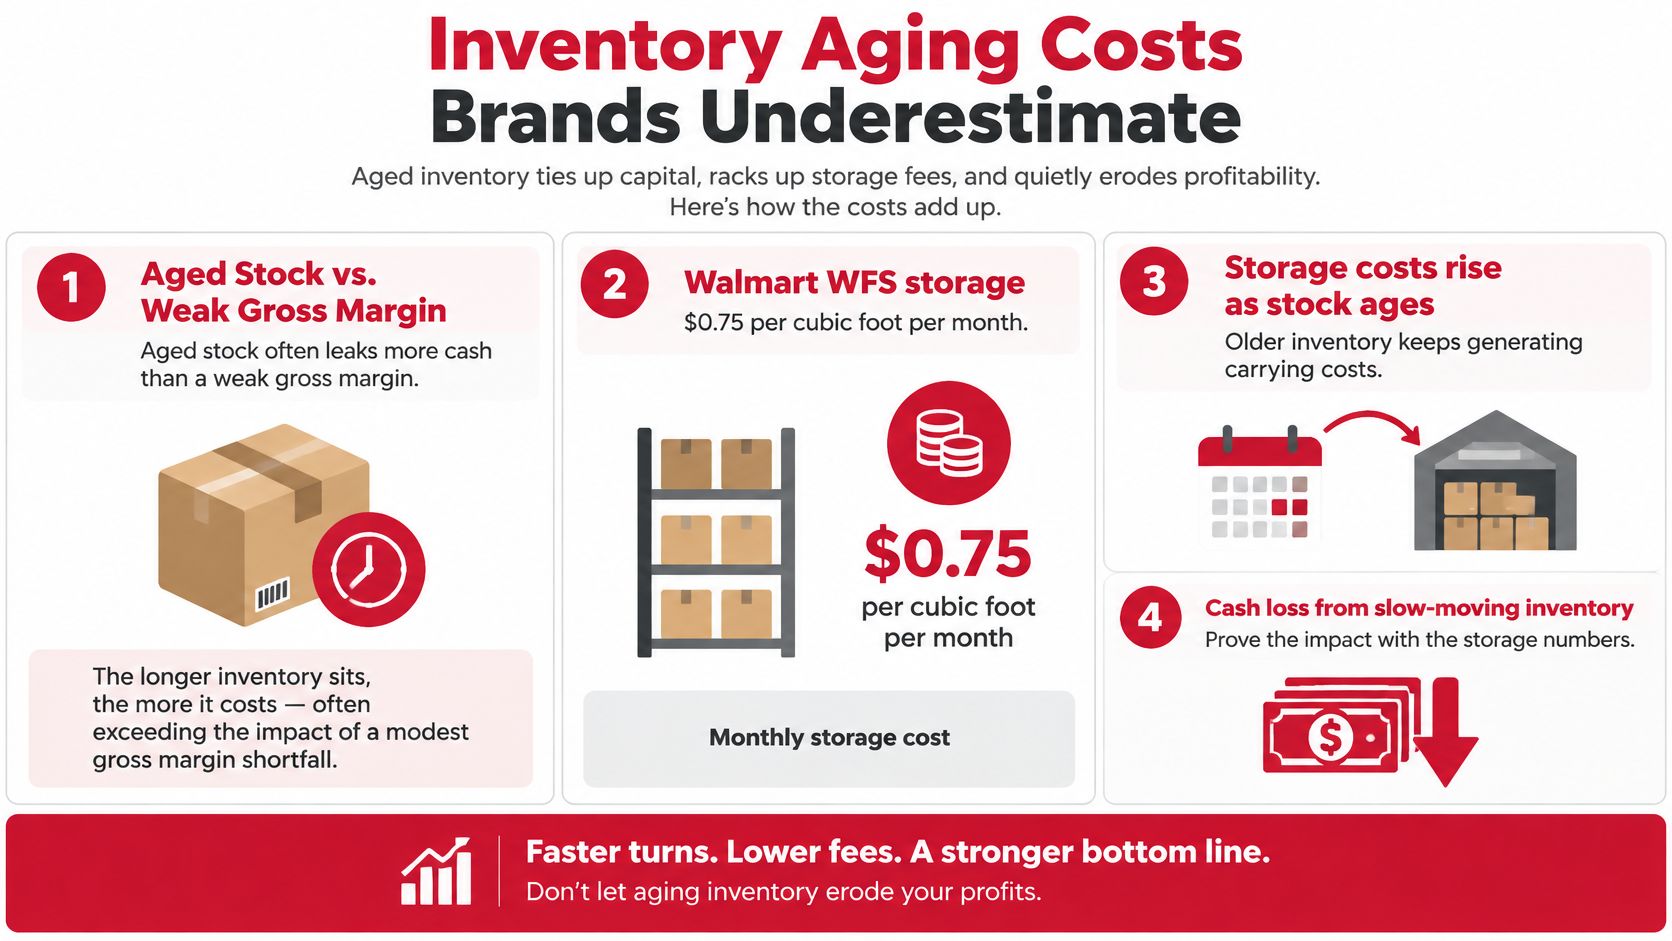
Under Walmart's WFS fulfillment pricing, storage is $0.75 per cubic foot per month during January through September and for inventory stored up to 30 days during the October to December peak, rising to $2.25 for inventory aged 366 to 450 days and $7.50 after 450 days. That oldest rate is 10 times the standard rate.
| Storage period or inventory age | Rate per cu ft per month | Monthly cost on 100 cu ft |
|---|---|---|
| January to September, standard | $0.75 | $75 |
| October to December, up to 30 days | $0.75 | $75 |
| Aged 366 to 450 days | $2.25 | $225 |
| Aged over 450 days | $7.50 | $750 |
On 100 cubic feet, you pay $750 a month instead of $75, before markdowns, disposal, or the cash locked inside the boxes. Amazon's monthly storage follows the same logic on a size-based schedule, so the channel changes but the penalty doesn't. If you need tactics for the cleanup itself, work through how to reduce inventory carrying costs before the next reorder.
Say one SKU earns 25% and turns in 20 days, while another earns 45% and sits for 120 days. The first can recycle the same inventory dollar six times while the second turns once. Ranked on gross margin, the second wins. Ranked on cash, it often loses.
Add three measures to every channel P&L review:
Set reorder points and sell-through targets when you place stock, not after it ages. Flag any SKU whose days of supply points toward the next storage tier, and decide early between price, promotion, bundle, removal, or markdown. Early exits are cheap. Late exits are invoices.
Allocate overhead by revenue and you can easily rank the wrong SKU first. Revenue says the big seller consumed the most support, warehouse labor, and software. Operations usually know better, as the dashboard comparison below illustrates.
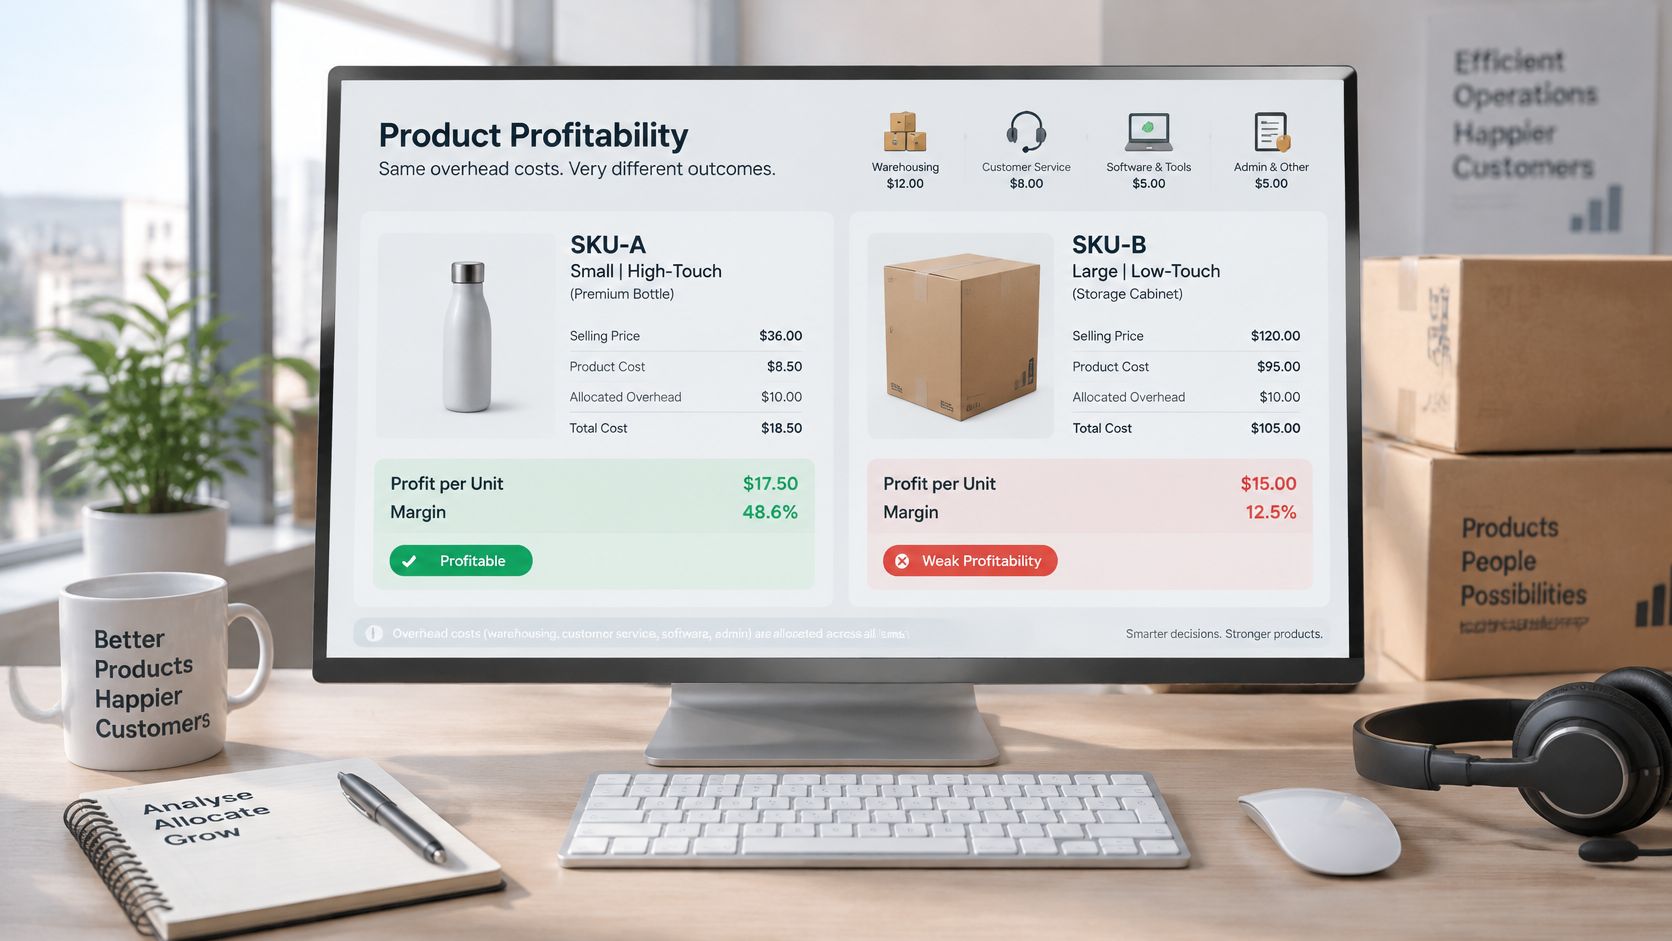
Activity-based costing fixes this by assigning each overhead pool through a measured driver. A 2023 systematic literature review of 30 years of activity-based costing research found profitability and customer-profitability analysis represented 159 reviewed publications, or 7.94% of the literature categories examined, with product profitability, customer profitability, break-even analysis, and contribution-margin determination among the recurring applications.
Say a small DTC SKU generates four support contacts per 100 orders, needs special packing, and ships in two-unit orders. A bulk wholesale SKU generates one contact per 100 orders and ships by the case. Revenue allocation charges the wholesale SKU more because its invoices are larger. Driver allocation charges the DTC SKU more because your team touches it more, and the ranking flips.
The short video below walks through how that driver logic changes a product decision in practice.
Finish with the portfolio question, not just the SKU ranking. A low-margin hero that drives baskets, subscriptions, or retailer visibility may earn its place, while a high-margin niche SKU that consumes disproportionate operations may not. That's exactly the judgment call behind SKU rationalization decisions, and it can't be made from gross margin alone.
A SKU can clear its gross margin target and still drain cash once you scale the spend behind it. A channel earns more budget only when contribution per unit, inventory velocity, and incremental ad profit all hold up in the same report. One strong metric doesn't excuse a failing one.
Run four checks before you add spend, open a channel, or broaden assortment:
That sequence matches the three stages Reddog uses to structure growth work. Foundation builds the base for operations, sales, and marketing strategies: the waterfall, settlement data, and ledger reconciliation. Optimization & Expansion strengthens and scales what already exists: price bands, fee tiers, pack decisions, and ad rules. Amplification drives brand awareness, engagement, and conversions through targeted marketing once that base is in place.
If a check fails, fix it before you scale. Added spend on a failing SKU doesn't dilute the leak; it multiplies it and ties up the working capital you need to repair the core problem. For a broader reference on structuring the underlying numbers, practical financial analysis methods for 2026 from PlotStudio AI works as a companion for organizing the data behind these reviews.
If you want a working review of these numbers, Reddog's free initial consultation assesses your current retail strategy and outlines how the team can support your business. Bring a settlement file or a channel P&L so the conversation can pinpoint where the waterfall breaks. If you'd rather gauge next steps first, a free 5-point growth audit is also available.
Reddog Consulting Group helps CPG brands audit SKU and channel profitability across marketplace fees, fulfillment, advertising, inventory, and returns, then fix the leaks before scaling spend. If your dashboard says you're profitable but your cash says otherwise, visit Reddog Consulting Group and request the free consultation to rebuild the numbers channel by channel.
Leave a comment: