
Published: March 2020 | Last Updated:October 2026
© Copyright 2026, Reddog Consulting Group.

A pallet of slow-moving product can look like progress on a balance sheet while consuming the cash you need for replenishment, advertising, and retailer support. That tension is especially sharp for CPG brands selling through Amazon, Walmart, DTC, wholesale, and distribution at the same time. Each channel has different velocity, fee structures, and service expectations, but the inventory often comes from the same working-capital pool.
The practical question isn't how to reduce inventory carrying costs. It's how to reduce the right inventory without creating stockouts, emergency freight, or lost contribution margin. The strongest operators treat inventory as a margin decision, not just a supply chain decision.
Most founders see inventory as an asset. An operator sees a set of costs that begin before the unit sells. Capital is tied up, warehouse space is occupied, teams handle the product, and every aging unit carries a growing risk of markdown, damage, expiry, or channel fee pressure.
Inventory carrying costs are commonly estimated at 15% to 30% of total inventory value. A business holding $1,000,000 in stock may therefore incur roughly $150,000 to $300,000 per year before making a sale, according to QuickBooks' inventory carrying cost guidance. That burden reduces the cash available for media, new product launches, retail promotions, and margin protection.
A useful calculation is:
Carrying cost percentage = total annual carrying costs ÷ average inventory value
Use average inventory rather than a single month-end snapshot. Add the beginning and ending inventory values, divide by two, then compare the result with the annual capital, storage, service, and risk costs attached to that stock.
A widely used framework separates carrying cost into four categories. A distributor example makes the impact concrete. With $3,000,000 in average inventory, the business incurred $660,000 in annual carrying costs, equal to 22% of inventory value, as detailed in Cleverence's carrying-cost breakdown.
The components were:
Those costs don't wait for a purchase order. They accrue while units sit in a warehouse or fulfillment center. The same reference identifies typical annual ranges of 15% to 25% for many distributors and manufacturers, 25% to 35% for fast fashion and other short-cycle consumer goods, and 10% to 18% for stable industrial parts. CPG operators should pay particular attention to seasonality, expiry windows, assortment changes, and promotional volatility because each can accelerate the risk component.
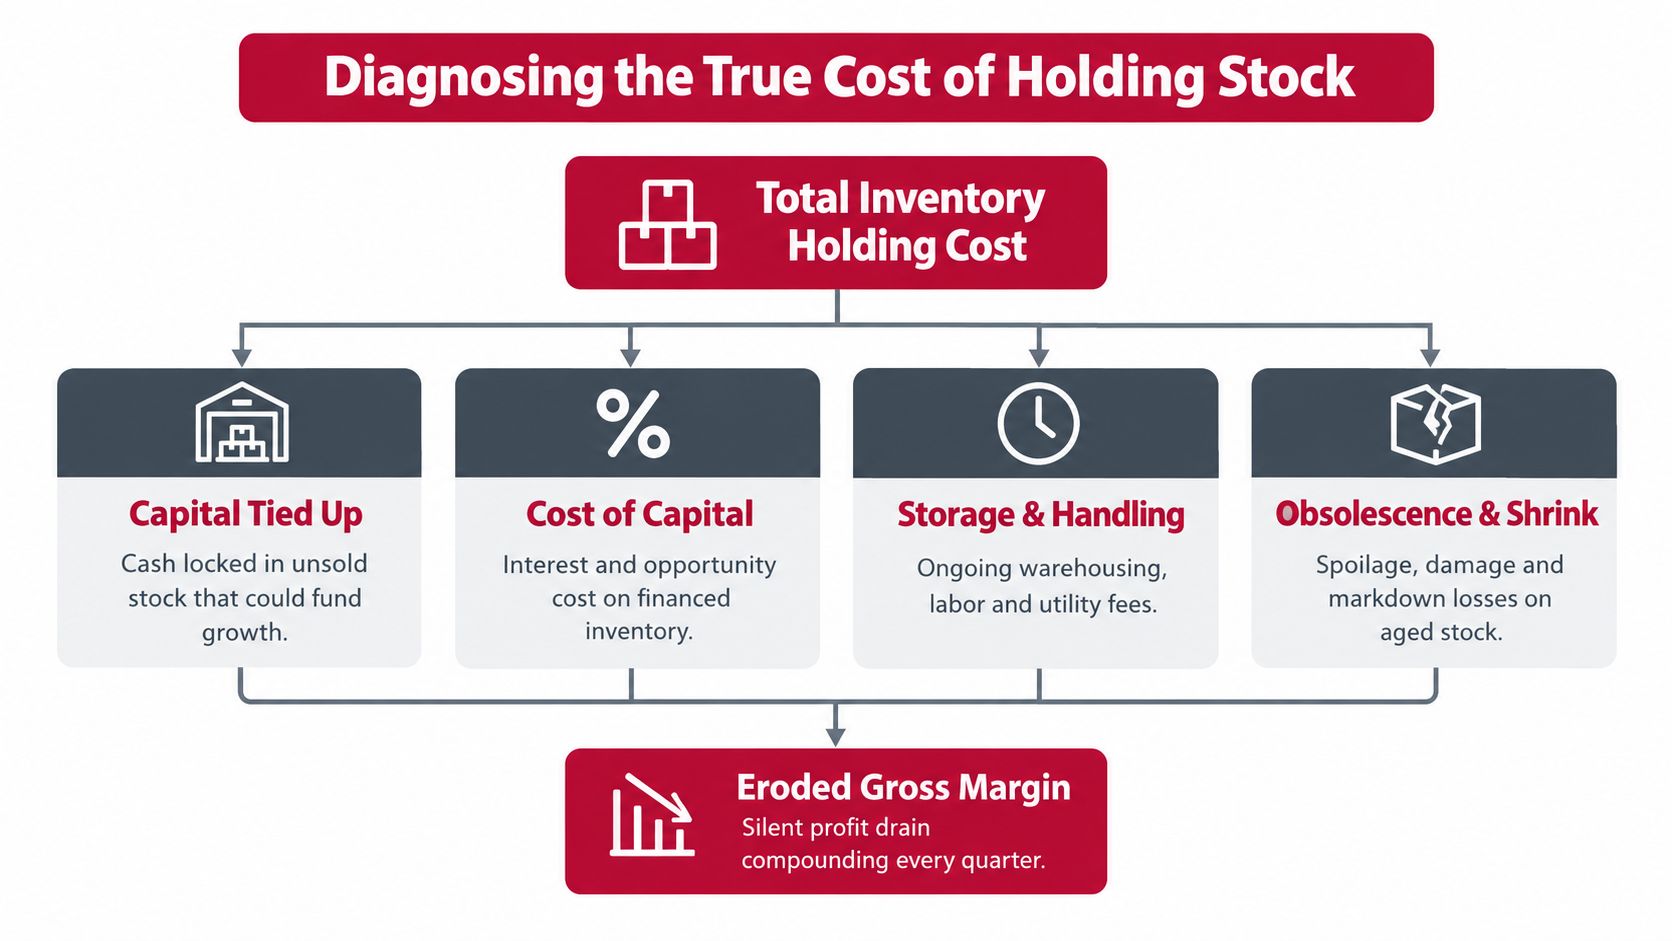
Don't calculate one blended carrying rate and stop there. A premium marketplace SKU, a wholesale case pack, and a seasonal DTC bundle may have entirely different storage, handling, and markdown exposure. Track inventory value and aging by SKU, channel, fulfillment node, and lot where relevant.
The APQC inventory carrying cost measure includes capital, storage, insurance, taxes, handling, administration, shrinkage, and obsolescence. It also emphasizes using historical data, market conditions, and external factors to estimate future demand. That matters because excess stock usually starts as a forecasting or allocation problem, not a warehouse problem.
For a practical view of how merchandise planning connects demand, assortment, and sell-through, review this guide to practical retail planning for sell-through rates. Then calculate inventory turns using a consistent definition across every channel with this inventory turnover calculation guide.
Practical rule: If a unit has no credible path to sale at an acceptable contribution margin, its purchase cost is no longer the main issue. Its remaining carrying cost and exit cost are.
A static policy such as “always hold a month of supply” sounds simple, but it ignores the variables that create stockout risk. Demand volatility, supplier lead time, order frequency, minimum order quantities, promotions, and channel priority all change the amount of buffer a SKU needs.
The better approach is to set inventory by service level and risk, then review the assumptions regularly. A critical bestseller with unpredictable replenishment may justify more protection than a low-margin variant with stable but weak demand. A long-tail product shouldn't automatically receive the same buffer as a hero SKU just because both sit in the same catalog.
Start with clean inputs. Use historical sales, current market conditions, promotional calendars, seasonality, supplier performance, and known externalities. APQC specifically recommends estimating future demand from historical data, market conditions, and external factors to reduce excess stock and the carrying-cost base. That means a forecast shouldn't rely solely on last year's shipment history when pricing, distribution, or channel placement has changed.
Then segment the catalog by both velocity and contribution margin:
A service-level model should also distinguish critical from noncritical products. In a pharmaceutical supply case, traditional days-of-supply and total ownership cost methods systematically overestimated safety stock. A total-cost-minimizing model aligned stock with demand variability and lead-time risk, with an optimal service level of 99% for critical SKUs, as reported in the service-level-based safety stock study.
Reorder points shouldn't be permanent settings buried in an ERP. Review them after meaningful changes in price, media spend, retailer distribution, supplier lead time, or promotional cadence. A new Amazon advertising strategy can change velocity quickly, while a retail reset can create a temporary demand spike that shouldn't become a permanent forecast baseline.
Use a weekly exception review rather than manually adjusting every item. Flag products with rising days of supply, falling sell-through, forecast error, delayed purchase orders, or an approaching expiry risk. The planner then decides whether to delay the next order, transfer stock, adjust price, revise the forecast, or protect the SKU because its service-level role justifies the buffer.
Lower safety stock isn't the objective. The objective is a safety-stock position that reflects the cost of being out of stock and the cost of being wrong in either direction.
Not every SKU deserves the same inventory depth, and not every product belongs in a marketplace fulfillment center. A slow-moving flavor variant can consume premium storage space while a profitable core product runs short. The catalog needs an economic review, not just a sales ranking.
Start by examining each SKU's velocity, gross margin, contribution margin after channel fees, storage profile, case-pack constraints, return behavior, and forecast confidence. A product with modest unit sales may still deserve protection if it supports a strategic retailer or drives profitable basket attachment. A seemingly popular product may deserve scrutiny if advertising, fulfillment, discounts, and aged inventory fees leave little contribution.
Use this SKU rationalization framework to separate assortment decisions from emotional attachment to legacy products.
Amazon FBA and Walmart Fulfillment Services can make sense for fast-moving products where delivery speed improves conversion and the inventory consistently turns. They become harder to justify when bulky, seasonal, or slow-moving units occupy marketplace storage for long periods. A 3PL may offer more flexibility for slower or wholesale-oriented inventory, although the brand must account for pick fees, storage terms, transportation, integration work, and service-level differences.
The decision should be based on contribution margin after the full fulfillment path, not on the lowest quoted storage rate. A cheaper node can become expensive if it creates slower delivery, more split shipments, extra handling, or lower conversion.
| Fulfillment Node | Best For | Cost Driver | Margin Impact |
|---|---|---|---|
| Amazon FBA | Fast-moving Amazon SKUs with reliable replenishment | Marketplace fulfillment, storage, aged inventory, and velocity-related fees | Strong when velocity supports delivery economics, weak when stock ages |
| Walmart Fulfillment Services | Consistent Walmart demand and products that benefit from Walmart fulfillment | Cubic-foot storage, seasonal pricing, fulfillment, and aged-inventory charges | Attractive for steady sell-through, exposed when inventory remains beyond its productive selling window |
| 3PL | Slower, bulkier, wholesale, DTC, or seasonal inventory | Pallet or bin storage, receiving, pick and pack, transportation, and account terms | Often more controllable for long-tail stock, but service and handling costs need close review |
| Brand or distributor warehouse | High-volume wholesale flows or inventory requiring specialized handling | Facility, labor, equipment, insurance, and internal management | Works when utilization is high, but excess stock still ties up working capital |
A rationalization review should end with a specific action for every underperforming SKU. Keep it, reduce the reorder quantity, move it to another node, bundle it, markdown it, liquidate it, or discontinue it. “Monitor” is useful only when it has a defined review date and decision threshold.
Protecting revenue at any cost is poor marketplace management. If a slow SKU requires heavy discounts and expensive advertising just to clear storage, compare that outcome with a controlled exit. The right choice depends on contribution margin, retailer commitments, customer expectations, and the cost of replacing the assortment.
Marketplace storage isn't a neutral warehouse expense anymore. Platforms increasingly connect the cost of space to seasonality, age, and sell-through. That changes the economics of overordering because the same physical inventory can become more expensive just because it moves slowly.
Amazon's storage model uses a storage-utilization ratio based on average daily inventory volume divided by average daily shipped volume over the past 13 weeks, according to Amazon's storage utilization guidance. In practical terms, a brand with slower sell-through can face a higher surcharge for the same physical footprint. Inventory planning, pricing, and advertising are therefore linked decisions.
Amazon also introduced a 2026 fee change for aged inventory. The minimum fee for items aged 12 to 15 months rises by $0.15 per unit to $0.30 per unit per month, as described in Amazon's 2026 aged-inventory fee information. That may look small at the unit level, but it directly reduces contribution margin on products that are already failing to turn.
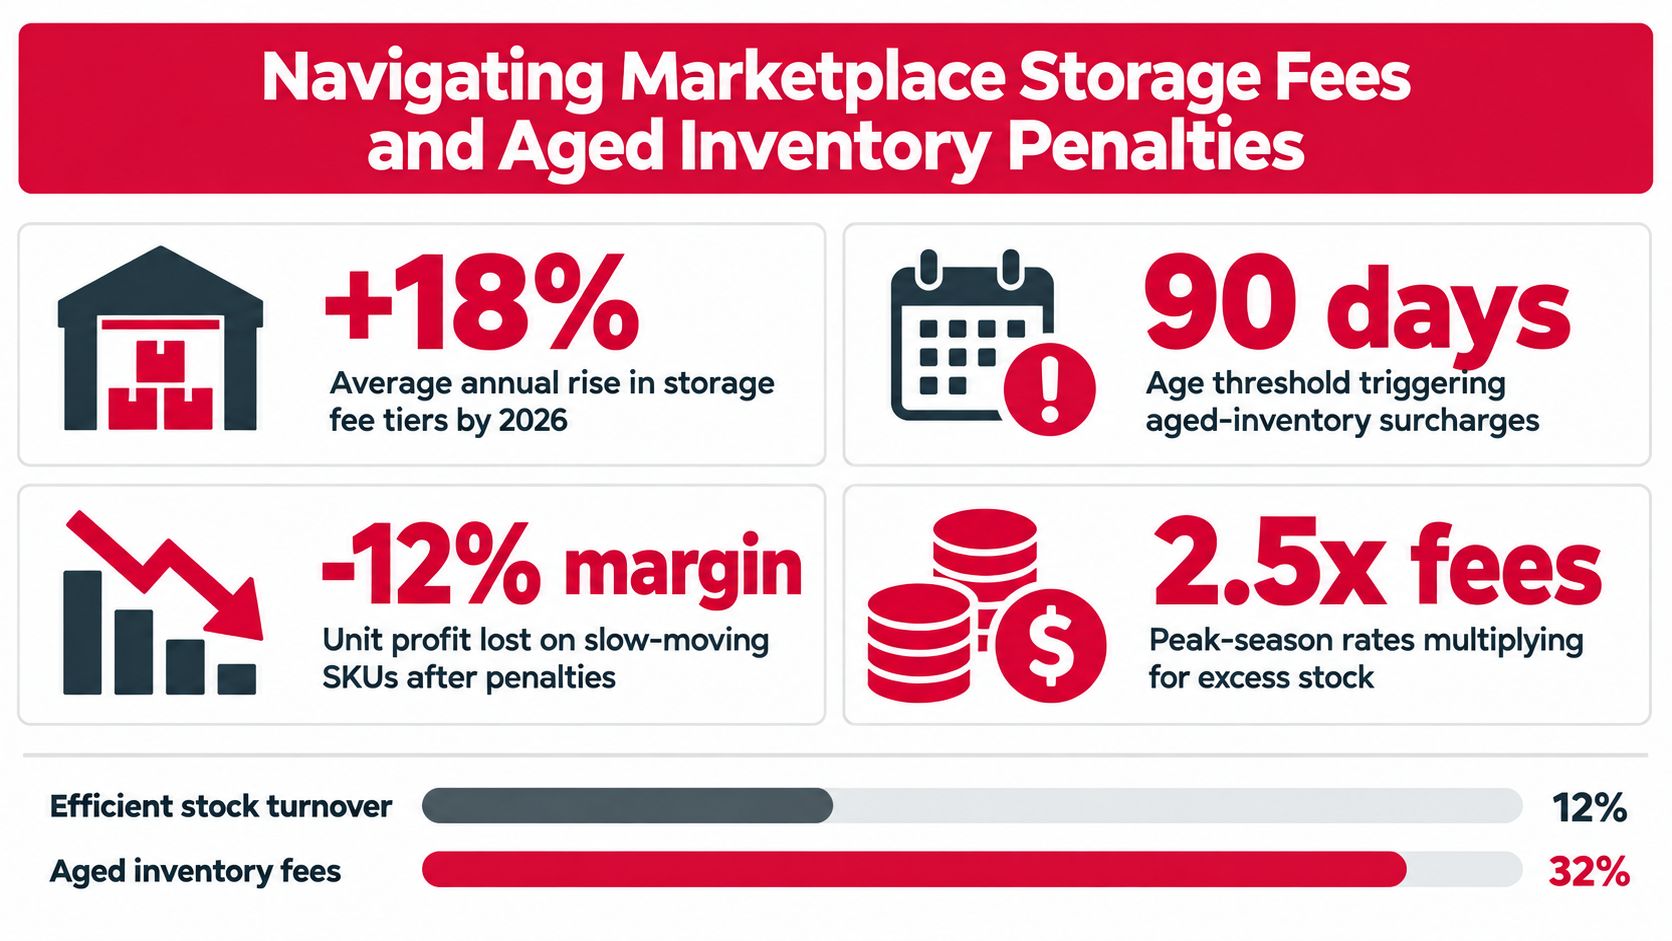
Walmart Fulfillment Services charges by cubic foot and season. From January through September, storage is $0.75 per cubic foot per month. From October through December, items stored for more than 30 days effectively cost $2.25 per cubic foot per month because of the peak-season surcharge, according to Walmart Fulfillment Services pricing.
Walmart's aged-inventory pricing takes effect June 30, 2026. Items stored for 366 to 450 days are charged $2.25 per cubic foot per month, while items stored for more than 450 days are charged $7.50 per cubic foot per month. A product that looked marginally profitable at receipt can become structurally unprofitable after storage, fulfillment, advertising, discounts, and marketplace commission are included.
Don't wait for the platform fee to force the decision. Create an exit ladder before inventory reaches an aged threshold:
The mistake is treating top-line sales as proof that the clearance worked. Measure net contribution after product cost, marketplace fees, fulfillment, advertising, discounts, returns, and avoided future storage. Amazon fulfillment fee guidance can help teams map those charges into a SKU-level margin view.
Reducing inventory can improve cash flow, but cutting stock without stabilizing the operating system can replace carrying cost with volatility. The brand may hold fewer units and still lose margin through emergency shipments, split replenishment orders, missed retailer windows, and stockouts on products that convert efficiently.
The trade-off is especially dangerous for omnichannel brands. A unit reserved for Amazon may be unavailable for a wholesale order, while a retail promotion can consume inventory planned for DTC. If planners use separate forecasts without a shared view of available supply, each channel can appear healthy until the network runs short.
A stockout isn't just a missed transaction. It can interrupt advertising efficiency, reduce marketplace momentum, damage retailer confidence, and force the team to ship product at an uneconomic cost. The right comparison is not carrying cost versus zero cost. It's carrying cost versus the full cost of shortage, including lost contribution and operational disruption.
A 2026 meta-analysis found that inventory optimization reduced total distribution costs by 10% to 22%, mainly through fewer emergency shipments and more stable replenishment cycles, according to the distribution-cost analysis. The lesson is important: the goal isn't merely to hold less. It's to hold the right stock in the right node with a replenishment process that doesn't trigger expensive reactions.
Real-time visibility helps teams distinguish genuine excess from inventory that another channel needs. It also exposes the lead-time and demand assumptions behind safety stock. One 2026 industry analysis reports that companies without accurate lead-time and demand data carry more buffer stock. The same analysis cites the Hackett Group estimate that $1.7 trillion of global working capital sits in excess inventory, while standard carrying-cost models place annual costs at 20% to 30% of average inventory value, as discussed in this supply chain visibility analysis.
Before reducing a buffer, establish:
The resilient operator doesn't ask, “How little inventory can we hold?” The better question is, “How much inventory can we remove while keeping replenishment predictable?”
Inventory optimization becomes durable when finance, operations, merchandising, and marketing use the same operating rhythm. RedDog's Foundation, Optimization, and Amplification framework fits this work naturally.
Foundation means building clean SKU, channel, cost, and inventory data. Without that base, teams can't distinguish true excess from allocated stock or calculate contribution margin consistently.
Optimization means setting service-level targets, reorder points, fulfillment nodes, pricing actions, and assortment decisions by SKU. That is where the business reduces inventory without treating every product identically.
Amplification means using freed cash and improved availability to support profitable media, retail expansion, and new product launches. Growth comes after the economics are stable, not before.
Track these metrics weekly:
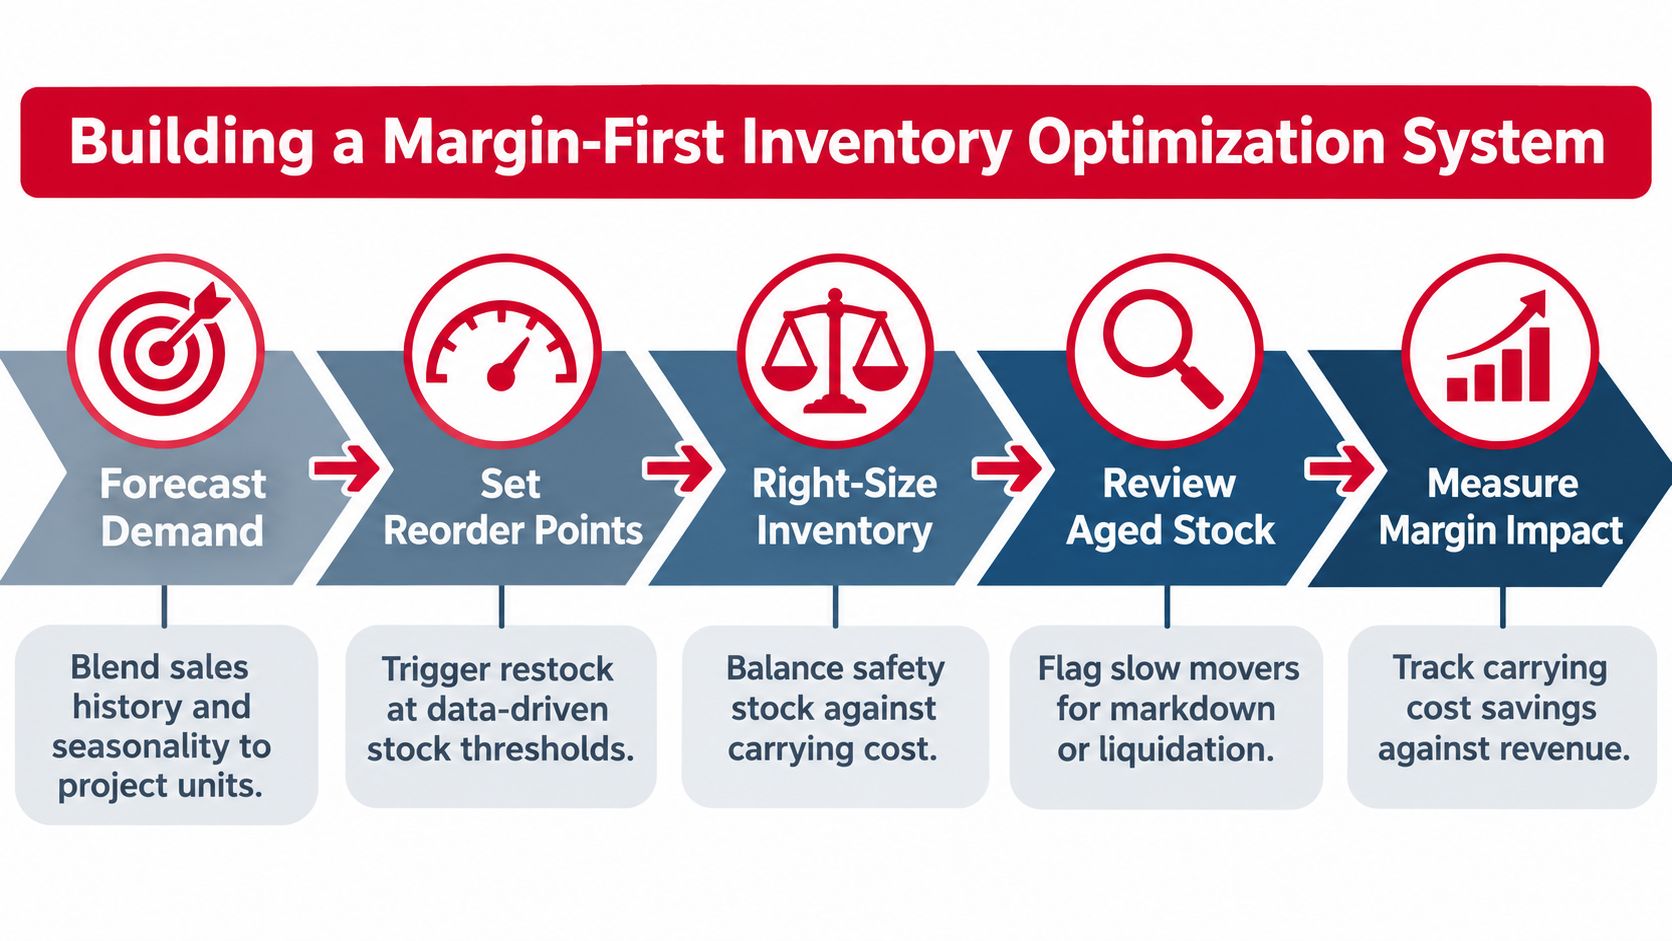
The weekly meeting should end with decisions, not another report. Identify which SKUs need protection, which need a slower reorder cycle, which need a new fulfillment node, and which need an exit plan. Then compare the inventory action with the contribution-margin result.
A simple dashboard is enough if the underlying definitions stay consistent. The point isn't to create more reporting. It's to make inventory a visible financial lever across every channel.
Use the following operating sequence when reviewing a category:
Reddog Consulting Group works with qualified CPG founders and operators on inventory velocity, marketplace economics, contribution margin, and channel growth planning. Book a free 30-minute strategy call with Reddog Consulting Group for a working session focused on reducing carrying-cost pressure and improving marketplace performance, not a sales pitch.
Leave a comment: