
Published: March 2020 | Last Updated:October 2026
© Copyright 2026, Reddog Consulting Group.

A customer opens a $45 bundle, decides one item isn't right, and submits a return through Amazon. The refund appears as a clean transaction. What doesn't appear on that line is the outbound freight already paid, the return handling, the inspection time, the inventory sitting outside available stock, the possible markdown, and the risk that the product can no longer be resold as new.
That pattern repeats across Amazon, Walmart, and DTC. Brands often treat returns and exchanges as customer-service events, then discover that the actual damage sits inside contribution margin, inventory velocity, and channel fees. A workable program treats each returned unit as a reverse-logistics workflow with a measurable recovery outcome.
U.S. retail returns reached an estimated $890 billion in 2024, equal to 16.9% of retailers' annual sales, according to the National Retail Federation's 2024 returns study. That figure was materially above the approximately $743 billion in returned merchandise recorded in 2023, and online return rates averaged 21% higher than overall retail return rates.
For a CPG operator, the refund is only the visible part. The P&L impact includes outbound freight, reverse transportation, payment fees, inspection labor, repackaging, inventory write-downs, disposal, fraud exposure, and the opportunity cost of stock that can't be sold while its condition is unresolved. A returned consumable may have a broken seal, an uncertain lot history, a shortened shelf life, or contamination risk. It isn't economically equivalent to a fresh unit pulled from production.
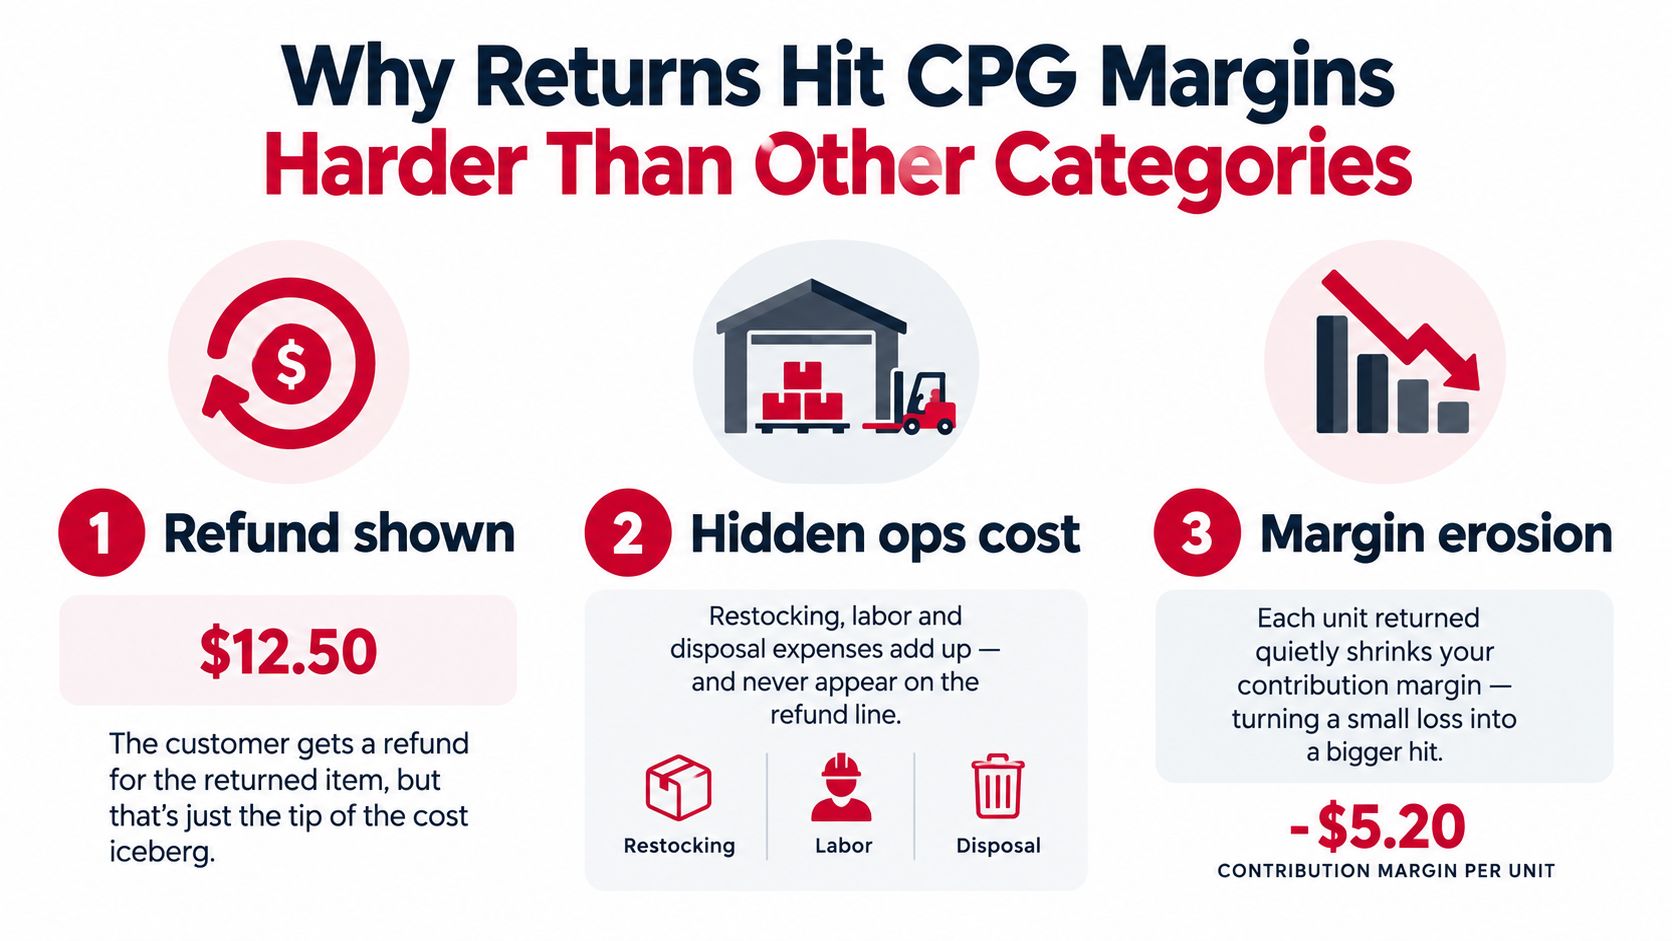
Start with the original unit economics, then add the costs created after the sale:
Practical rule: Never ask only whether the customer received a refund. Ask what happened to the unit, what value came back, and how long it remained unavailable.
Returns also carry a compliance dimension. The Federal Trade Commission's Mail, Internet, or Telephone Order Merchandise Rule requires sellers to have a reasonable basis for shipping within the advertised timeframe, or within 30 days when no timeframe is stated. If the seller can't meet that commitment, the customer must be offered consent to a delay or a prompt refund for unshipped merchandise. This rule addresses fulfillment failures, not a universal right to return unwanted merchandise, so shipment cancellations, voluntary returns, exchanges, and legally required refunds need separate handling.
A product page can also create avoidable returns by setting the wrong expectation. For size-sensitive or variation-heavy products, practical tools such as how size visualization cuts returns can support better pre-purchase decisions. The point isn't to add another widget indiscriminately. It's to reduce the gap between what the shopper expects and what arrives.
A return policy changes customer behavior. It tells shoppers how long they can delay a decision, who absorbs the shipping cost, whether cash or credit is the default outcome, and what condition the brand will accept. Copying a competitor's policy without modeling those consequences is a direct contribution-margin risk.
A longer window can reduce purchase hesitation, but it also keeps inventory and fraud exposure open for longer. A shorter window may protect recovery value for seasonal or shelf-sensitive products, yet create friction for gifts, bundles, or products that require trial.
Use category logic instead of one universal rule. A $12 consumable with low recovery value may justify a keep-the-item refund or replacement when the return cost exceeds the value of getting the unit back. A $45 bundle deserves tighter condition requirements because missing one component can make the remaining items difficult to resell.
Cash refunds are clean for the customer but final for the brand. An exchange preserves the order while correcting a fit, flavor, size, or variant problem. Store credit can preserve future revenue, but only if the process is transparent and the customer sees a useful reason to accept it.
The policy should state:
Don't use store credit as a hidden penalty. Offer it as a faster or more useful option, especially where the customer wants a different variant. At the same time, don't promise a full cash refund for a returned unit that has been opened, consumed, or materially altered if your channel rules or applicable law don't allow that outcome.
Chargebacks belong in the same financial control system. A separate process for recording chargeback entries helps prevent teams from treating disputed payments as ordinary returns. The ledger should distinguish customer refund, marketplace reimbursement, payment dispute, shipping claim, and inventory loss.
Policy consistency across channels matters, but identical wording doesn't. Amazon, Walmart, and DTC each impose different constraints. Publish a brand-level principle, then translate it into channel-compliant operating rules.
Aggregated return rates hide the SKU that is losing money. A channel can look healthy overall while a particular bundle, size, lot, or promotion creates repeated refunds and poor recovery. Build the model at order or unit level, then roll it up only after the underlying reason and disposition are known.
The starting calculation is straightforward:
Channel return rate = returned orders or units ÷ shipped orders or units
Keep customer-initiated returns separate from carrier damage, defects, cancellations, and suspected fraud. These categories require different fixes. A high damage rate points toward packaging or fulfillment. A high changed-mind rate may point toward merchandising or expectation setting. A defect rate calls for product or supplier action.
Track recovery rate as:
Recovered resale or liquidation value ÷ original landed cost
Then calculate net return cost per unit:
Outbound freight + reverse freight + labor + payment fees + write-downs + disposal minus recovered value
A neutral academic-industry review reports reverse-logistics costs of roughly $21 to $46 per return, including transportation, handling, inspection, restocking, and lost resale value. The National Retail Federation's 2025 benchmark reports 19.3% of online sales returned versus 15.8% across retail, with approximately $849.9 billion in merchandise returned. Those figures show why a free-return promise can't be evaluated from conversion data alone.
For each SKU, add landed cost, selling price, fulfillment fees, expected recovery value, average processing cost, and the likely resolution. A low-price item may not justify physical return shipping. Replacement, a keep-the-item refund, or store credit can be economically superior when the cost of recovering the unit exceeds its usable value.
Use a minimum-margin threshold for free returns. If the expected contribution after one return is negative, the policy needs a different resolution, a different price, tighter condition rules, or a product fix.
The Amazon returns process is useful for mapping the operational sequence, but the same discipline applies to every channel: identify the unit, classify the cause, record the condition, update inventory, and reconcile the financial outcome. A refund without a disposition record isn't a completed return. It's an unresolved liability.
A single returns policy across Amazon, Walmart, and DTC creates avoidable leakage because each channel controls different parts of the transaction. The same damaged unit can produce a different recovery outcome depending on where the customer bought it and which fulfillment program handled it.
Amazon generally doesn't allow a restocking fee when a buyer changes their mind and returns an item in original condition within the approved return window. For an item returned outside that window, Amazon permits a restocking fee of up to 20% of the item price. Higher deductions may apply when the product comes back used or damaged, including up to 25% for minor damage, 50% for severe damage, and 100% when the buyer returns a materially different item, based on Amazon's seller-fulfilled return guidance.
Those deductions are not automatic profit. Your team needs inspection evidence, condition notes, and a documented link between the return and the order. Without that record, an operator may absorb a preventable loss or apply a deduction Amazon doesn't permit.
Amazon FBA adds another variable. Buyers generally can request a return within 30 days of receipt, and Amazon evaluates whether the unit can return to sellable inventory. Amazon may reimburse the seller when it determines that Amazon caused damage or a defect, but an FBA refund can still debit the seller account for all or part of the refund value. Amazon also charges returns-processing fees for each returned item in Apparel and Shoes, while excluding Watches, Jewelry, Luggage, and Handbags & Sunglasses from those fees, as described in its FBA customer returns guidance.
A returnless refund can protect margin on low-value items, but it must be modeled rather than used as a blanket convenience. Review what is a returnless refund on Amazon before applying the tactic across a catalog.
Walmart Marketplace requires sellers to support at least a 30-day return window, beginning seven days after the item ships. Sellers can't charge customers return-shipping fees and generally can't apply restocking fees. For eligible return-policy exemptions, an item returned in a non-original or unsellable condition may allow additional fees up to 20% of the item price, according to Walmart Marketplace's returns policy.
With Walmart Fulfillment Services, responsibility depends on the coded reason. Walmart covers processing costs for Walmart-fault events such as damage in transit, lost or late shipments, incorrect items, inability to deliver, or a damaged shipping box. The seller carries processing and return-shipping costs for seller- or customer-fault reasons, including poor fit or quality, missing instructions, not-as-described products, defects, buyer-initiated refunds, buying another size or color, finding a lower price, changing one's mind, incompatibility, and dislike of the product or fabric. Walmart's WFS customer returns reimbursement guidance also states that sellers aren't reimbursed for costs tied to returns or refunds they initiate.
| Channel | Default return window | Return shipping paid by | Restocking fee limits |
|---|---|---|---|
| Amazon seller fulfilled | Approved return window, with limited exceptions outside it | Depends on the return reason and channel rules | Up to 20% outside the window, with higher condition-based deductions up to 100% in specific cases |
| Amazon FBA | Generally 30 days from receipt | Economics depend on responsibility and FBA processing | Governed by FBA evaluation and applicable fees |
| Walmart Marketplace | At least 30 days, beginning seven days after shipment | Seller generally can't charge the customer | Generally unavailable, with eligible exemption exceptions up to 20% |
| DTC | Brand-defined policy | Brand-defined policy | Brand-defined policy and applicable law |
DTC offers control, not free economics. The brand controls the policy, warehouse, payment flow, replacement decision, and recovery channel, but also absorbs each line item unless a carrier, supplier, or payment provider takes responsibility.
The receiving dock determines whether a return becomes sellable inventory, a recoverable asset, or a write-off. Speed matters, but speed without condition controls can contaminate available-to-promise stock and create marketplace condition violations.
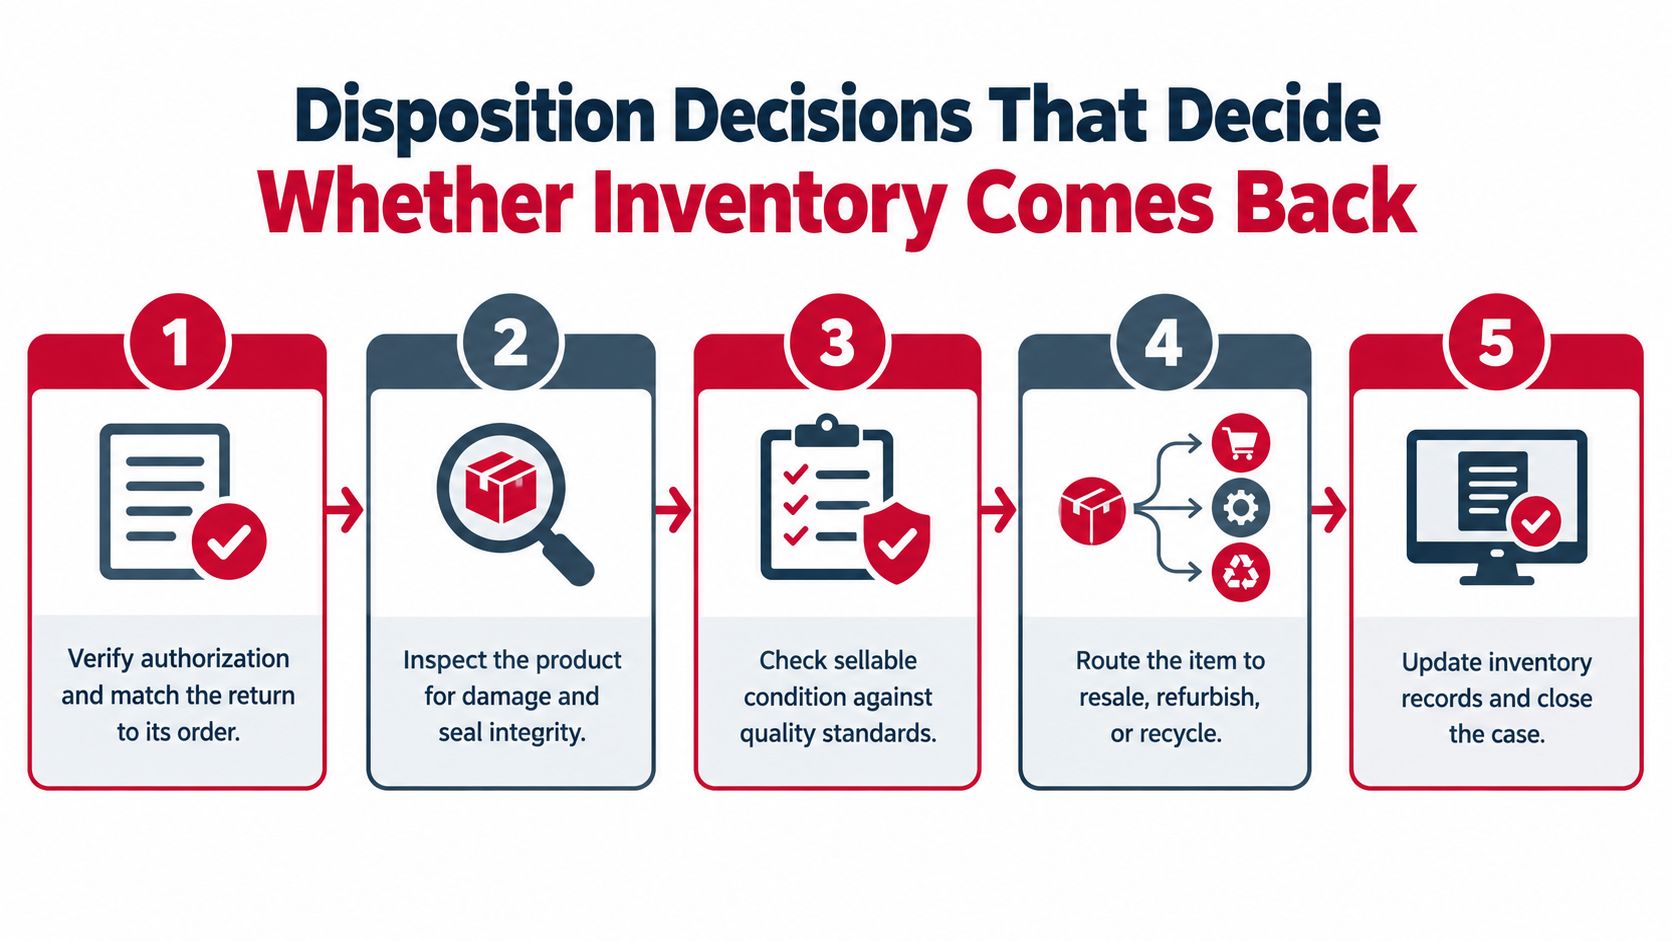
A sellable unit can return to productive inventory quickly. A repackable unit requires labor and packaging. A refurbishable unit needs a defined work order and quality sign-off. Liquidation is a recovery-rate decision, not a full-margin decision. Vendor claims require evidence and deadlines. Destruction protects customer safety and channel compliance when resale isn't defensible.
Train receiving teams to record condition with the same vocabulary every time. Cosmetic grading, seal status, lot codes, and expiry checks should appear in the SOP and in the system fields, not only in a warehouse worker's notes. If packaging material is part of the bottleneck, operational buyers may also compare options such as Where can I find the cheapest cardboard boxes in the UK?, while still selecting materials appropriate for product protection and brand requirements.
The recovery-rate formula from the earlier model gives management a common language. A rising recovery rate can reflect better grading and faster routing. A falling rate may indicate weak packaging, drifting inspection standards, stale inventory, or excessive time between receipt and disposition.
Free returns aren't automatically a growth investment. They can reduce purchase friction, but they also subsidize reverse freight, handling, condition loss, and fraud. The break-even point depends on contribution margin, repeat purchase behavior, category economics, and channel responsibility.
Take a $15 consumable as a scenario. If the unit has modest contribution margin and little resale value after opening, a physical return may destroy more value than it recovers. The brand should compare four outcomes: replacement, keep-the-item refund, store credit, and cash refund after physical return. The right choice is the one that preserves the greatest expected contribution, not the one that looks most generous in the policy.
A free-return policy can make sense when a returned customer is likely to purchase again at a healthy margin. That doesn't mean every repeat order justifies the initial loss. Calculate expected future contribution from the customer, discount it for uncertainty, and compare it with the net return cost and expected fraud exposure.
Serial returners change the model. So do customers who buy multiple variants with the intention of sending most back, and customers who exploit bundle or gift-with-purchase rules. A broad policy can create behavior that aggregate return reporting won't reveal.
Generosity should be an economic choice, not a reflex.
A rising return rate isn't always a marketing issue. It may reveal that the product doesn't match the listing, the flavor or scent description is unclear, the bundle architecture is confusing, the packaging fails in transit, or the customer can't understand how to use the product.
Reason codes need enough detail to separate:
Bundles, samples, and gift-with-purchase promotions can distort those codes. A customer may report a bundle as defective when one free item is missing, or return the paid product while keeping a promotional sample. The team should reconcile the full order composition before deciding that the core SKU has a quality problem.
Use the guide to reducing returns in ecommerce to turn recurring reasons into listing, packaging, product, and policy changes. If free returns consistently create negative expected contribution, edit the promise by SKU or category. Offer exchanges first where they solve the customer's issue, use keep-the-item resolutions where recovery is uneconomic, and reserve full cash refunds for conditions that justify them.
A returns program without a monthly dashboard becomes anecdotal. Teams remember the loudest customer, the largest refund, or the latest marketplace dispute, but those examples don't show which SKU is eroding contribution margin.
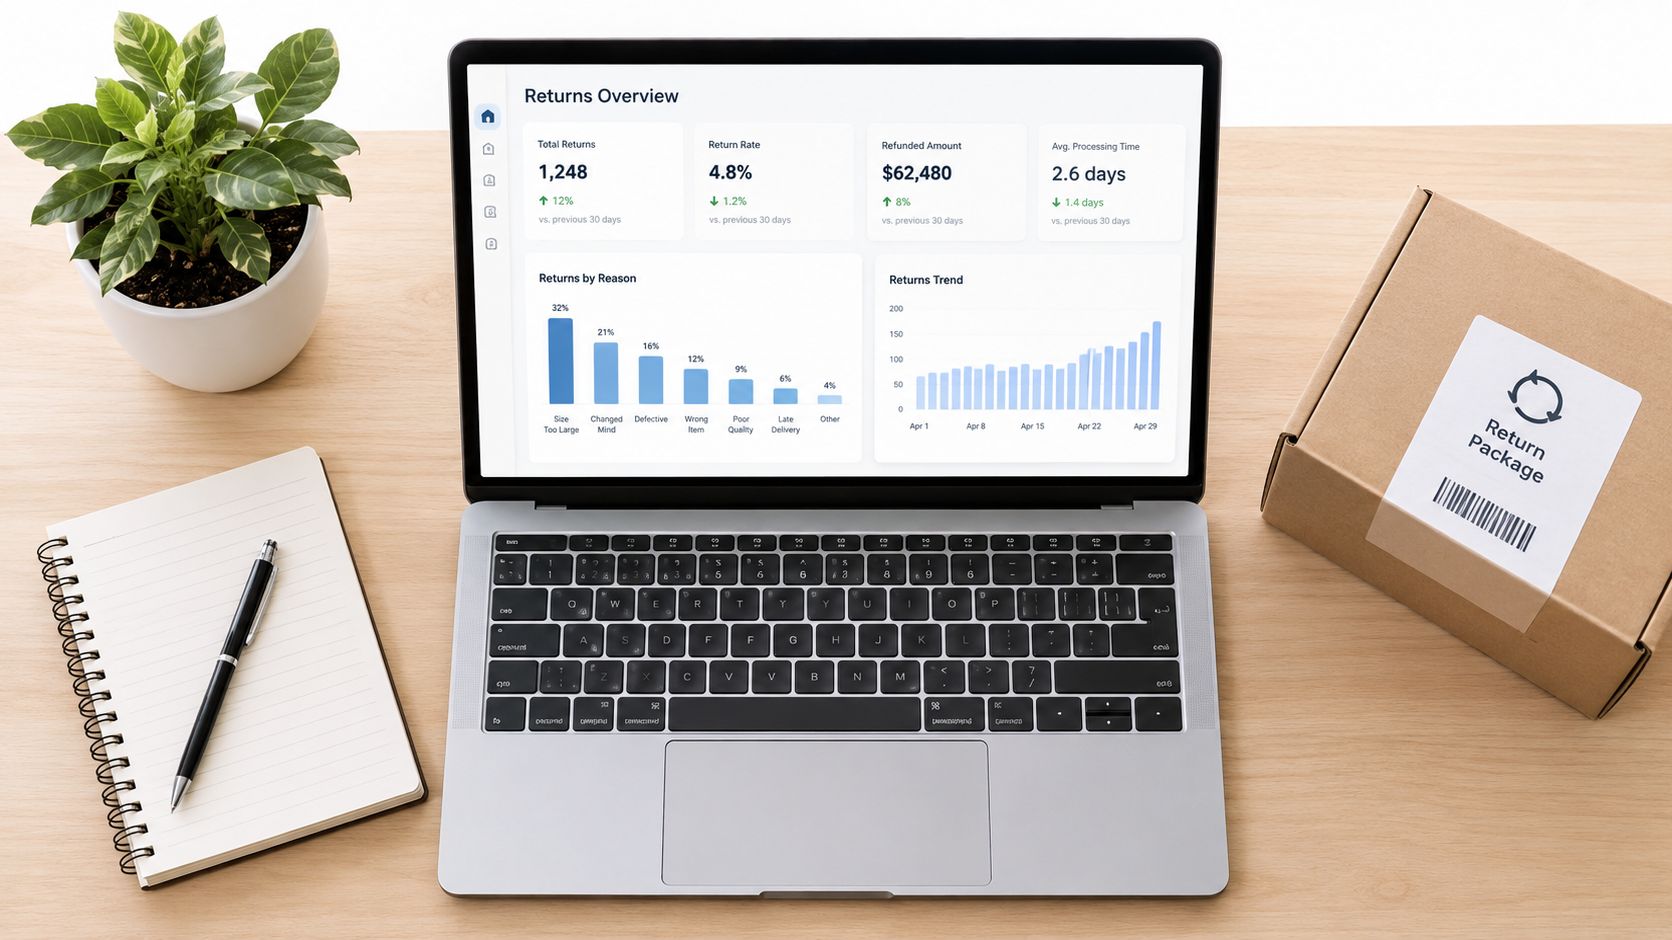
Review the dashboard by channel, SKU, fulfillment method, lot, promotion, and reason code. A channel-level average is useful for trend direction, but it shouldn't replace item-level analysis.
A monthly review should end with owners and actions. Content owns inaccurate product claims. Operations owns packaging and receiving controls. Merchandising owns variant architecture and bundle clarity. Finance owns the contribution model and channel reconciliation. Marketplace management owns reimbursement cases and policy compliance.
Reddog Consulting Group describes a returns process designed to resolve marketplace returns within 48 hours, a useful operating target to evaluate against your own workflow rather than a promise to copy blindly.
The Foundation → Optimization → Amplification framework applies cleanly here. Foundation means a clear policy, reason-code taxonomy, unit-level inventory statuses, and reliable refund reconciliation. Optimization means improving disposition, recovery, packaging, listings, and channel economics. Amplification means using the improved experience to support exchanges, repeat purchases, and higher-margin customer retention without hiding the cost of returns.
Review the Reddog Consulting Group approach if your returns data is disconnected from pricing, marketplace performance, or inventory planning. Qualified CPG founders and operators can book a free 30-minute working session focused on returns economics, contribution margin, and practical channel decisions. It's a working review, not a sales pitch, and it should leave you with clearer priorities for the next operating cycle.
Leave a comment: