Published: March 2020 | Last Updated:February 2026
© Copyright 2026, Reddog Consulting Group.

A retail profit margin calculator is a tool that pulls back the curtain on your channel economics. It shows you exactly how much cash is left after all the channel-specific costs sink their teeth into your revenue. It's not just about what you sold a product for minus what it cost to make; it’s about uncovering the real profitability of every single sale on Amazon, Walmart, or your own DTC site.
Most CPG operators start by looking at a blended gross margin across their entire business. It's a foundational metric, sure, but it’s dangerously misleading when you're juggling multiple sales channels.
A healthy-looking 45% gross margin on a spreadsheet can quickly evaporate into an unprofitable mess once you factor in the unique costs tied to each place you sell.
This isn’t just an accounting chore; it's about gaining real operational control. The retail landscape is massive—valued at roughly USD 30 trillion—and the brands that win are the ones who can translate high-level numbers into precise, actionable insights. Even the biggest global retailers, which together pulled in over US$6.03 trillion in revenue in FY2023, boosted their net profits through hyper-efficient operations, not just massive sales volume. For a growing CPG brand, that level of precision is everything.
To get your financial footing right, you absolutely have to understand the difference between three critical types of margin. Confusing them is a classic mistake that leads operators to chase unprofitable revenue and make terrible calls on inventory buys or ad spend.
Here's a breakdown of what these margins really tell you and why each one matters.
| Margin Type | What It Measures | Includes | Excludes | Key Question It Answers |
|---|---|---|---|---|
| Gross Margin | The core profitability of your product itself. | Revenue - Cost of Goods Sold (COGS) | All other business expenses (marketing, shipping, salaries). | "Is the product I'm selling profitable at a basic level?" |
| Contribution Margin | The profitability of a single sale on a specific channel. | Gross Margin - All variable channel-specific costs (FBA fees, commissions, payment processing). | Fixed business overhead (rent, salaries, software). | "Am I actually making money on each sale on Amazon after all their fees?" |
| Net Profit Margin | The final, true profitability of the entire business. | Revenue - All business expenses (fixed and variable). | N/A | "After paying for everything and everyone, is the business profitable?" |
Looking only at your gross margin is like trying to navigate a city with just a compass; it points you in a general direction but tells you nothing about the one-way streets, traffic jams, and roadblocks ahead.
Contribution margin is your GPS. It gives you the turn-by-turn guidance you need for each channel. And to truly master your profit calculations and make smart business decisions, a solid grasp of P&L management is non-negotiable.
A blended margin across your entire business? That’s a vanity metric. True operational control comes from dissecting your profitability, channel by channel. The economics of selling on Amazon are wildly different from Walmart Marketplace or your own Shopify store, and lumping them all together just hides critical weaknesses.
The goal here is to move past averages and build a precise, line-item P&L for each channel. This is exactly how you spot fee compression before it kills your cash flow. It’s how you make smart calls on where to allocate your inventory and ad spend.
This diagram shows how you peel back the layers, moving from a high-level view to a more tactical, channel-specific understanding of your profitability.
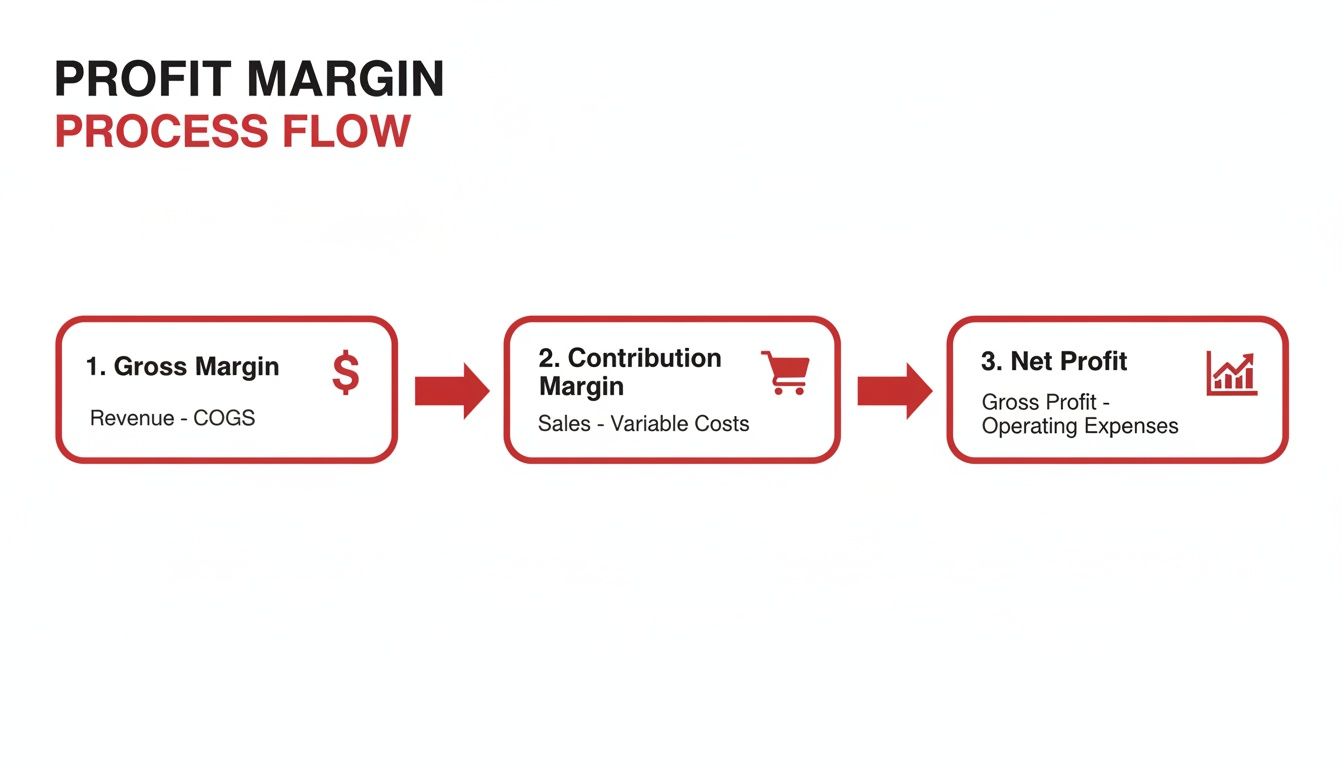
Each step filters out different costs. The contribution margin, in particular, reveals the actual cash each sale generates before you even think about fixed overhead.
Calculating your Amazon margin is a beast. The fees are numerous, they're constantly changing, and a tiny shift in dimensional weight or FBA fulfillment fees can turn a profitable SKU into a money pit overnight.
You absolutely have to include:
Operator's Takeaway: Stop using the blended ACoS from your dashboard. Calculate your Total ACoS (TACoS) by dividing total ad spend by total sales. This gives you a much clearer picture of how advertising impacts your overall channel profitability, not just the sales directly tied to ads.
Walmart Fulfillment Services (WFS) often looks simpler on the surface than Amazon, but that doesn't mean you can get lazy with the details. The core components are similar, but the rates and rules are their own animal.
Your key line items will be:
Getting a firm grip on these costs is a prerequisite for any serious conversation about how to price products for retail. Marketplace fees directly set your pricing floor.
Your direct-to-consumer channel has the highest potential for margin, but it also comes with its own set of unique—and often underestimated—variable costs. On your own site, you're trading marketplace fees for customer acquisition and fulfillment costs.
Essential costs you need to track are:
Big, flashy strategic mistakes aren't usually what kill a brand's profitability. It’s the slow bleed from a thousand tiny, untracked costs that does the real damage. I've seen even seasoned operators get blindsided by the margin killers hiding in plain sight on a P&L statement. This is where a solid retail profit margin calculator becomes your first line of defense, forcing you to confront the numbers before they drain your cash flow.
Profitability is a game of inches, especially when you're juggling the different economics of multiple retail channels. For CPG founders just starting out, looking at historical profit margin trends can show you where the landmines are. For instance, Deloitte's analysis of the top global retailers projects that despite revenue growth, US grocers are facing a 150 basis points drop in operating profit margins in 2025 thanks to inflation and rising supplier costs. When the market tightens like that, precise calculations are about survival, not just planning.

A return isn't just a sale you have to give back; it's a direct assault on your bottom line. The cost goes way beyond simply refunding the customer's money.
Let’s walk through a quick scenario:
For every 20 units you sell, one is coming back. That one return doesn't just wipe out its own $15 profit. You're also eating the cost of return shipping, FBA return processing fees (which can be a real headache to decipher), and the labor to inspect and maybe even dispose of the item. It’s not unusual for a single return to set you back $10-$15 in hard costs, vaporizing that sale's profit and taking a bite out of the next one.
Operator's Takeaway: A 5% return rate on a product with a 30% contribution margin can easily force you to sell two or three more units just to break even from that single return. This is a real cost that needs to be factored into your inventory forecasting and cash flow management.
So you're running a 20% off promotion. That doesn't just cost you 20% of the retail price—it costs you 20% of your revenue, which comes straight out of your margin dollars.
Think about it. If your product sells for $100 with a 40% contribution margin ($40 profit), a 20% discount ($20 off) doesn't just trim your margin by a fifth. It slices your $40 profit directly in half, leaving you with just $20. You now have to move twice as many units to make the same gross profit you would have without the sale.
Promotions are a great lever for driving velocity, but you absolutely have to model the impact on your bottom line first. This ties directly into inventory pressure, too. Slashing prices to clear out aging stock might feel like a win, but it can completely wreck your unit economics. A better, more sustainable fix is improving your forecasting. You can see how the pros do it by exploring the best inventory management software for ecommerce. Without a tight grip on these numbers, hidden costs create a drag on profitability that’s almost impossible to spot until it’s too late.
A retail profit margin calculator is pretty useless if it’s just an accounting exercise. Its real power kicks in when you start turning that raw data into strategic action.
Once you have precise, channel-specific margin clarity, you can stop guessing and start making informed decisions that actually drive profitable growth. This is the moment you move from just having a solid financial foundation to truly amplifying your results.
Think of the calculator as your sandbox for modeling different scenarios. What happens if you bump up your prices by 10%? How does a 5% cut in COGS from a new supplier actually flow through to your net profit? These aren't just abstract questions; they're at the core of building a resilient brand that can handle whatever the market throws at it.

Let's walk through a practical example. Imagine a brand is weighing two options to improve the bottom line on a key product:
Running this through your margin calculator will show you the real downstream effects. Option A adds a clean $2 directly to the contribution margin per unit, but you have to consider it might slow down your sales velocity a bit.
Option B only adds $0.40 per unit, but it has zero impact on consumer demand. The calculator lets you model the break-even point: how much can sales volume dip before that price increase becomes less profitable than the COGS reduction? This is exactly how you make data-backed operational trade-offs instead of just going with your gut.
Your margin data is also absolutely critical for setting intelligent advertising budgets. Instead of just aiming for a generic or "industry standard" ACoS (Advertising Cost of Sale), you can calculate your break-even ACoS.
Break-Even ACoS = Contribution Margin % (before ad spend)
It's that simple. If your contribution margin on Amazon before advertising is 35%, you can theoretically spend up to a 35% ACoS on that product before you start losing money on each sale.
This number becomes your guardrail. It allows you to be aggressive with ad spend when you're launching a new product or pushing for rank, because you know precisely where the profitability line is drawn.
To really nail your growth strategy, you have to understand every single input that goes into your profit calculation. That means mastering tools that give you a transparent look at your expenses, like a good shipping cost calculator in Australia, is vital for getting the full picture.
Expanding to a new channel like Walmart Marketplace or taking on a new wholesale account is a huge decision. Your retail profit margin calculator is the perfect tool to evaluate its financial viability before you sink a ton of time and resources into it.
You can plug in the new channel’s specific fee structure—referral fees, fulfillment costs, chargeback allowances—and model the expected contribution margin right from the start.
This grounds your growth strategy in hard numbers, not just hopes. You see this disciplined approach in market leaders all the time. For example, Fast Retailing is targeting a 16.2% business profit margin by FY2025 by meticulously managing its SG&A and gross margin, which sits at 50.7% for its UNIQLO Japan segment. A calculator helps you model that same discipline to make sure your brand can achieve similar durable growth. You can see more on their financial results and strategic insights to see how the pros do it.
Knowing your numbers is one thing, but knowing which levers to pull to change those numbers is where the real strategy comes in. Here’s a quick breakdown of common actions and how they impact your margins.
| Strategic Lever | Primary Impact Area | Example Action | Potential Risk Or Trade-off |
|---|---|---|---|
| Pricing Increase | Retail Price | Raise the price of a product by 5%. | Could reduce sales volume or perceived value. |
| Supplier Negotiation | COGS | Negotiate a 3% bulk discount with your primary supplier. | May require larger upfront inventory investment. |
| Shipping Optimization | Shipping Costs | Switch to a more cost-effective carrier or use regional fulfillment. | Slower delivery times could impact customer satisfaction. |
| Promotional Strategy | Discounts & Allowances | Run a "Buy One, Get One 50% Off" sale. | Can erode margins if not offset by increased volume. |
| Ad Spend Efficiency | Marketing Costs | Lower bids on unprofitable keywords in your PPC campaigns. | May reduce top-of-funnel traffic and brand visibility. |
| Return Rate Reduction | Returns & Refunds | Improve product descriptions and images to reduce returns. | Requires investment in content creation and quality control. |
Each of these levers comes with a trade-off. The key is to use your margin calculator to model the potential outcomes and decide which move makes the most sense for your brand's specific goals.
Getting a real grip on your retail profit margins isn't just some academic exercise. It’s the absolute bedrock of sustainable growth and what separates the brands chasing empty revenue from those building resilient, long-lasting businesses.
When you shift from a fuzzy, high-level view to a sharp, channel-specific contribution margin, you gain the control needed to navigate fee hikes, competitive pressure, and nasty inventory surprises. A precise retail profit margin calculator is what makes this shift possible, turning vague financial goals into a concrete operational playbook.
This kind of clarity is also non-negotiable when you're deciding which products to push and which to cut, a process we call what is SKU rationalization.
The frameworks we've laid out are the same ones we use to help our clients build their foundation, fine-tune their operations, and truly amplify their growth. Real scale is never an accident—it’s the direct result of disciplined financial management.
If you’re a CPG founder ready to get serious about your channel profitability, let’s talk. Book a complimentary 30-minute strategy call to actually dig into your numbers, not just sit through a sales pitch. We'll use the time to map out your real margins and pinpoint your biggest opportunities for profitable growth.
When you're in the trenches managing a brand across different channels, the same questions about profitability pop up again and again. Here are a few of the most common issues we work through with CPG founders.
There’s no magic number here. A much smarter way to look at it is aiming for a contribution margin of at least 25-30% after all of Amazon's fees and ad costs are stripped out. That’s the actual cash your sale generates before you even think about fixed overhead.
If you see your contribution margin dipping below 15%, that’s a serious red flag. It tells you something is out of whack with your pricing, COGS, or ad spend, and it needs to be fixed immediately. Sure, some hyper-competitive categories run on thinner margins, but they need an insane sales velocity just to stay afloat.
We always tell our clients to benchmark against their specific sub-category and get obsessive about their contribution margin per unit. A brand can boast a 40% gross margin all day, but if FBA fees and ACoS are eating up 30 points of that, it's a fast track to unprofitability.
For a fast-moving CPG brand, margins aren't a "set it and forget it" number. We push for a full, detailed margin review monthly. If you wait for quarterly or annual reports, you're moving too slow. By then, a small leak can easily turn into a flood.
Beyond that, a few key events should trigger an immediate recalculation in your retail profit margin calculator:
Staying on top of these numbers lets you react fast, before a minor issue spirals into a major profitability drain. It’s a core discipline for building a solid operational foundation.
Not so fast. This is a classic operational trade-off that goes way beyond a simple margin comparison. Your DTC channel might show a lower contribution margin on paper—especially with high customer acquisition costs (CAC)—but it offers strategic benefits that marketplaces just can't match.
Operator's Takeaway: On your DTC site, you own the customer data. This is a critical asset. It allows you to build long-term value through email marketing, SMS, and subscription programs. A customer acquired via your DTC channel may have a much higher Lifetime Value (LTV) than a one-time Amazon buyer.
Use your margin calculator to get a clean look at the unit economics for each channel. Then, layer in the strategic value of customer ownership and higher LTV to make a balanced call. Don't sacrifice a long-term asset for a short-term margin gain without looking at it from every angle.
At RedDog Group, we help CPG operators move past generic metrics to build resilient, profitable businesses based on a deep understanding of channel economics. If you're ready to get serious about your numbers and build a clear roadmap for growth, it's time for a working session.
Book a free 30-minute strategy call with an experienced operator. We'll dig into your specific margin challenges and identify actionable opportunities, not walk you through a sales pitch. Schedule your margin review.
Leave a comment: