
Published: March 2020 | Last Updated:October 2026
© Copyright 2026, Reddog Consulting Group.

Promotional pricing is usually presented as a demand lever. That framing is incomplete. A deal can increase orders, improve visibility, and still make the SKU less profitable after discounts, fulfillment, advertising, freight, returns, and channel costs are included.
The operator's job isn't to maximize promotional volume. It's to identify the offer, channel, and customer behavior that produce enough incremental contribution to justify the margin given away. In U.S. grocery retail, the median product is promoted once every 6.8 weeks, with a median discount of 19.5% and 28.7% of volume sold on promotion, according to large-scale retail scanner research. Promotion is part of the pricing architecture, not an occasional exception.
The popular advice says to discount when you need more traffic. A better rule is to discount only when the incremental contribution margin clears the cost of changing buyer behavior.
Three leaks usually sit underneath an apparently successful promotion:
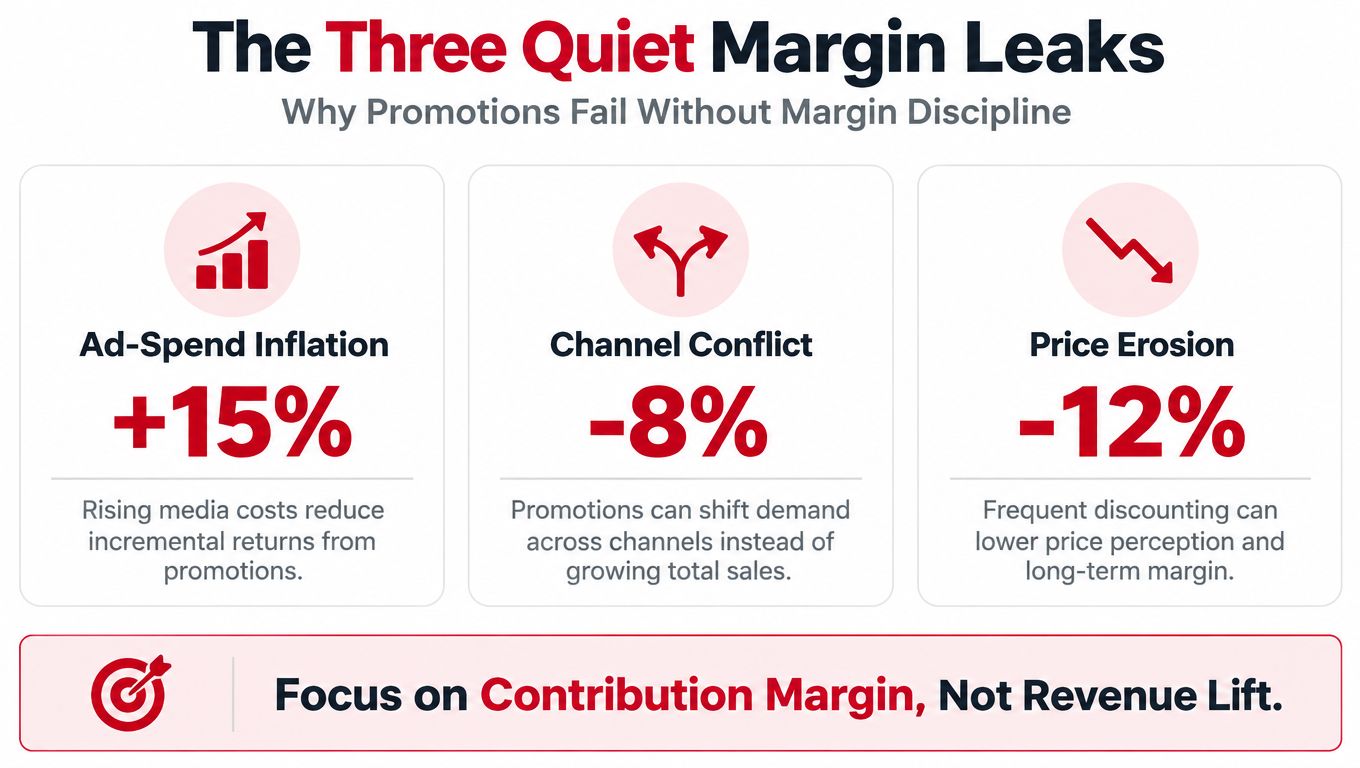
Consider a $15 SKU with a 20% discount. The customer pays $12 before any marketplace fee, inbound freight allocation, fulfillment cost, product cost, or advertising. If the brand also raises sponsored-product spend to feed the offer, the promotion may be buying revenue while reducing contribution on every unit.
Operator rule: Every percentage point of discount must clear a hurdle above variable cost. Otherwise, the brand is paying customers to accept a lower-margin purchase.
The historic economics are sobering. One industry analysis reported that companies spent about $200 billion per year on trade promotion, with promotion investment averaging nearly 20% of gross revenue across the companies studied. It also found that nearly 7 in 10 promotions lost money, while 80% could have improved volume, revenue, or profitability through a change in everyday pricing instead of a promotion. Those findings are detailed in the published trade-promotion analysis.
The practical implication is straightforward. A promotion needs a defined job, such as trial, basket building, inventory relief, or retail support. If the only objective is “more sales,” the calendar will fill with offers that subsidize purchases that would have happened anyway. Teams that need help organizing creative production and promotional assets can also use ContentBuck as a workflow resource, but the operating decision still belongs in the margin model.
Promotional pricing tactics change different parts of the unit-economic equation. Some lower the selling price. Others increase units per order, shift fulfillment cost, preserve the displayed price, or fund a reward through a separate budget.
MSRP strike-throughs create an anchor reset. They can improve perceived value, but the reference price needs to be credible and compliant with channel rules. Operators should document the regular selling price and the period during which it was available. For execution details, how to cross out prices right is a useful reference.
Percentage-off discounts are a wholesale margin donation when the brand funds the reduction. They're easy to understand and easy to compare, which makes them useful for trial and event traffic, but they reduce realized revenue on every redeemed unit.
BOGO and bundles change the value equation without always displaying a broad price cut. They work best when the second item has attractive incremental margin, complements the first product, or needs inventory relief. A bundle can also raise fulfillment complexity, so the packed-unit economics must be modeled rather than assumed.
Multi-buy thresholds trade a lower per-unit price for more units per transaction. The offer only works when the customer buys incremental units and the additional product doesn't create disproportionate freight, storage, or return exposure.
Subscribe and Save overrides can improve reorder behavior while reducing realized price. Treat the discount as a recurring cost, not a one-time acquisition expense. The customer's future contribution matters as much as the first order.
Free shipping or free gifts preserve the visible product price but move cost into shipping, product cost, or fulfillment. A threshold can protect order economics, while an unconditional offer can turn low-value orders into loss-making transactions.
Loyalty or cashback rewards delay the cost until redemption and can target existing customers more precisely than a public discount. The liability still belongs in the model, especially when rewards encourage purchases that would otherwise have occurred at full price.
Fee-funded coupons use a marketplace or retailer-supported mechanism to reduce the customer's price. They may limit the brand's direct funding burden, but they don't eliminate the need to model reduced net price, redemption behavior, ad spend, and channel effects.
| Tactic Family | Primary Lever | Margin Risk Level | Best Channel Fit |
|---|---|---|---|
| MSRP strike-through | Price anchor | Medium | Marketplaces, DTC |
| Percentage-off discount | Net selling price | High | Amazon, Walmart, DTC |
| BOGO or bundle | Units per order and mix | Medium | DTC, wholesale, marketplaces |
| Multi-buy threshold | Basket size and velocity | Medium | DTC, grocery, wholesale |
| Subscribe and Save override | Retention and recurring price | High | Amazon, DTC |
| Free shipping or free gift | Checkout friction and perceived value | Medium to high | DTC |
| Loyalty or cashback reward | Retention cost and targeting | Medium | DTC, retailer loyalty |
| Fee-funded coupon | Funding source and conversion | Variable | Marketplaces |
The right question isn't “Which discount converts best?” It's “Which lever changes behavior without pushing contribution below the floor?”
A promotion model should start with net price, not the headline discount. For a $15 CPG SKU, a 15% off offer produces a customer price of $12.75. A 10% off coupon produces $13.50. Those are the only revenue figures that matter before variable costs are deducted.
The reusable formula is:
Contribution = Net Price − COGS − Variable Fees − Ad Cost per Unit
For Amazon, variable fees may include referral fees, fulfillment fees, inbound freight allocation, coupon or deal costs, and advertising cost per unit sold. The contribution model should use the actual SKU and channel inputs. If a fee is fixed per unit, the discount makes that fee a larger share of realized revenue. If advertising rises during the event, the promotion carries both a price cost and a demand-capture cost.
Scenario A uses a 15% off Prime Exclusive Discount with sponsored-product support. Scenario B uses a 10% off coupon without an incremental ad boost. The smaller discount in Scenario B may produce more contribution per unit if the ad-supported deal requires materially higher spend.
| Line Item | Scenario A: 15% Off + Ads | Scenario B: 10% Off Coupon | Notes |
|---|---|---|---|
| Regular price | $15.00 | $15.00 | Illustrative SKU price |
| Customer discount | 15% | 10% | Offer mechanic |
| Net price | $12.75 | $13.50 | Price after discount |
| COGS | Actual SKU COGS | Actual SKU COGS | Pull from the product-cost file |
| FBA fulfillment fee | Actual fee | Actual fee | Use the current fee schedule |
| Referral fee | Actual fee | Actual fee | Apply the channel rate to the relevant price base |
| Inbound freight allocation | Actual allocation | Actual allocation | Allocate freight per sellable unit |
| Ad cost per unit sold | Incremental event spend | Baseline spend | Include only spend attributable to the units |
| Contribution | $12.75 minus all variable costs | $13.50 minus all variable costs | Compare per-unit contribution |
| Break-even velocity lift | Required to offset the contribution gap | Required to offset the contribution gap | Use baseline contribution and forecast volume |
This table is intentionally built around actual inputs rather than fabricated fee assumptions. A promotion should not go live because a template contains a plausible margin percentage. Pull the current fee schedule, COGS, freight allocation, and ad data for the specific SKU.
A discount that exceeds the SKU's available contribution margin needs an explicit justification. That justification could be inventory relief, new-SKU trial, a measurable halo effect, or a retailer commitment. “The event should improve rank” isn't enough. The required velocity lift is the volume increase needed for total incremental contribution to equal the contribution sacrificed per unit. Calculate it before launch, then compare the forecast with historical promotion response.
The research on promotional response reinforces why this matters. A store-level study found that a 10% supported-price decrease increased daily own-category revenue by about 12%, while a 10% unsupported decrease increased it by about 10.3%. Yet 46% of promotions expanded own-category revenue, 2% reduced it, and 52% had no effect, according to the empirical promotion study. A lift forecast is a probability, not a guarantee.
Use the retail profit margin calculator to structure the inputs, then validate the result against the actual channel settlement report.
A 20% discount on Amazon absorbs referral, fulfillment, coupon, and PPC costs before contribution is visible. The same discount on DTC absorbs pick-pack, shipping subsidy, and acquisition cost. Channel choice changes the margin equation, not just the traffic source.
Amazon promotions can combine coupons, Prime Exclusive Discounts, Subscribe and Save, and sponsored advertising. Track promotional funding separately from PPC funding so the post-event report shows the offer's complete cost and the advertising cost required to sell it.
Amazon has announced that U.S. FBA fees will include an average increase of $0.08 per unit sold for 2026, described as less than 0.5% of an average item's selling price, while large standard-size product fees are stated to remain unchanged. Amazon has also announced that a 3.5% fuel and logistics surcharge is scheduled to begin April 17, 2026, and that holiday peak fulfillment fees are scheduled to apply from October 15, 2026 through January 14, 2027. Treat these as planned cost changes and build them into the promotion calendar before committing discount depth. Verify the applicable fee class against Amazon's published 2026 FBA fee schedule, rather than applying a generic marketplace assumption.
A 20% discount may look workable until fulfillment and advertising are layered in. Set a TACoS ceiling before launch, calculate contribution after every Amazon charge, and stop raising bids only because conversion improves. A promotion that increases ordered units while lowering contribution per order can still weaken the account.
For execution details, use this Amazon promotion planning guide alongside the SKU-level channel P&L.
Walmart promotions require MAP coordination, clear retailer-funding terms, and a view of how rollbacks affect the broader price story. WFS adds fulfillment and storage costs, so the offer should be evaluated against both current contribution and potential aged-inventory exposure. Confirm the current schedule in Walmart's published WFS fee schedule before approving the markdown.
A markdown can make sense when faster sell-through reduces storage exposure or clears inventory with a defined exit plan. It weakens the business when it only pulls demand forward, leaves the regular-price period softer, or consumes retailer funding that would have supported a more productive event.
DTC economics depend on email and SMS quality, offer segmentation, bundle construction, and first-order acquisition cost. A sitewide discount gives away margin to returning customers who may have purchased without an incentive. Threshold offers, targeted codes, bundles, and free-shipping tests give operators more control over who receives the subsidy.
Model the offer against allowable CPA and contribution after fulfillment. Include pick-pack fees, payment processing, shipping subsidy, gift cost, and expected refunds in the same order-level worksheet. Judge the result by incremental contribution, not revenue alone.
Wholesale promotions commonly use off-invoice allowances, scan-based support, or retailer-specific events. Determine whether the retailer is creating incremental consumer demand or buying inventory forward. Replenishment data helps separate a genuine velocity event from a shipment spike.
| Channel | Primary Deal Types | Fee or Ad Cost Impact | Recommended Margin Buffer |
|---|---|---|---|
| Amazon | Coupons, Prime Exclusive Discounts, Subscribe and Save | Referral, fulfillment, coupon, and PPC costs | Preserve a buffer for fee and ad volatility |
| Walmart | Rollbacks, retailer-funded markdowns, WFS offers | Fulfillment, storage, and trade funding | Protect against storage and aged-inventory exposure |
| DTC | Thresholds, bundles, codes, free shipping | Fulfillment, payment, shipping, and CAC | Hold room for acquisition and service costs |
| Wholesale | Off-invoice, scan support, retailer events | Trade rate, allowances, and forward-buy risk | Protect regular-price and replenishment economics |
A promotion should have one owner accountable for contribution margin. Shared responsibility often becomes no responsibility, especially when merchandising owns the deal, marketing owns the traffic, and operations owns the inventory.
Define one primary objective: velocity lift, new-SKU trial, inventory clearance, or a trade commitment. Select the SKU and review prior results, including realized price, contribution per unit, sell-through, refund rate, and post-event demand.
Lock the pricing architecture and confirm MAP across channels. Build the PDP, email, SMS, retailer, and advertising assets before the final week. The offer should be reviewed against the margin floor before anyone submits it to a retailer or activates it in Seller Central.
Forecast demand uplift using the closest comparable event, not an optimistic target. Confirm inventory at the 3PL, fulfillment center, or retailer network. Pre-stage advertising budgets with daily caps, and decide who can approve a change if spend or sell-through moves outside plan.
QA the live offer. Verify that coupons, discounts, bundles, and subscriptions are stacking as intended. Brief customer support on eligibility, returns, and any exclusions.
During the event, monitor daily TACoS, sell-through, realized contribution per unit, inventory cover, and refund rate against the forecast. Within 5 business days after the event, compare actual results with the plan and record the learning in a shared tracker.
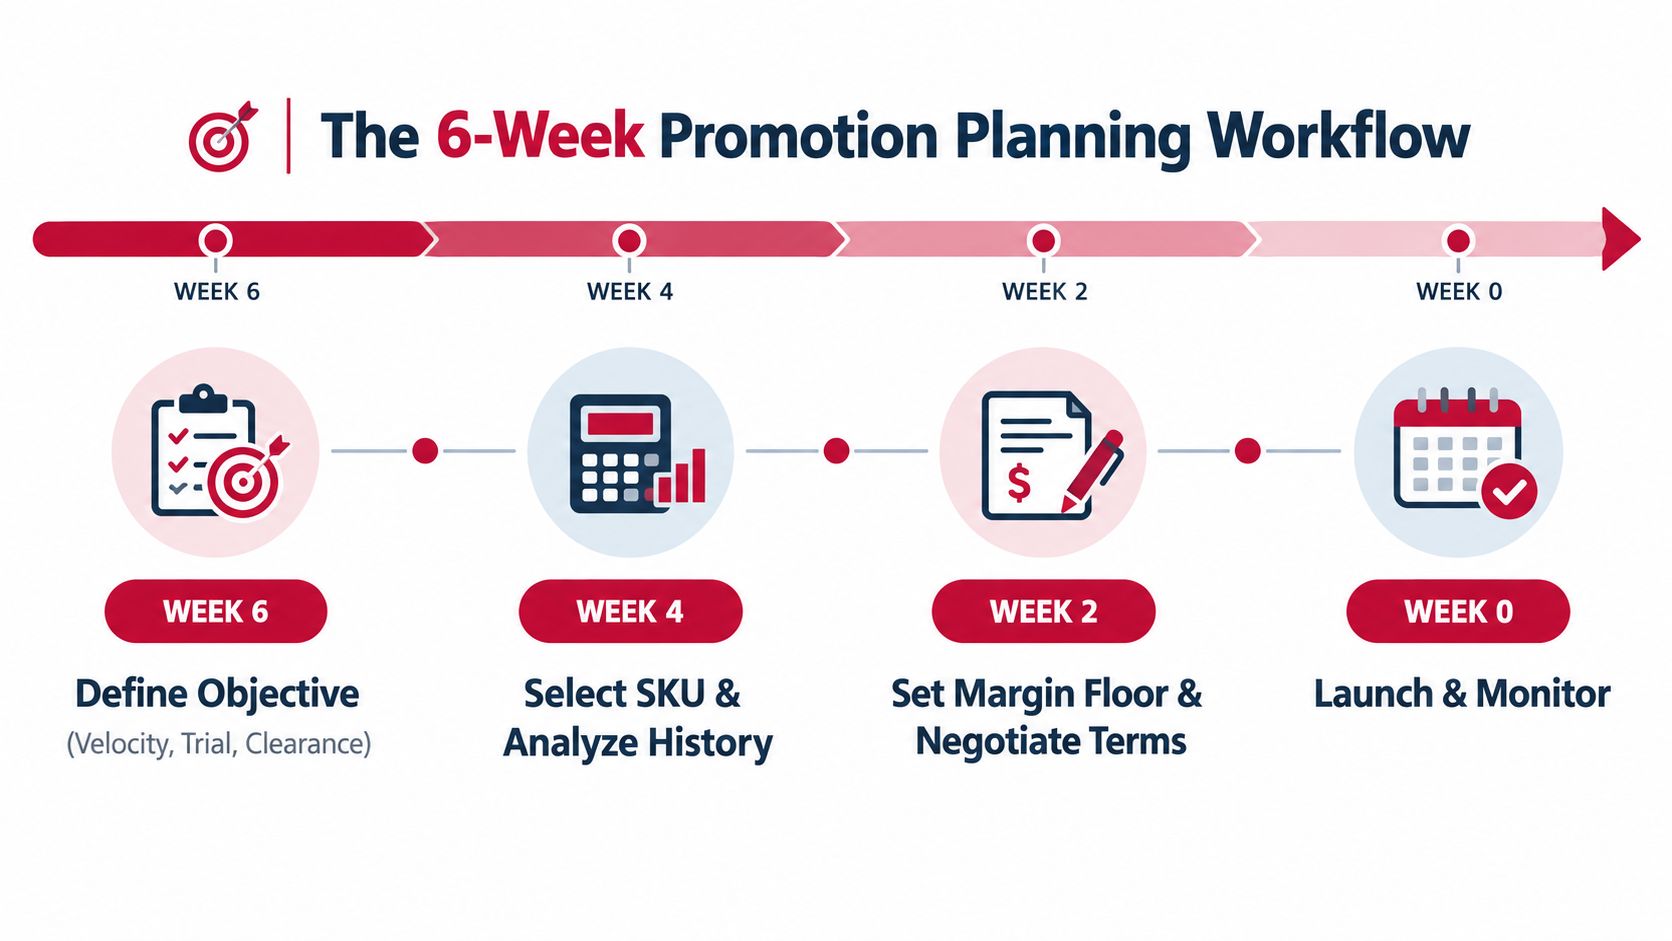
The tracker should record the objective, audience, offer mechanic, funding owner, inventory position, planned contribution, actual contribution, and next action. That turns the next event into an informed decision instead of another calendar entry.
A useful planning walkthrough can also sit alongside the written workflow:
Revenue lift is not the primary score. ROAS isn't either. Both can improve while the brand gives away more contribution than it creates.
Track the following measures at SKU and channel level:
| KPI | What It Measures | Healthy Threshold | If You Miss |
|---|---|---|---|
| Contribution per unit | Profitability after variable costs | At or above the approved floor | Reduce depth, ad spend, or SKU scope |
| Incremental sell-through | True demand created by the offer | Above the baseline forecast | Stop treating planned purchases as lift |
| New-to-brand orders | Customer acquisition quality | Meaningful share of event orders | Target the offer more precisely |
| Retention at 30, 60, and 90 days | Whether the deal creates durable demand | Stable or improving versus baseline | Reduce repeat-discount exposure |
| Refund rate | Post-purchase quality and fit | Within the normal SKU range | Review traffic, promise, and product |
| Inventory variance | Operational control | Within the approved plan | Reforecast replenishment and event depth |
The trade-spend optimization guidance is useful for connecting event funding with the wider commercial budget. If contribution missed plan, diagnose the reason before scheduling another event. If margin cleared the floor and retention held, scale the mechanic selectively into another channel.
Most promotion failures trace back to the operating system around the offer, not the discount depth itself. A brand can launch an attractive deal and still lose money when customer behavior, inventory, fees, or channel policy changes the economics.
Deal dependency is a common example. If a large share of weekly demand comes from a coupon or Subscribe and Save discount, organic demand at the regular price may weaken after the offer ends. Buyers learn when discounts appear, which reduces pricing control and makes future full-price conversion harder.
Channel conflict creates a separate risk. A marketplace rollback can weaken the DTC price story when the same customer sees both offers during one buying window. Set MAP enforcement, retailer communication, and channel-specific calendars before a public deal launches.
Amazon economics require a line-by-line review. Deals, coupons, referral fees, fulfillment charges, and advertising can all affect the same order. The headline discount shows only one part of the reduction in contribution, so approve the offer against the final per-order margin.
Inventory traps often appear after the event. A successful promotion can consume available stock quickly, create a stockout, and interrupt replenishment. On Walmart, the aged-inventory tiers covered in the channel playbook can turn a successful event into a storage bill when sell-through does not clear the stock. Review Walmart's published WFS aged-inventory fee schedule when setting the required velocity. Markdown can protect cash when it improves sell-through, provided the inventory benefit exceeds the margin given up.
| Failure Mode | Typical Margin Damage | Early Warning Signal |
|---|---|---|
| Deal dependency | Lower full-price demand and weaker price realization | Customers wait for recurring offers |
| Channel conflict | Lost DTC or wholesale pricing credibility | Retailer and marketplace prices diverge |
| Fee compression | Variable costs consume the discount benefit | Contribution falls despite higher orders |
| Inventory trap | Stockout or aged-inventory exposure | Sell-through moves outside the replenishment plan |
| Brand-equity erosion | Customers treat the deal as the normal price | Regular-price conversion weakens |
Brand equity can erode gradually. If shoppers see the deal as the normal price, regular-price conversion weakens and every future event requires more support.
If one of these issues appeared last quarter, make the next promotion smaller, narrower, or more targeted. A deeper discount can increase orders while leaving the underlying margin problem untouched. Review the failure mode first, then change the mechanic, audience, timing, or SKU scope that caused it.
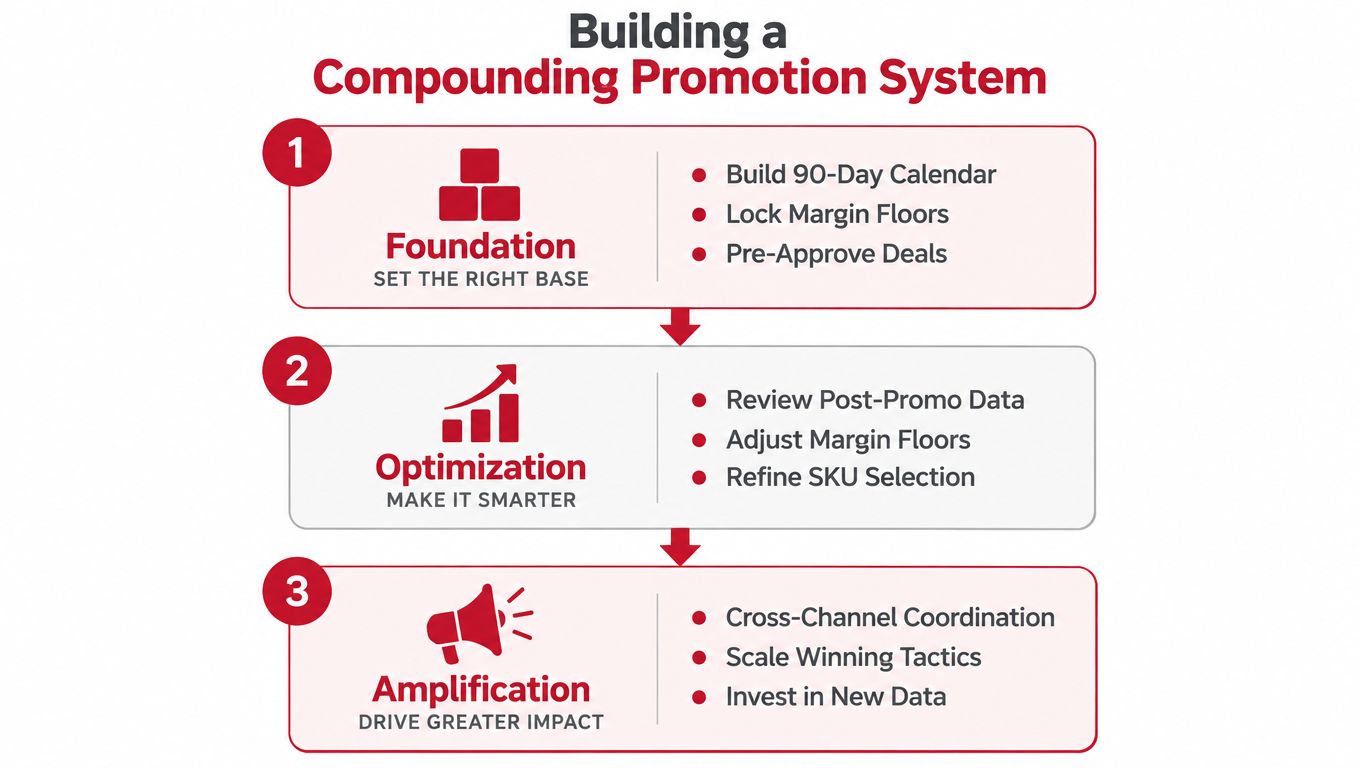
A durable program follows Foundation, Optimization, and Amplification.
Foundation means building the calendar in advance, locking contribution-margin floors by SKU, and requiring approval against those floors before launch.
Optimization means measuring contribution, incremental sell-through, retention, inventory variance, and refund behavior after every event. Kill a tactic that misses its contribution floor repeatedly, even if it produces attractive revenue.
Amplification means reinvesting recovered margin into a smaller set of higher-confidence plays. A quarterly flagship event per channel can create more useful learning than constant promotional noise.
A practical margin-review working session should pull the last 90 days of promotion P&L by channel, rank each tactic by contribution margin per unit, and remove the weakest plays from the next calendar. Book a free 30-minute strategy call with Reddog Consulting Group to review marketplace performance, promotion economics, and the growth plan without turning the session into a sales pitch.
Leave a comment: