
Published: March 2020 | Last Updated:September 2026
© Copyright 2026, Reddog Consulting Group.

Most advice on e commerce advertising still starts with platform tactics. Bid more on Amazon. Launch Meta retargeting. Push Performance Max harder. Expand to Walmart Connect. That's backward.
The first question isn't where to spend. It's whether an ad-driven order leaves real dollars behind after product cost, fulfillment, referral fees, storage, discounts, and inventory drag. If you don't know that number at the SKU level, you're not scaling. You're buying revenue and hoping the P&L forgives it later.
Retail media has become too large to treat casually. WARC and WPP Media project global retail media investment at $177.7 billion in 2025, rising to $201.6 billion in 2026, which would represent 16.3% of all global ad spend, with more than four-fifths of spend concentrated in China and the United States (WARC retail media forecast). That scale matters because commerce media now sits at the center of how brands buy growth. It also means more brands are competing inside environments where visibility often has to be paid for.
The fix is simple, but not easy. Rebuild e commerce advertising around contribution margin and inventory velocity. That's where a lot of brands need a more disciplined operating model: Foundation, then Optimization, then Amplification. In practice, that means earning the right to scale instead of paying to hide weak economics.
The most common mistake in e commerce advertising is treating higher spend as proof of growth. It isn't. A rising ad budget can just as easily mean you're paying more to move lower-quality orders through a cost structure that keeps getting tighter.
A lot of brands still manage to platform ROAS because it's visible and easy to report. The problem is that ROAS ignores the costs that decide whether a business keeps its margin. Marketplace fees, fulfillment costs, promotional discounts, and inventory carrying costs don't show up cleanly in ad dashboards. They show up later, in a monthly close that looks worse than the ad account.
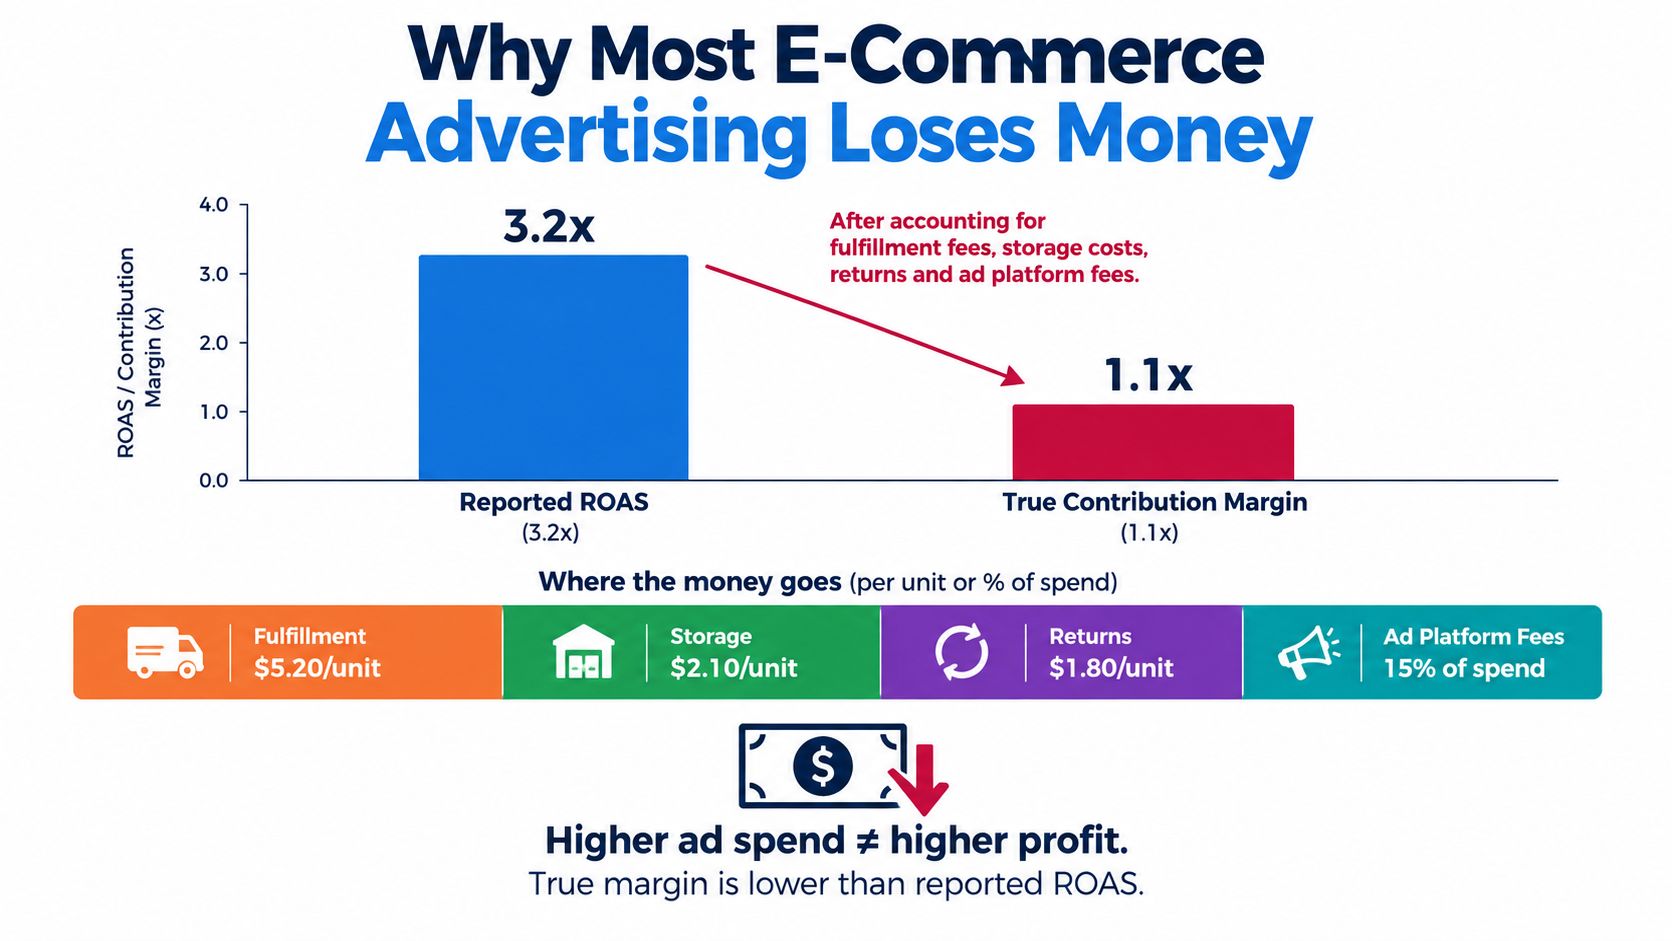
Here's the operational reality. A campaign can report strong top-line efficiency and still fail the P&L test once the order lands. That happens constantly on Amazon and Walmart because ad decisions get separated from fee math and inventory decisions.
Break-even ACoS is the simplest way to expose the gap. One Amazon example showed a $24.99 product with $6.50 COGS and a real break-even ACoS of 22.4%, far below the 48% many sellers assume when they ignore downstream costs (NovaData break-even ACoS example). That's the difference between advertising to actual contribution and advertising to a fantasy margin.
Practical rule: If you can't calculate break-even ACoS from pre-ad contribution margin, your budget target is probably too high.
This is why the right lens is dollars per unit, not dashboard aesthetics. The brands that hold up over time don't scale because they bought more traffic. They scale because each additional order still leaves enough contribution to fund inventory, operations, and the next growth cycle.
The historical growth of marketplace advertising made this easier to ignore. Amazon's ad business reached approximately $20.6 billion in 2022, almost double its 2020 level, while Statista notes that online retailers typically use three digital advertising channels on average, with more than nine out of ten using search engines. Statista also reports that influencer marketing grew sevenfold between 2017 and 2023, reaching more than $21 billion (Statista on e-commerce advertising and marketing). More channels created more spend opportunities. They did not automatically create more profit.
The Foundation, Optimization, and Amplification sequence corrects that. It forces ad spend to follow economics instead of ego.
E commerce advertising is no longer a channel plan. It is the paid layer that moves inventory across marketplaces, retail media, search, social, and your own store. The job is not to win platform ROAS screenshots. The job is to buy profitable orders at a pace your margin and stock position can support.
That changes how the mix gets built.
On Amazon, paid media includes Sponsored Products, Sponsored Brands, Sponsored Display, and DSP. On Walmart, it includes self-serve search and managed retail media. On Google, it is Shopping, Performance Max, and Search. On Meta, it is catalog ads, Advantage+ programs, and remarketing tied back to product feeds. Add TikTok Shop ads, CTV retargeting, affiliate and creator traffic, plus owned placements like lifecycle email, SMS, and onsite merchandising, and channel silos stop being useful.
The same shopper can see a product on Meta, price-check it on Google, convert on Amazon, then reorder through DTC. The order lands in one place. The cost stack behind it spans several.
That is why I treat e commerce advertising as a commerce system with three economic jobs:
Each job has a different tolerance for CAC, attribution noise, and payback period. Discovery can work with weaker attribution if repeat rate and margin justify it. Marketplace search usually needs tighter efficiency because referral fees, fulfillment fees, and promo pressure already take their cut before ad spend enters the picture.
Store readiness still decides whether paid media scales cleanly or burns margin. Feed quality, title structure, taxonomy, review depth, and landing page clarity affect ad relevance, conversion rate, and organic discoverability at the same time. If the catalog is sloppy, paid media ends up subsidizing basic merchandising problems. Brands trying to improve both paid and organic performance can use ecommerce SEO services as a reference point for the structural work that supports lower acquisition costs.
The practical rule is simple. Assign each surface a job it can do at a positive contribution margin, then measure the order where it lands and how fast that order turns inventory.
Channel selection gets distorted when teams judge performance by platform ROAS instead of contribution dollars per order and how fast that spend turns inventory. Amazon can show strong conversion and still be the worst economic choice after referral fees, FBA, coupons, and rising storage costs. Meta can look expensive on first purchase and still work if repeat rate is strong and the SKU carries enough gross margin on the second and third order.
The useful comparison is simple. What does each channel do to intent quality, fee load, measurement confidence, and margin after fulfillment?
| Channel | Average CPC / Take Rate | Buyer Intent | Attribution Maturity | Contribution Margin Headroom |
|---|---|---|---|---|
| Amazon | Mature campaigns often see CTR around 0.4% to 0.6%, healthy conversion rates around 10% to 12%, and TACoS in the 10% to 15% range in one benchmark set (Amazon benchmarks) | Very high | Strong inside platform | Usually tight once referral, fulfillment, storage, and promo costs are fully loaded |
| Walmart | Public benchmarks are thinner, but teams should expect marketplace media costs in a meaningful paid search range. One 2025 benchmark roundup places Walmart CPC around $0.60 to $1.20 depending on category and query mix (retail media benchmarks) | High, with less volume than Amazon | Improving, still less mature than Amazon and Google | Often better than Amazon on some SKUs, but only if in-stock rates and assortment discipline stay clean |
| Shopping and PMax costs vary by category, but Google usually sits in a higher-CPC, high-intent position relative to retail media and converts best when the site already has demand capture fundamentals in place | High | Mature | Better than marketplaces when the site converts well and branded search is segmented from prospecting | |
| Meta | Ecommerce benchmarks for paid social often show lower immediate efficiency than search because traffic is colder and attribution is less direct (Meta benchmark reference) | Mixed | Weaker than search and marketplaces | Wide range. Creative quality, offer structure, and repeat behavior decide whether margin survives |
| DTC owned media | No marketplace take rate, but the brand absorbs payment processing, fulfillment, CX, returns, and site conversion risk | Depends on source | Best on owned properties | Highest theoretical headroom. Also the easiest place to hide bad CAC if teams ignore shipping, discounts, and return rates |
Amazon is a demand capture machine for products with clear search intent and enough gross profit to carry the marketplace toll. It breaks down fast when brands chase top-line revenue and ignore fee math. I have seen plenty of SKUs with strong ad conversion lose money because ad spend was layered on top of referral fees, FBA, coupons, and a bad inbound profile. Strong execution helps, but it does not erase weak unit economics. For teams tightening marketplace execution, this guide to Amazon advertising strategy is a useful operational reference.
Walmart gives brands another high-intent shelf with less crowding than Amazon. The upside is often cheaper customer acquisition on the right terms. The downside is lower volume, fewer data comforts, and less room for catalog mistakes. Walmart tends to reward disciplined operators more than aggressive spenders.
Google captures demand that already exists. That sounds safer than paid social, and often it is, but Google can still waste money through branded bleed, poor feed structure, and broad PMax allocation that overweights easy traffic. If the site converts poorly, Google does not fix that problem. It sends more paid clicks into it.
Meta is where many brands confuse attention with profitable growth. Paid social is useful for product launches, bundle pushes, list growth, and broadening reach beyond marketplace search, but only if the creative system is consistent and the landing path is built to convert cold traffic. Teams that need a practical outside reference can review this Facebook advertising agency guide for paid social execution patterns.
DTC owned media has the best margin potential and the most ways to fool operators. There is no marketplace commission, but there is still a cost stack. Shipping subsidies, merchant fees, returns, customer service, and discounting can eat the gain quickly. DTC works best when the product has repeat behavior, merchandising control matters, and the brand can keep conversion high without permanent promo dependency.
Use the channel that leaves the most contribution dollars after fees and moves inventory at a healthy pace.
Good channel strategy starts with economics, not with whichever dashboard reports the prettiest ROAS.
The strongest growth systems sequence spend by economics. That's what Foundation, Optimization, and Amplification should mean in practice.
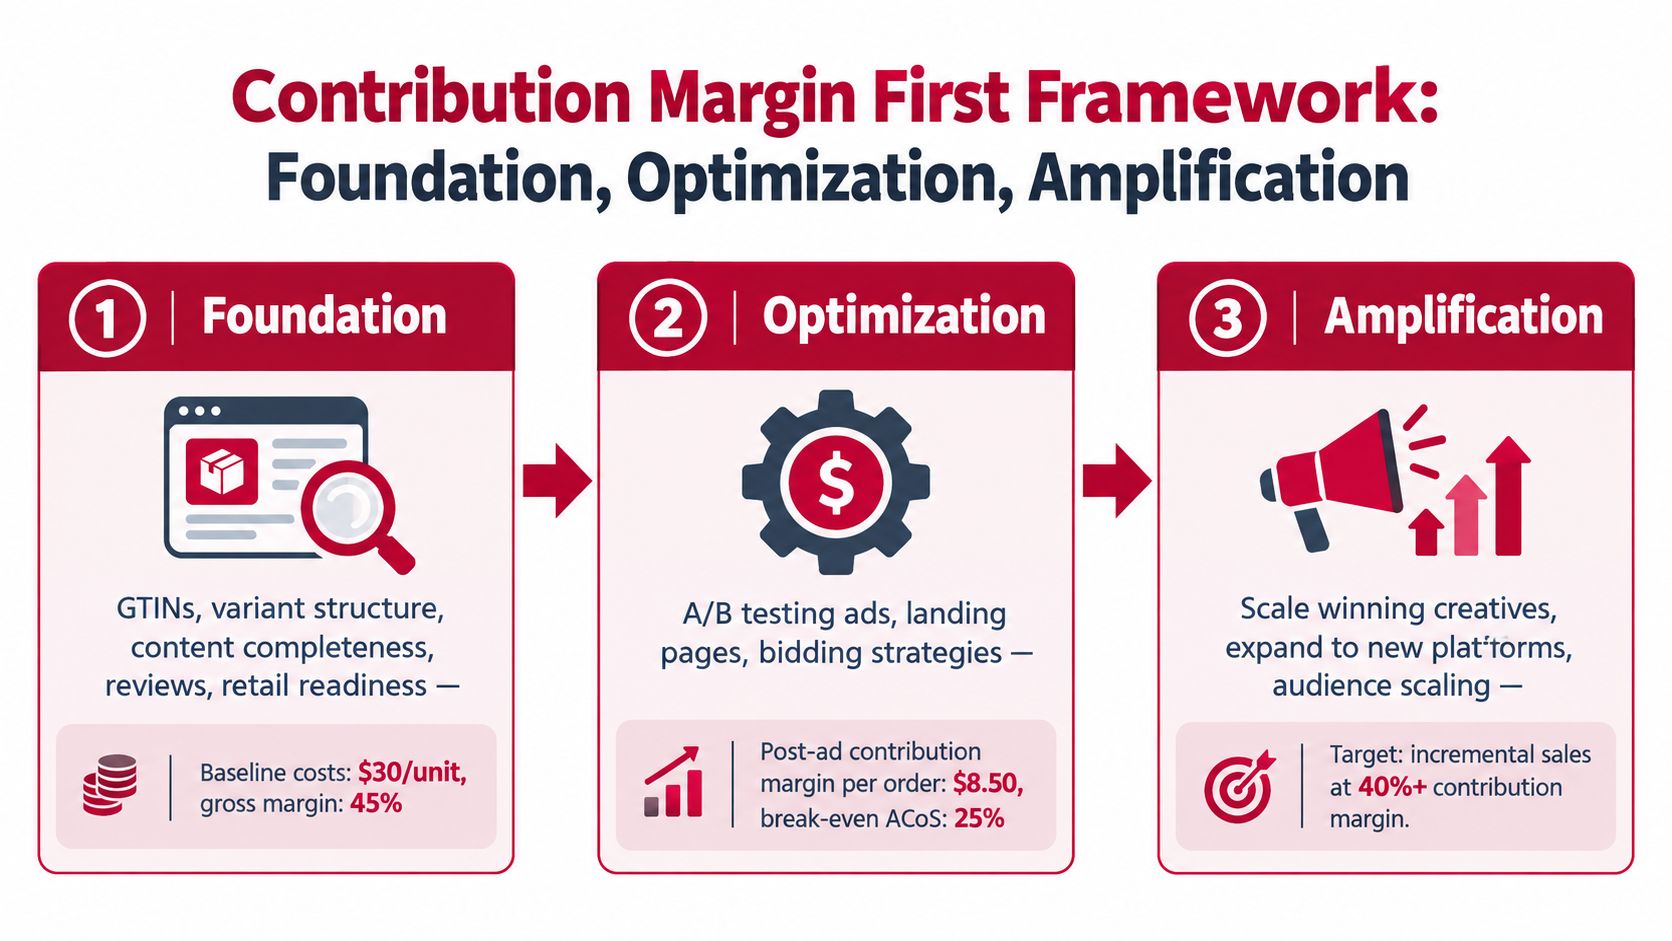
Foundation is retail readiness. Clean GTINs. Correct parent-child setup. Complete titles, bullets, images, and A+ or equivalent rich content. Reviews that remove friction. Inventory depth that keeps the buy box and avoids stockouts during ranking windows.
If the listing or PDP can't convert traffic on its own, ads become expensive life support. That's not a media problem. It's a merchandising and operations problem.
A lot of teams also need clean financial definitions here. Contribution margin has to be calculated consistently before anyone starts setting ad targets. This guide on how to calculate contribution margin is a useful baseline for getting the math right across channels.
Foundation is where brands remove the reasons a shopper says no before they pay to attract that shopper.
A working session on this stage often pulls in marketplace management, retail analytics, and operators like Reddog Consulting Group alongside internal finance and supply chain leads, because catalog quality and margin quality usually need to be fixed together.
A short walkthrough helps:
Optimization starts once the offer is structurally sound. Teams mine search terms, tighten bids to break-even contribution, cut spend on fat SKUs, and align TACoS expectations to seasonality and ranking goals.
On Amazon especially, break-even ACoS has to be modeled at the SKU level because fee structure and fulfillment costs change item by item. One guide breaks that into selling price minus referral fee, minus fulfillment fee, minus landed cost, and notes that seasonal fee changes require recalculating the threshold for each SKU rather than using one portfolio benchmark (Autron SKU-level break-even ACoS guide).
Amplification comes after the business proves it can absorb incremental dollars without margin decay. That's when Sponsored Brands video, offsite Meta, retargeting layers, creator seeding, and CTV can make sense.
Exit criteria matter. I look for a stable conversion baseline, reliable inventory coverage, contribution margin per order above target over repeated cycles, and a creative cadence that can support expansion. Brands that skip Foundation burn cash. Brands that never leave Optimization cap themselves before the model is ready to scale.
Media budgets should start at the SKU, not the platform. That sounds obvious, but many teams still back into budgets from channel goals, then try to justify them later with blended ROAS.
The cleaner method is to build a unit economics worksheet for each priority SKU. Start with net selling price. Subtract product cost, inbound freight, referral fees, fulfillment, storage, and any rebates or promotional markdowns. What's left is pre-ad contribution. From there, calculate break-even ACoS and set a target that still leaves acceptable post-ad contribution per order.
| Line Item | Example Value | Notes |
|---|---|---|
| Net selling price | Qualitative example | Use realized selling price after promo impact |
| COGS | Qualitative example | Include landed product cost, not just factory cost |
| Inbound freight | Qualitative example | Don't leave out prep and inbound handling |
| Referral fee | Varies by marketplace | Marketplace percentage changes category economics |
| Fulfillment fee | Varies by channel | FBA and WFS economics differ by size and handling |
| Storage | Varies by age and footprint | Aging inventory changes ad profitability |
| Pre-ad contribution | Calculated result | This determines break-even ACoS |
| Break-even ACoS | Calculated result | Ad spend can't exceed this over time |
| Target post-ad contribution | Calculated result | Sets practical bid and budget guardrails |
Walmart is a good example. WFS storage is listed at $0.75 per cubic foot per month from January through September, rises to $2.25 per cubic foot per month for inventory aged 366 to 450 days, and reaches $7.50 per cubic foot per month for inventory older than 450 days (Walmart WFS fee guide). If your ad strategy pushes too much slow inventory into the network without enough sell-through, storage costs can erase the margin your campaign model assumed.
That's why inventory velocity belongs in the budget model, not in a separate ops spreadsheet.
I like budgets that separate defense from learning:
If a SKU can't hold positive post-ad contribution consistently, it doesn't deserve incremental budget, no matter how pretty the revenue line looks.
Rebalance using rolling contribution by SKU, not short-term ROAS mood swings. Fee compression is steady. Budget discipline has to be steadier.
Most ad dashboards answer the wrong question. They show whether a platform generated revenue. They don't show whether that revenue created usable contribution.
The KPI stack should move from the unit level up to the portfolio. Start with the economics that determine whether an order was worth acquiring. Then add campaign health metrics. Only after that should you look at portfolio-level growth and payback.
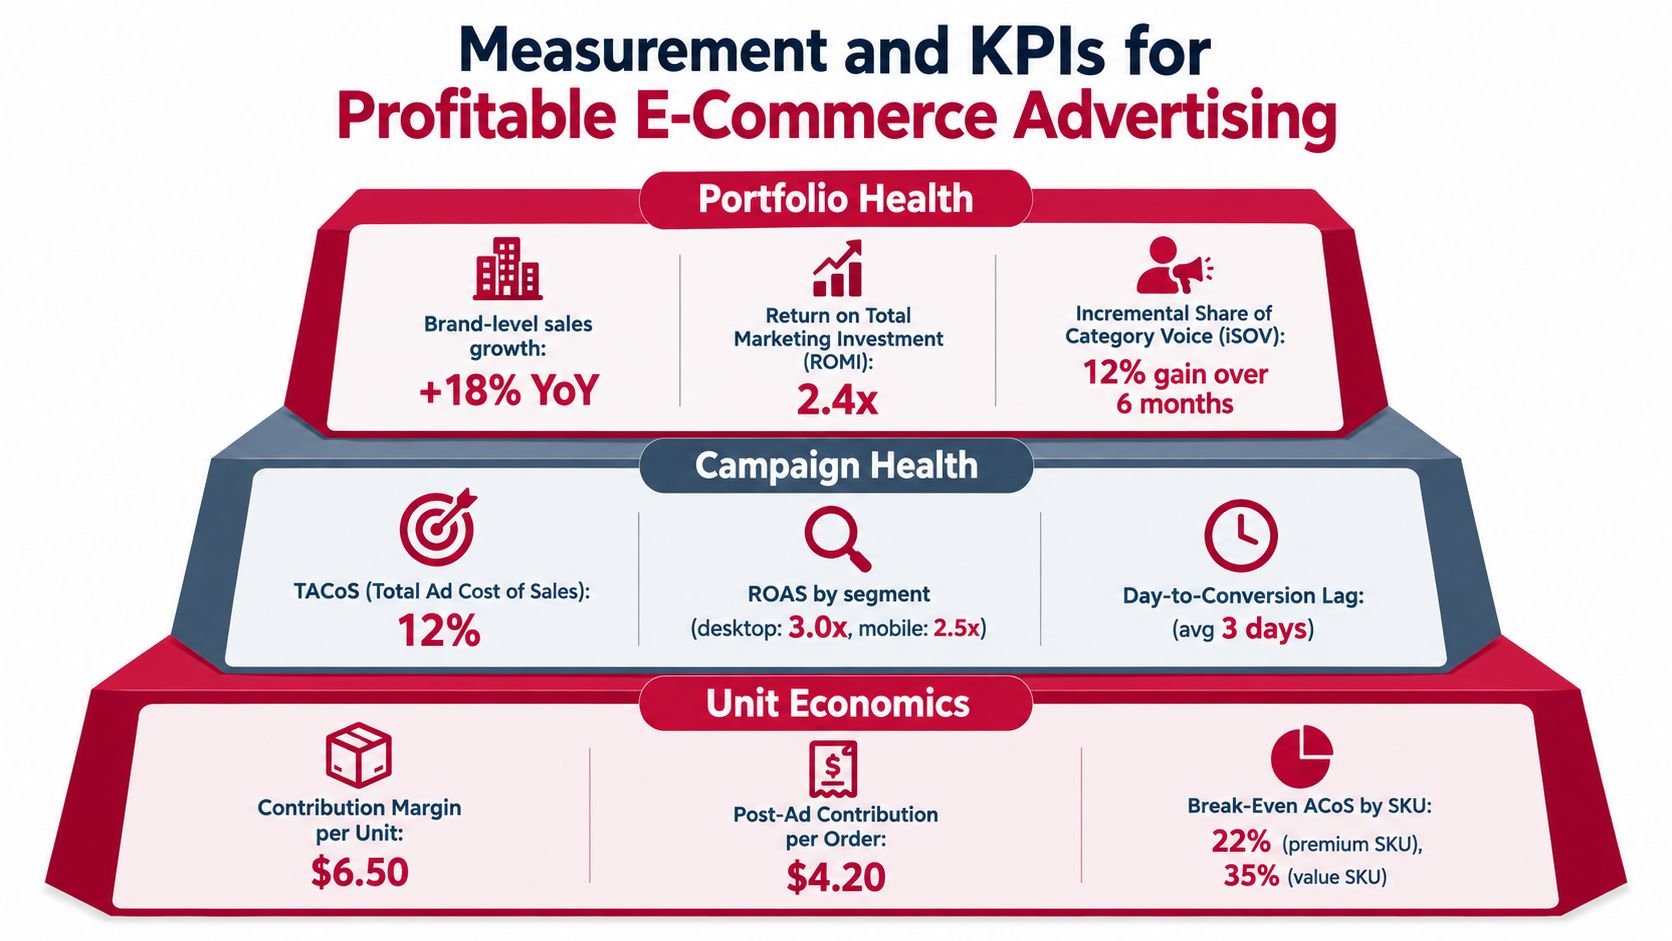
Use three layers:
If your team still reports ROAS without a profitability context, fix that first. A practical starting point is this breakdown of how to calculate return on ad spend, then pressure-test whether that return survives fee and inventory realities.
The market is heading toward significant growth. U.S. retail media is expected to reach $60 billion in 2025 and grow 20% that year, while offsite media is projected to grow 42% and account for roughly 20% of the retail media mix. Buyers rank transparency at 82%, performance at 76%, and measurement options at 75% among key evaluation criteria (Front Row retail media trend report). More surfaces mean more attribution noise, not less.
Use incrementality checks where possible. On Amazon, pause tests at the ASIN or campaign cluster level can show whether paid sales are mostly cannibalizing organic demand. On Google and Meta, controlled holdout thinking matters more than platform-reported credit.
A KPI is useful only if it helps you decide whether to scale, cut, or hold.
The best measurement systems don't celebrate impressions and clicks. They answer whether the next dollar is likely to return more than a dollar of contribution.
Creative isn't a brand layer that sits on top of performance. In e commerce advertising, creative is one of the fastest ways to improve or destroy margin.
Weak creative raises acquisition cost because it lowers click-through rate and sends lower-intent traffic into a page that has to work harder. Strong creative doesn't just get attention. It pre-qualifies the click, frames the offer properly, and sends the shopper to the right page for that promise.
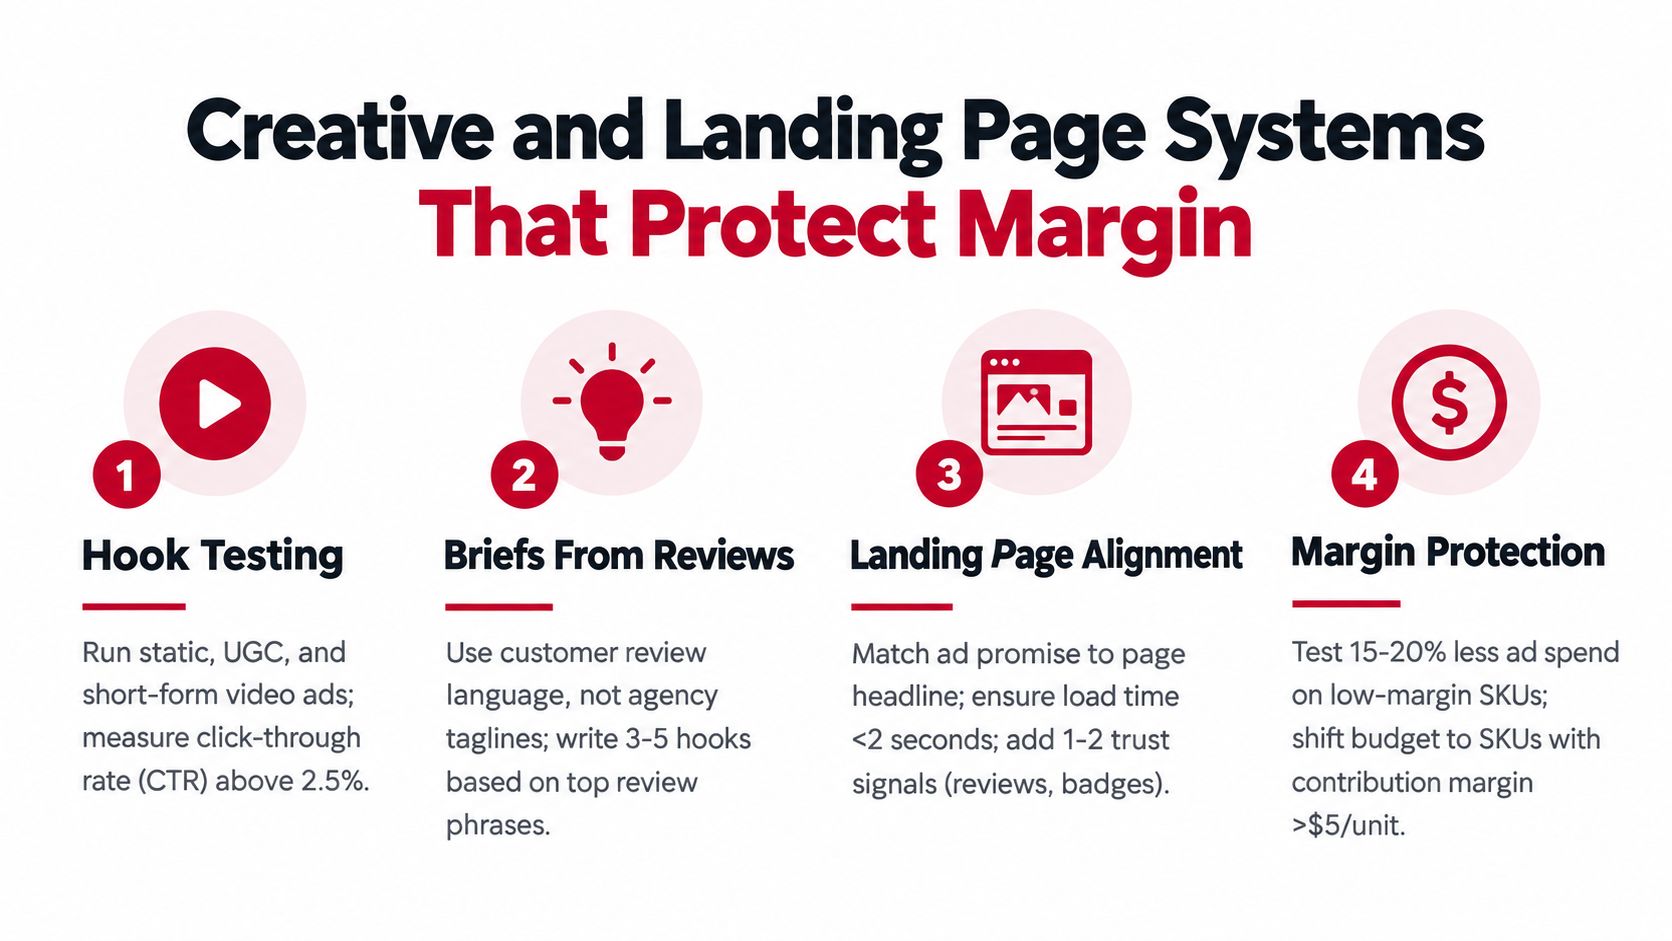
A lot of expensive ad creative fails because it sounds polished instead of useful. Customer reviews usually tell you what to say more clearly than a brainstorm does. Pull repeated phrases from reviews, support tickets, and Q&A. Those become hooks, objections, and proof points.
One reason this matters more now is that paid social execution is getting faster. Nielsen notes benchmark data showing ecommerce paid social spend rose 70% year over year in Q2 2026, while click-through rates rose 29% and cost per click fell 18% to $0.133, alongside broader pressure toward structured creative testing and first-party data activation (Nielsen on retail media attribution and creative testing). Surface efficiency can improve while bad creative decisions still wreck brand economics.
For teams in visually competitive categories, this piece on advertising skincare in South Africa is a useful example of how category messaging, trust, and offer framing shape conversion quality beyond just media buying.
Every ad concept should map to a specific PDP or landing page. Then audit that page like an operator:
A workable weekly cadence is simple. Test one new hook, refresh one middle section, and rotate one CTA or offer angle per audience cluster. That keeps the account learning without turning creative production into chaos.
Beautiful creative that doesn't convert efficiently is expensive branding. In a margin-tight catalog, you can't afford that confusion.
A SKU can hold a steady ACoS and still turn into a bad ad decision.
I have seen this on Amazon with a replenishable item that ranked well after a sponsored products push. Sales rose, ACoS stayed inside target, and the dashboard looked clean. Then the next finance review picked up the problem. The campaign accelerated volume into higher storage exposure, pushed more units through lower-margin pack configurations, and left too little contribution after fees and handling. The ad account showed efficiency. The SKU showed erosion.
That pattern is why risk review has to sit below platform metrics and above channel tactics. Once campaigns start scaling, the bigger threats are usually operational. Inventory timing, catalog structure, retail readiness, and channel interaction decide whether growth converts into cash or just into more work.
| Risk | Typical Channel | What to watch |
|---|---|---|
| Aged inventory and storage escalation | Amazon, Walmart | If ad-supported sell-through slips and units age past your internal threshold, cut spend on slow variants before storage fees and markdown pressure erase contribution |
| Branded search cannibalization | Run pause tests on brand campaigns when organic rank and retailer placement are already strong, especially during promo periods when search demand would convert anyway | |
| Creative fatigue | Meta, TikTok | Watch first-purchase CPA and hold rate by concept, not just blended account ROAS. If new-customer efficiency weakens for two to three weeks, the issue is usually creative throughput, not bidding |
| Stockouts from demand spikes | All channels | Pause or cap ads before in-stock position drops below your reorder safety window. Ranking recovery often costs more than the sales you squeezed out in the final days |
| Channel conflict on hero SKUs | Amazon, Walmart, DTC | A promoted hero item can lift marketplace volume while hurting DTC bundle mix or retailer relationships if pricing, pack size, or promo timing are misaligned |
One common failure pattern looks like this. Meta finds a winning hook. Amazon demand picks up through branded search and retargeting. The hero SKU sells fast, but the next inbound shipment is late, so the account pushes harder on substitute ASINs or less efficient bundles. Spend stays live because the blended top line still looks healthy. Contribution falls because the wrong products are now carrying the budget.
Creative fatigue deserves the same operational treatment. It is not just a media problem. If the team cannot ship fresh concepts on a regular cadence, paid social starts buying weaker traffic, remarketing takes a larger share, and acquisition quality slides before the dashboard makes the problem obvious.
The ad account reports momentum first. Operations and finance report the bill later.
A useful quarterly review pulls media, finance, and supply chain into the same decision. Which SKUs scaled into lower contribution because inventory aged or mix shifted? Which hero products need demand caps because lead times are too long? Which channel gets cut first if branded search is harvesting demand that Amazon or Walmart would have captured anyway?
That meeting is not about finding a better ROAS story. It is about deciding where advertising should slow down so contribution and inventory velocity stay intact.
If your e commerce advertising looks healthy in-platform but thin on the P&L, Reddog Consulting Group offers a free 30-minute working session focused on margin, marketplace performance, and growth planning. We'll look at your channel mix, SKU economics, and inventory pressure with a contribution-margin-first lens, then identify where spend can scale and where it needs to be tightened first.
Leave a comment: