
Published: March 2020 | Last Updated:October 2026
© Copyright 2026, Reddog Consulting Group.

The most popular Amazon ads optimization advice starts in the wrong place: lower your ACoS, raise bids on winners, and keep expanding keywords. Those tactics can improve the advertising dashboard while leaving a CPG brand with less cash after fulfillment, promotions, returns, and replenishment.
The better question is whether the next advertising dollar will create contribution profit you can keep. That requires connecting campaign decisions to product economics, available inventory, and demand that wouldn't have arrived without the ad.
ACoS doesn't lie mathematically. Operators misread it when they treat an efficiency ratio as a profitability verdict.
Amazon defines advertising cost of sales as ad spend divided by attributed advertising revenue. Its example of $2,000 in spend generating $10,000 in attributed sales produces 20% ACoS, but that calculation says nothing about the product's remaining contribution after variable costs, as explained in Amazon's campaign reporting documentation.
A low-margin single-pack and a healthier-margin bundle shouldn't share an advertising ceiling because they occupy the same category. The single-pack may convert beautifully and still leave too little money to fund another order.
ROAS has the same limitation viewed from the other direction: it compares attributed revenue with advertising spend, not profit with spend. For a plain-language refresher on that distinction, PlatformDTC's what is ROAS in ecommerce is a useful companion resource.
The operating question is more demanding: after paying for the product, marketplace fees, fulfillment, discounts, and expected returns, what remains to acquire the sale?
That concern isn't theoretical. A 2025 survey of nearly 1,500 Amazon sellers found that almost 40% of enterprise brands were concerned about profitability amid rising costs, including advertising and shipping, according to the Jungle Scout State of the Amazon Seller report.
Operating principle: An attractive advertising ratio isn't permission to scale a product with weak contribution economics.
A launch campaign can reasonably accept weaker immediate efficiency if the brand deliberately funds customer acquisition or tests demand. That's an investment decision with a defined spending limit, not evidence that margin no longer matters.
Conversely, branded traffic can produce excellent reported returns while capturing shoppers who already intended to buy. Replace the universal ACoS target with SKU-level contribution ceilings and objective-specific investment limits. Then judge each campaign against the job it's supposed to perform.
Start with the selling price realized, not the price displayed before coupons. Subtract landed product cost, referral fees, fulfillment, promotional funding, packaging costs where applicable, and a realistic return reserve.
The remainder is pre-ad contribution. It's the money available to pay for advertising and contribute toward fixed overhead and profit.
The calculation should remain visible wherever campaign targets are set.
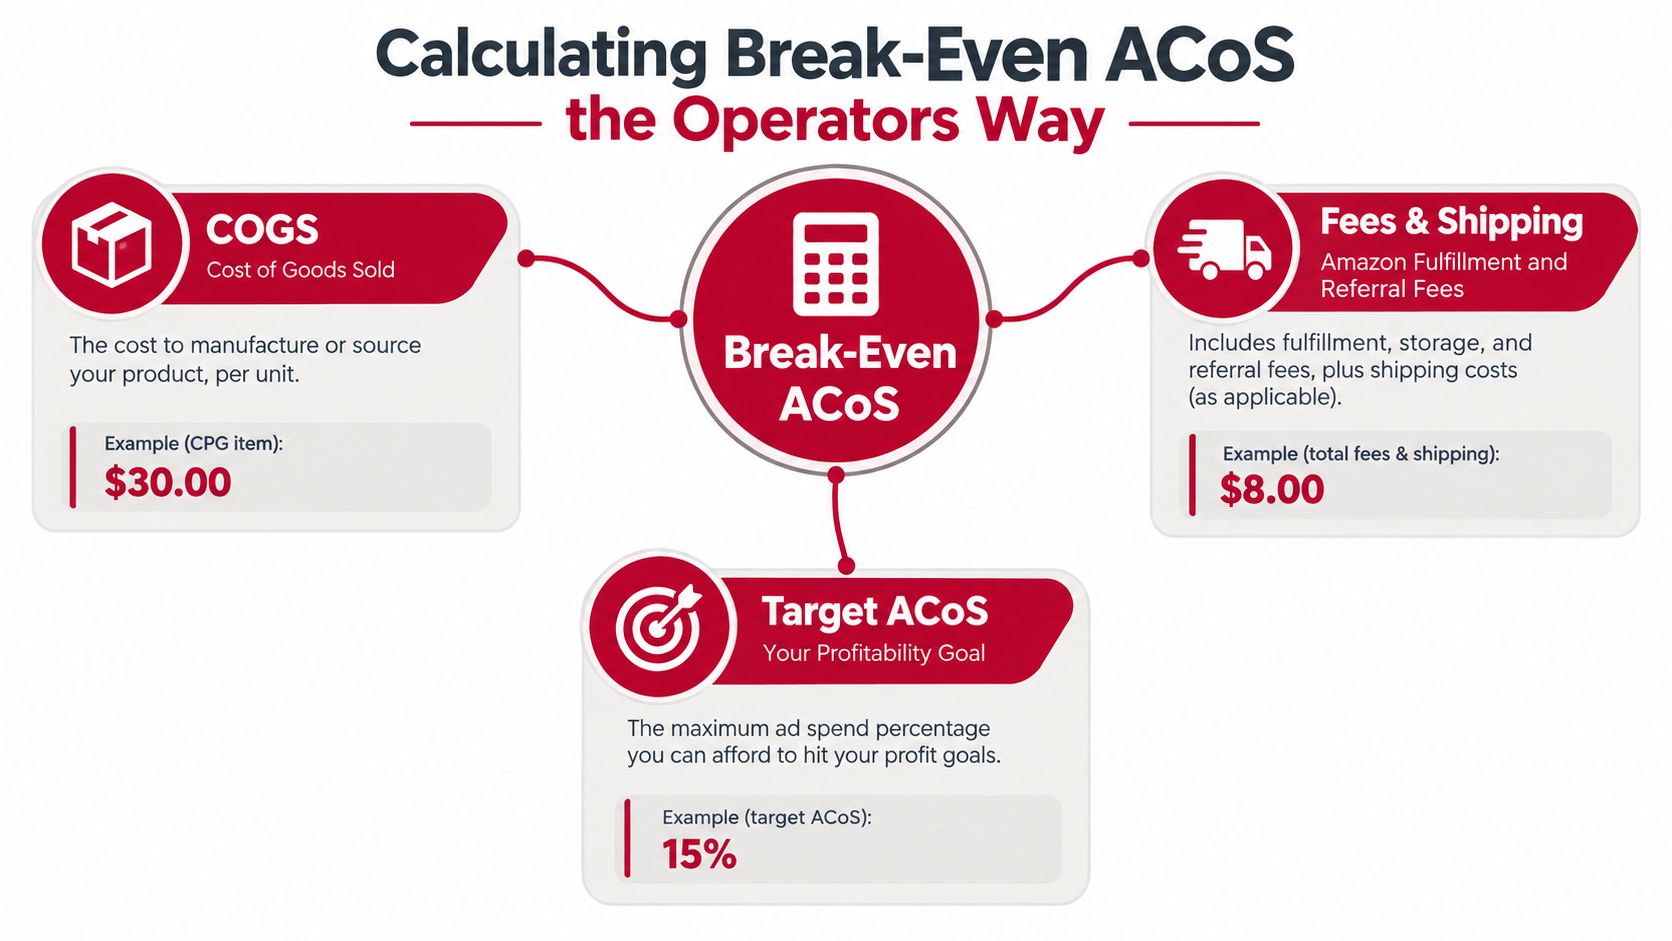
Break-even ACoS = pre-ad contribution per order ÷ selling price.
For example, a $30 CPG item leaving $9 after variable costs has a 30% break-even ACoS, using the same revenue denominator as the Amazon reporting calculation cited above. At that ceiling, the advertised order contributes nothing toward fixed overhead or operating profit.
A useful spreadsheet should contain these fields:
For a deeper explanation of which costs belong in the calculation, use RedDog's guide to what contribution margin means.
A snack sold at an entry price needs its own model. So does a higher-priced bundle: additional units, heavier shipping, packaging, and promotional exposure can consume the apparent advantage of a larger order.
Don't assume a sub-threshold price or larger pack automatically creates more advertising headroom. Calculate the complete offer economics before choosing a campaign ceiling.
Sponsored Products isn't an objective by itself. A harvesting campaign should normally protect current contribution. Branded defense needs a justified protection budget. Discovery needs an explicit learning allowance and a stopping rule.
Break-even is a boundary, not a recommended target. Brands that routinely spend right up to it leave themselves exposed when costs or conversion change.
An account becomes difficult to manage when a campaign contains products with different margins, lifecycle stages, and demand sources. The problem isn't untidy naming. It's that the operator can't change spending without affecting unrelated commercial objectives.
Structure should make budget ownership and performance interpretation straightforward. Excessive fragmentation can be just as unhelpful as putting everything together, particularly when each segment produces too little evidence to support a decision.
| Campaign objective | What belongs inside | What the structure protects |
|---|---|---|
| Harvest | Proven, relevant search demand | Profitable traffic from exploratory overspending |
| Defend | Branded queries and selected defensive targets | A visible, independently reviewed defense budget |
| Discover | Automatic, broad, phrase, and exploratory product targeting | A bounded testing allowance |
This separation doesn't eliminate overlapping demand. It makes overlap easier to identify and prevents strong branded performance from disguising weak non-branded acquisition.
Group products only when their economics and operating conditions are sufficiently similar. Separate a launch SKU from an established replenishment item, even if shoppers use similar queries. Their spending permissions are different.
A dedicated campaign or ad group can help isolate a SKU or match type. But splitting every possible dimension creates administrative work without necessarily improving decisions.
Treat placement as a reporting and adjustment dimension rather than assuming each placement requires its own campaign. Add segmentation when it gives the operator a distinct budget, bidding policy, or profitability interpretation.
For a cross-platform reference when discussing account design with a broader paid-media team, Wojo Media's Google Ads bidding and structure guide provides adjacent reading. Amazon decisions still need marketplace-specific economics rather than borrowed search-engine assumptions.
Use consistent names containing the product family, objective, targeting approach, and lifecycle status. Keep a change log showing why a campaign was created, restricted, or retired.
Archive obsolete activity rather than rebuilding without its history. The practical goal is traceability: another operator should be able to understand what a campaign buys, why it exists, and what would justify changing it.
Discovery should buy evidence, not unlimited exposure. Start with tightly budgeted automatic campaigns and broad or phrase groups, then assess actual shopper queries against relevance and allowable acquisition cost.
A 60–90-day query-level review window can help establish context, while avoiding universal performance targets. The Hector AI Amazon advertising benchmark guide also cautions that category, marketplace, period, and account mix make broad benchmarks unreliable.
Use a repeatable process to classify the evidence.
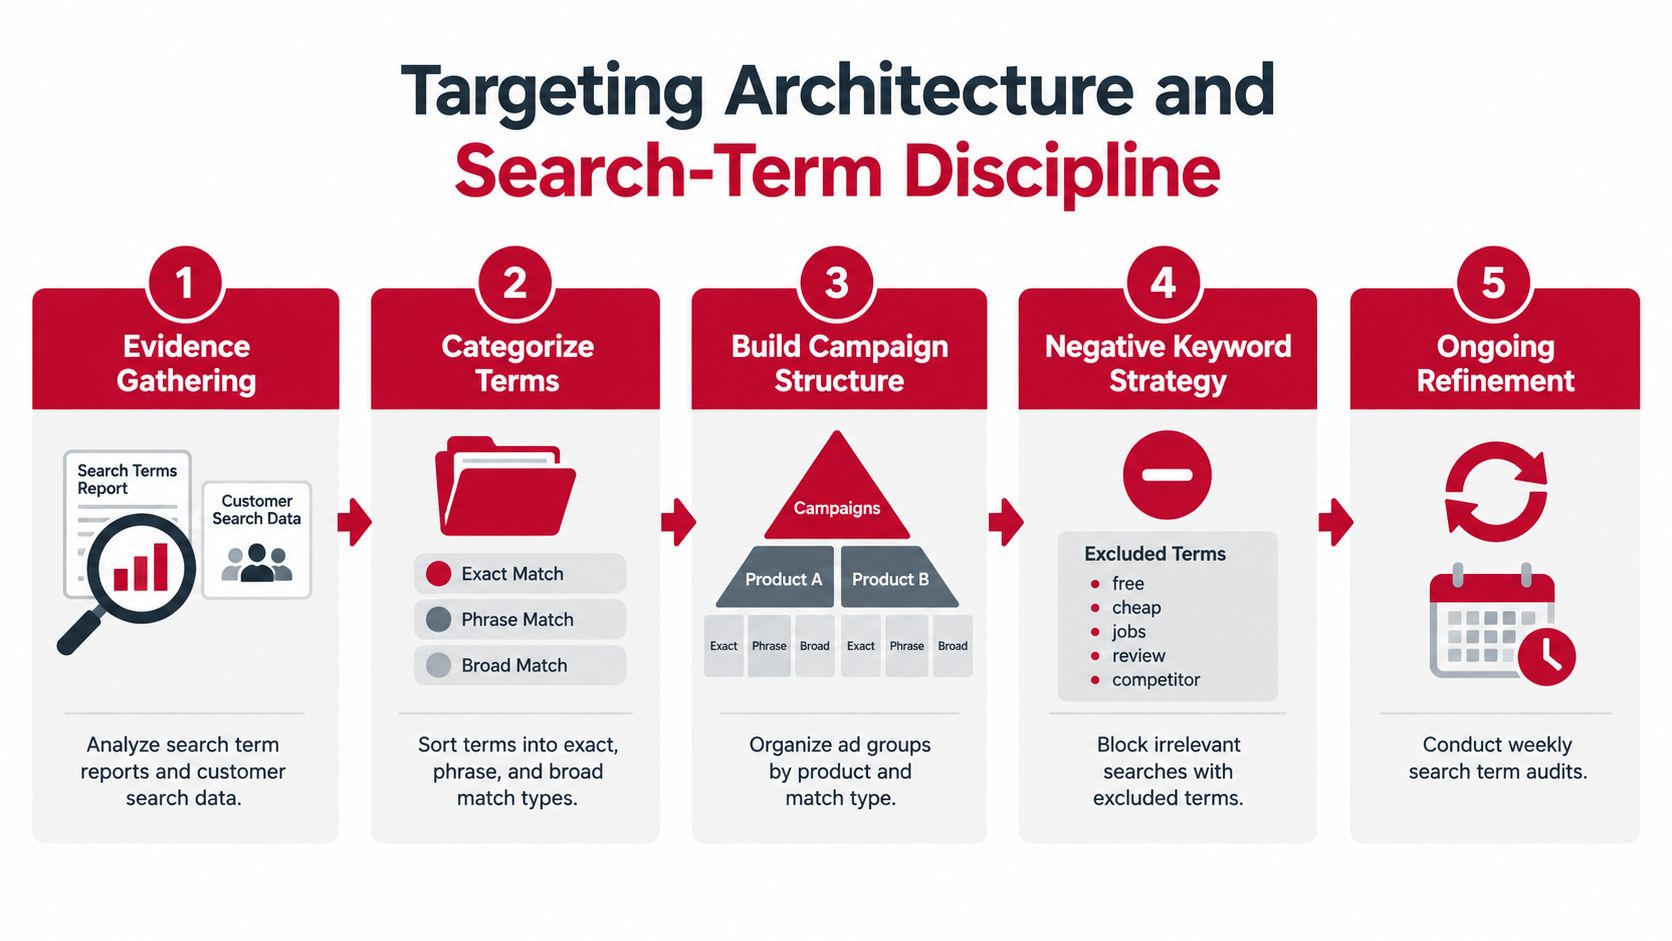
Move relevant, converting queries into exact-match harvesting with dedicated budget ownership. A conversion alone isn't enough: check whether the order fits the SKU's acquisition allowance.
Keep discovery active at lower bids when it continues producing useful incremental queries. Where deliberate routing is needed, use carefully scoped negatives so discovery doesn't keep absorbing demand assigned to harvesting.
Maintain a negative-keyword library, but don't apply it blindly across products. A query that's wrong for a snack bag may fit a variety bundle.
Weak click-through rate points toward relevance, the main image, title, or price. Reasonable engagement followed by weak conversion calls for a detail-page and offer review before more bidding.
For creative teams working across channels, Bulk Image Generation's practical social ad optimization guide is adjacent reading, not a substitute for Amazon search-term evidence.
Competitor product targeting deserves its own test. Compare the advertised offer's price, pack size, positioning, and retail readiness with the product shoppers are already viewing. A competitor ASIN isn't automatically valuable traffic.
Use the accompanying video as an additional targeting resource.
The weekly motion is simple: collect queries, classify intent, graduate profitable demand, and prune waste. Don't change targeting, creative, and price simultaneously if you need to understand which change improved performance.
A bid is permission to enter an auction, not a promise of a profitable customer. Once targeting is clean, choose bidding settings according to how much discretion the campaign can safely tolerate.
Fixed bids offer direct control over the chosen bid. Dynamic down-only bidding suits cautious discovery or tighter acquisition limits. Dynamic up-and-down deserves more scrutiny because allowing increases can expose the campaign to more expensive traffic, even when conversion likelihood looks attractive.
The following illustrative monthly profile uses 1,000 clicks, a $2 maximum bid, 80 orders, and a $25 selling price. At $2 CPC, spend and attributed sales are both $2,000, producing 100% ACoS; at $1.25 CPC with orders maintained, spend is $1,250 and ACoS is 62.5%, using the auction and cost example described in Amazon's advertising FAQ. These are arithmetic scenarios, not measured outcomes promised by particular bidding modes.
Bid strategy outcomes on the same monthly traffic profile
| Bid strategy | Average CPC | Ad spend | Attributed sales | ACOS | Margin note |
|---|---|---|---|---|---|
| Fixed bidding at the higher realized CPC | $2 | $2,000 | $2,000 | 100% | Advertising consumes all attributed revenue before product costs |
| Lower-bid or down-only policy achieving the illustrated lower CPC | $1.25 | $1,250 | $2,000 | 62.5% | Lower spend helps, but profitability still depends on contribution |
| Dynamic up-and-down or rule-based expansion | Not assumed | Not assumed | Not assumed | Not assumed | Requires observed results; settings alone don't establish an outcome |
Raise top-of-search or product-page multipliers only after base keyword performance is stable. Review the placement's observed conversion and acquisition cost rather than assuming premium visibility deserves premium spending.
A strong account average can conceal an expensive placement. Where the reporting supports it, isolate the placement's economics before increasing exposure.
A higher probability of conversion doesn't necessarily mean a higher probability of profit.
Set a ceiling that accounts for bidding adjustments, not just the displayed base bid. Define a minimum useful exposure level too: reducing every bid until the campaign barely serves can stop learning without solving the underlying offer problem.
Rule-based automation should execute a bounded policy, not invent the commercial objective. Require enough click evidence before routine changes, and reserve immediate intervention for clear irrelevance, broken retail readiness, or spending outside approved limits.
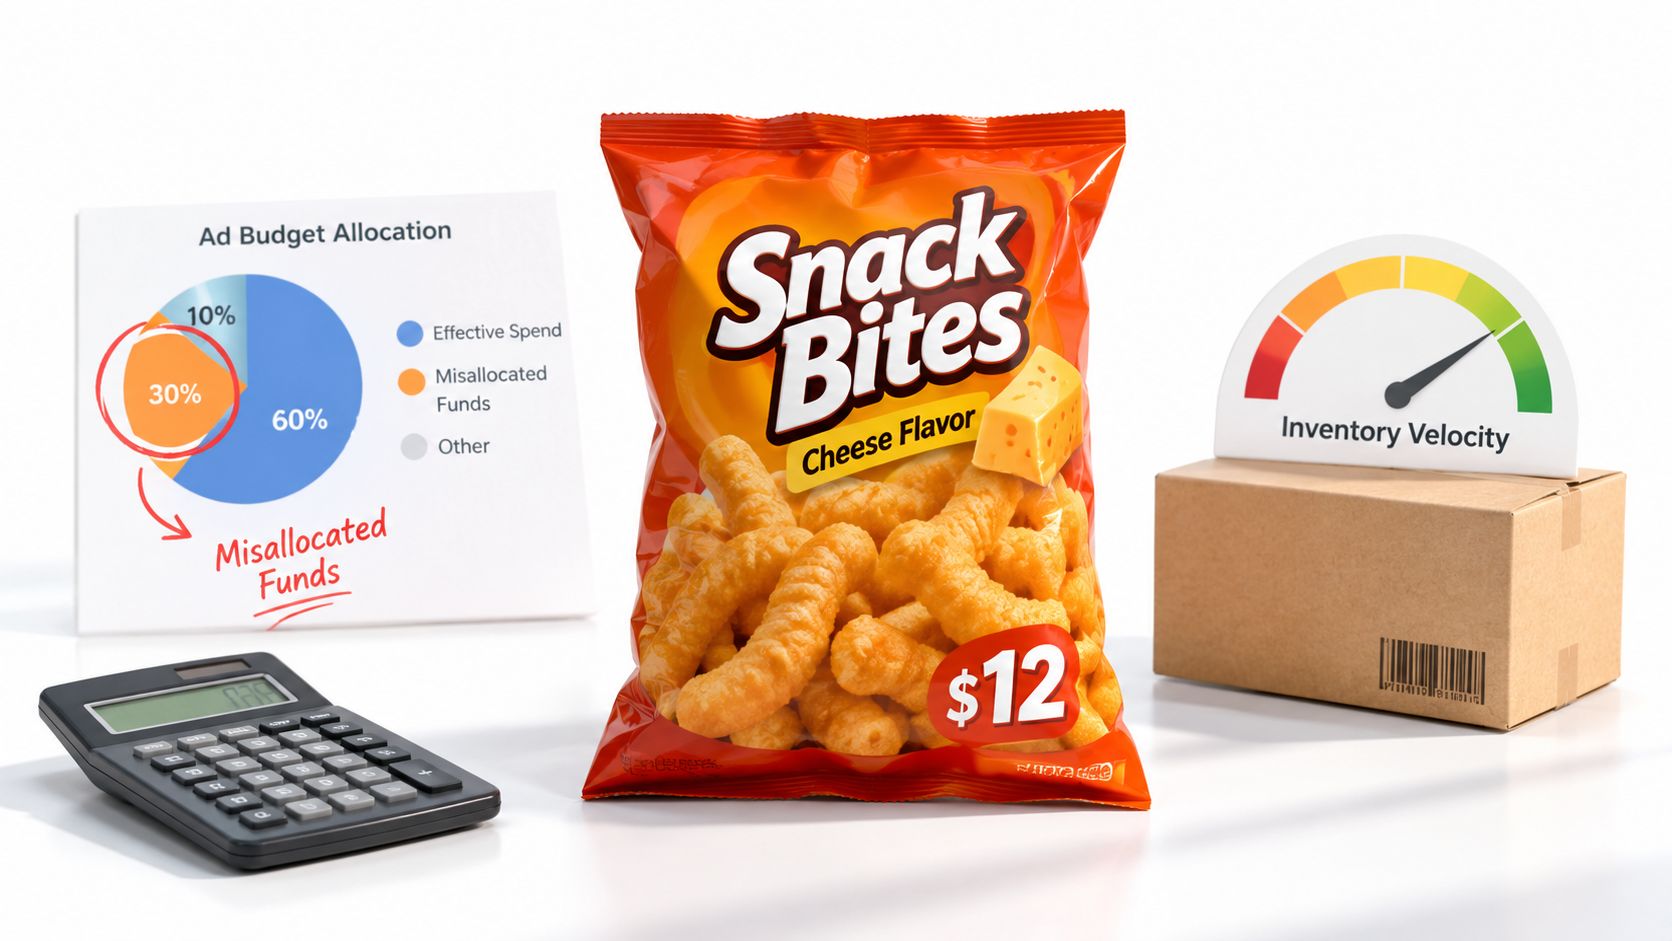
Consider a hypothetical snack SKU whose advertising performance hasn't changed, but whose economics have. The operator shouldn't wait for the campaign report to deteriorate before revising spending permissions.
For a $12 item with $2.50 in pre-ad contribution, an $0.08 fulfillment-fee increase consumes 3.2% of contribution and moves break-even ACoS from 20.8% to roughly 20.2%, if other costs stay unchanged. That illustrates the margin effect of Amazon's published 2026 FBA fee schedule.
The advertising review needs these operating inputs alongside campaign data.
Amazon states that products priced below $10 receive Low Price FBA rates $0.86 lower than rates above $10. In an illustrative move from $10.49 to $9.99, the seller gives up $0.50 in selling price before considering other effects, so the fulfillment saving alone doesn't settle the decision; see Amazon's Low Price FBA guidance.
Model the revised contribution before discounting. If the offer changes, update relevant creative and listing content, but avoid unrelated creative rotation that makes the pricing test harder to interpret.
Amazon treats inventory with more than 90 days of forecasted supply as economically excess and compares the costs of leaving it idle with actions such as markdowns or removal in its Inventory Performance Index guidance.
Budget mechanics matter too. Amazon illustrates that a $100 daily budget can deliver $3,100 during a 31-day month, so daily caps need a monthly cash plan, as explained in Amazon's bidding and budget guidance.
Lower caps when reducing exposure is sufficient. Pause when the offer can't responsibly receive traffic. Budget is a channel allocation decision, not merely a campaign setting.
Attributed sales show where Amazon assigned credit. They don't prove which orders advertising created.
Branded search, organic demand, DSP exposure, coupons, promotions, and external traffic can overlap. Amazon's Multi-Touch Attribution research describes using randomized controlled experiments and machine-learning models to allocate credit across touchpoints, reinforcing why an attribution report shouldn't be treated as a causal answer.
Track advertising efficiency alongside total-business efficiency. TACoS compares advertising spend with total Amazon revenue, while organic share and new-to-brand reporting, where available, provide additional context about demand composition.
None of those measures independently proves incrementality. Together with SKU contribution and inventory cover, they give the operator a more useful basis for choosing what to test or restrict.
Use a checklist to keep the operating review consistent.
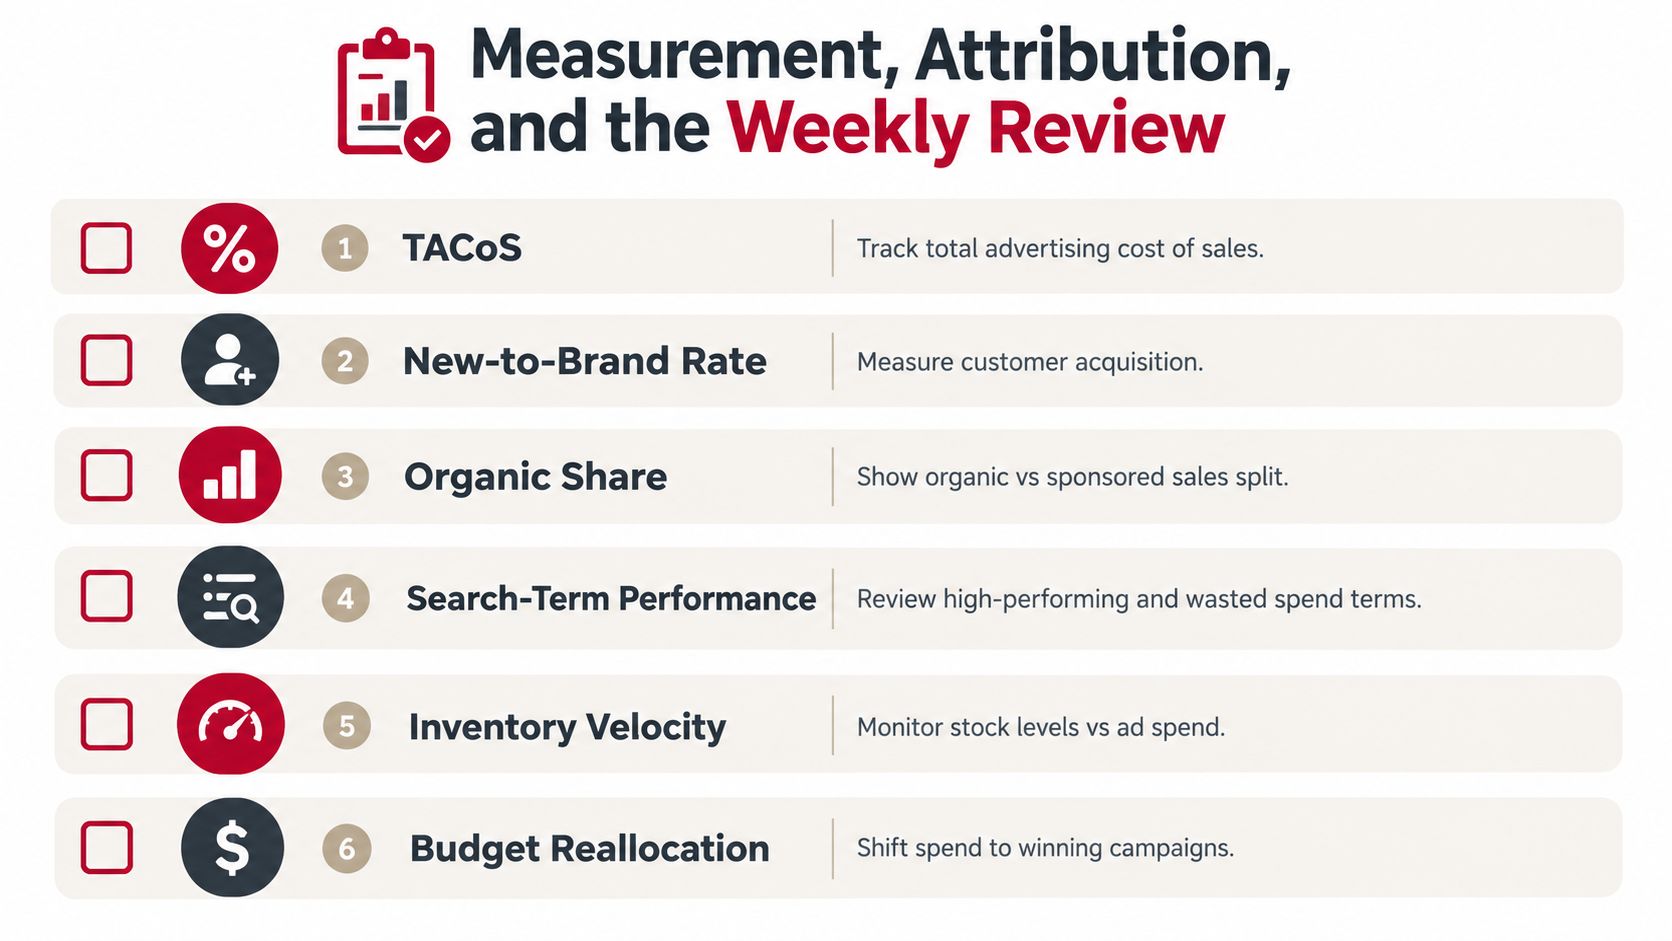
Weekly Amazon ads review template
| Metric | What it tells you | Decision trigger |
|---|---|---|
| Impressions and CTR | Exposure and shopper response | Investigate relevance or limited delivery |
| CPC | Cost of purchased traffic | Reassess bidding against acquisition allowance |
| Detail-page conversion | Ability of the offer to close traffic | Inspect content, price, availability, and offer quality |
| Orders and advertising sales | Attributed volume | Check whether volume leaves contribution |
| ACoS | Paid revenue efficiency | Compare with the objective's approved ceiling |
| TACoS and organic share | Paid dependence within total sales | Investigate diverging paid and business trends |
| New-to-brand rate, where available | Reported customer acquisition mix | Test whether acquisition funding remains justified |
| Contribution profit per SKU | Money retained after variable costs and ads | Restrict campaigns that erode operating contribution |
| Inventory weeks of cover | Capacity to support demand | Coordinate spending with replenishment |
| Campaign decision | The action and its rationale | Assign an owner and record the change |
Audience or geographic holdouts can be useful where the media setup supports them. Smaller accounts may need carefully controlled pre/post tests instead, with promotions, pricing, and stock availability documented so those changes aren't mistaken for advertising effects.
Sparse traffic and incomplete event data limit what any test can establish. RedDog's explanation of revenue attribution provides context for separating assigned credit from commercial impact.
Review discipline: Reduce spend despite strong conversion when the marginal sale lacks contribution, replaces likely organic demand, or threatens supply.
RedDog's Foundation → Optimization → Amplification framework makes that sequence operational. Foundation establishes economics and account structure; Optimization governs targeting, bids, and budgets; Amplification expands only the products whose profit and supply can withstand additional demand.
Reddog Consulting Group offers Amazon advertising management connected to pricing, contribution margin, and inventory planning. Qualified CPG founders and operators can book a free 30-minute Amazon ads margin review, a working session to examine SKU economics, budget allocation, and the constraints on profitable marketplace growth.
Leave a comment: