
Published: March 2020 | Last Updated:October 2026
© Copyright 2026, Reddog Consulting Group.

You've just watched an Amazon repricer lift a product's price. Sales look steady, but conversion has softened, ad spend is working harder, and the margin report is worse than the revenue dashboard suggests. Meanwhile, Walmart has inventory aging, DTC is paying for every new visit, and the next purchase order is already in motion.
That's the operator's problem with dynamic pricing optimization. A price change isn't an isolated marketplace action. It affects contribution margin, inventory velocity, fulfillment expense, customer trust, and the economics of every channel selling the same product. The job isn't to change prices more often. It's to choose a price and inventory action that improves the business after the costs and consequences are counted.
A repricer can raise a price because a competitor went out of stock. That might look sensible in a marketplace dashboard. But if conversion drops, the brand may need more advertising to maintain sales, and the extra margin per unit can disappear into higher acquisition costs or reduced volume. Revenue can remain stable while contribution dollars decline.
Before automating a price change, answer three questions: What's the contribution floor for this SKU? How much inventory is exposed in each channel, including inbound and aging units? And what will a higher or lower price do to net profit after marketplace fees, advertising, fulfillment, and returns?
Those questions matter especially for smaller omnichannel brands. An enterprise retailer may have deep historical data and dedicated pricing teams; a growth-stage CPG operator often has to reconcile marketplace reports, purchase orders, advertising costs, and distributor economics by hand. A rule based only on competitor prices can't see whether Amazon inventory is tight, Walmart stock is aging, or DTC demand depends on a promotion.
The right decision can be a price decrease. A lower price may generate enough additional demand to improve sell-through or reduce exposure to a future markdown. A higher price may make sense when inventory is constrained and customers are less sensitive to price. Neither outcome is a win by itself. What matters is whether the change improves expected contribution profit without creating a larger cost elsewhere.
Brands in categories where product attributes and consumer expectations shape willingness to pay can also benefit from more precise margin analysis. For example, Wine Labs offers a resource to understand fine wine price margins, an approach that highlights why a price should be judged against product economics rather than the shelf number alone.
Dynamic pricing without guardrails is expensive guesswork. Set a SKU-level minimum contribution margin, decide what inventory exposure justifies action, and make sure the price engine can account for the costs of selling through each channel.
Dynamic pricing didn't begin with online repricers. It grew out of airline yield management, where airlines had a fixed number of seats and needed to decide which fares to make available as demand changed. The inputs included demand forecasts, booking pace, remaining capacity, customer segments, and time until departure. American Airlines' historical development offers an early example: Littlewood formulated a two-fare-class problem for a single flight leg in 1972, and American had fully implemented DINAMO by 1988, integrating overbooking, discounted-seat allocation, and traffic management in one optimizer. Research reports that improved yield-management methods increased American Airlines' revenue by 5% in 1992, equivalent to approximately $1.4 billion over three years (historical research on airline yield management).
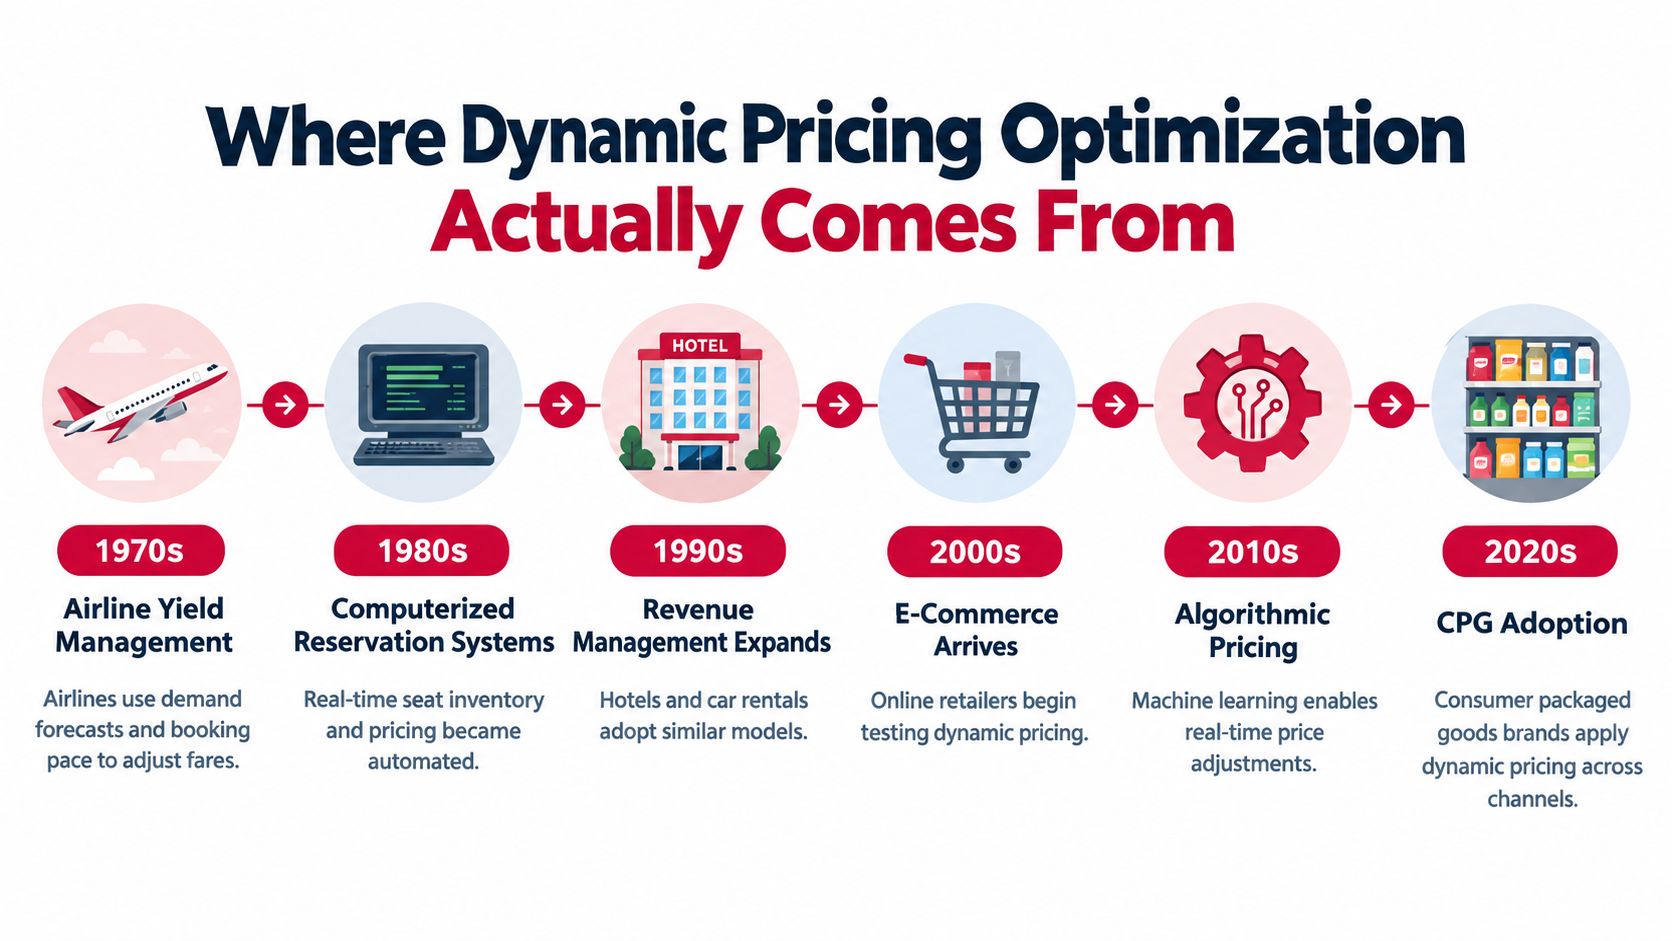
For a CPG brand, the scarce resource might be sellable inventory, fulfillment capacity, or margin available after channel costs. The comparable inputs are channel-specific demand, stock position, competitive prices, promotional lift, fulfillment costs, and contribution margin. A pricing system should evaluate which combination of price, promotion, and inventory allocation best serves the business under uncertain demand.
That distinction separates optimization from automated price movement. A tool that reacts to a competitor's price may help maintain a position, but it isn't necessarily maximizing the brand's expected contribution. If a competitor cuts price while your own inventory is low and replenishment is delayed, matching the price could increase the chance of a stockout and leave profitable demand unserved.
Transaction history gives operators the evidence to improve decisions. Compare actual sales with the forecast, then adjust availability, price, or promotion based on the gap. Airline yield management demonstrates the durable principle: optimization means making a better decision about limited capacity as new demand information arrives. For CPG, that means managing price and inventory together, not treating frequent price changes as the objective.
A price engine needs more than a competitor feed. It needs enough information to estimate customer response, understand inventory pressure, calculate unit economics, and distinguish one channel's profit from another's.
Elasticity is a starting point, not a portfolio-wide answer. A reported panel study of 89 U.S. online retailers over 36 months estimated aggregate price elasticity at -1.34, with category estimates of approximately -1.72 for electronics and -0.89 for fashion (study on dynamic pricing and online retail). The practical lesson for CPG is to estimate response by SKU and channel where possible. A single average can hide a product that loses too much volume after a price increase alongside another that can absorb one.
Velocity tells you how urgently inventory needs attention. Weeks of cover, daily units sold, inbound stock, and aging exposure help distinguish a healthy price increase from a move that risks slowing an already sluggish SKU. Forecasting is part of this work, and a useful primer on how to forecast demand can help teams connect demand expectations to inventory decisions.
Cost means the full cost to serve, not just product cost. Include marketplace fees, fulfillment, storage, advertising, returns, discounts, and relevant shipping or handling expenses. The contribution floor should reflect the actual channel in which the item sells.
| Input | What It Measures | Example or Range |
|---|---|---|
| Elasticity | How demand responds to price by product and channel | Use SKU-level estimates where available, and avoid treating the reported category variation as a CPG forecast |
| Velocity | How quickly available stock sells and how much cover remains | Compare units sold with on-hand and inbound inventory before choosing a price action |
| Cost | Contribution after the expenses required to make and fulfill the sale | Set a price floor after fees, fulfillment, storage, advertising, and returns |
| Channel economics | What the same product contributes across Amazon, Walmart, DTC, and wholesale | A price that works on DTC may fail on a marketplace after fulfillment and advertising costs |
The final input is channel economics. Amazon, Walmart, DTC, and wholesale can each produce different net contribution for the same SKU. The engine should use channel-specific costs and inventory, not an average margin that obscures where profit is earned.
Operator's check: If a proposed price can't be evaluated against elasticity, velocity, full cost, and channel contribution, it isn't ready for automation.
A single repricing rule across Amazon, Walmart, and DTC ignores how each channel charges for fulfillment and reaches customers. A price that protects Amazon's contribution may be wrong for Walmart inventory with storage exposure, while DTC can avoid marketplace fulfillment fees but still carry shipping, returns, and paid acquisition costs. Competitive analysis can help identify the market context, but competitive pricing intelligence shouldn't replace a channel-level profit calculation.
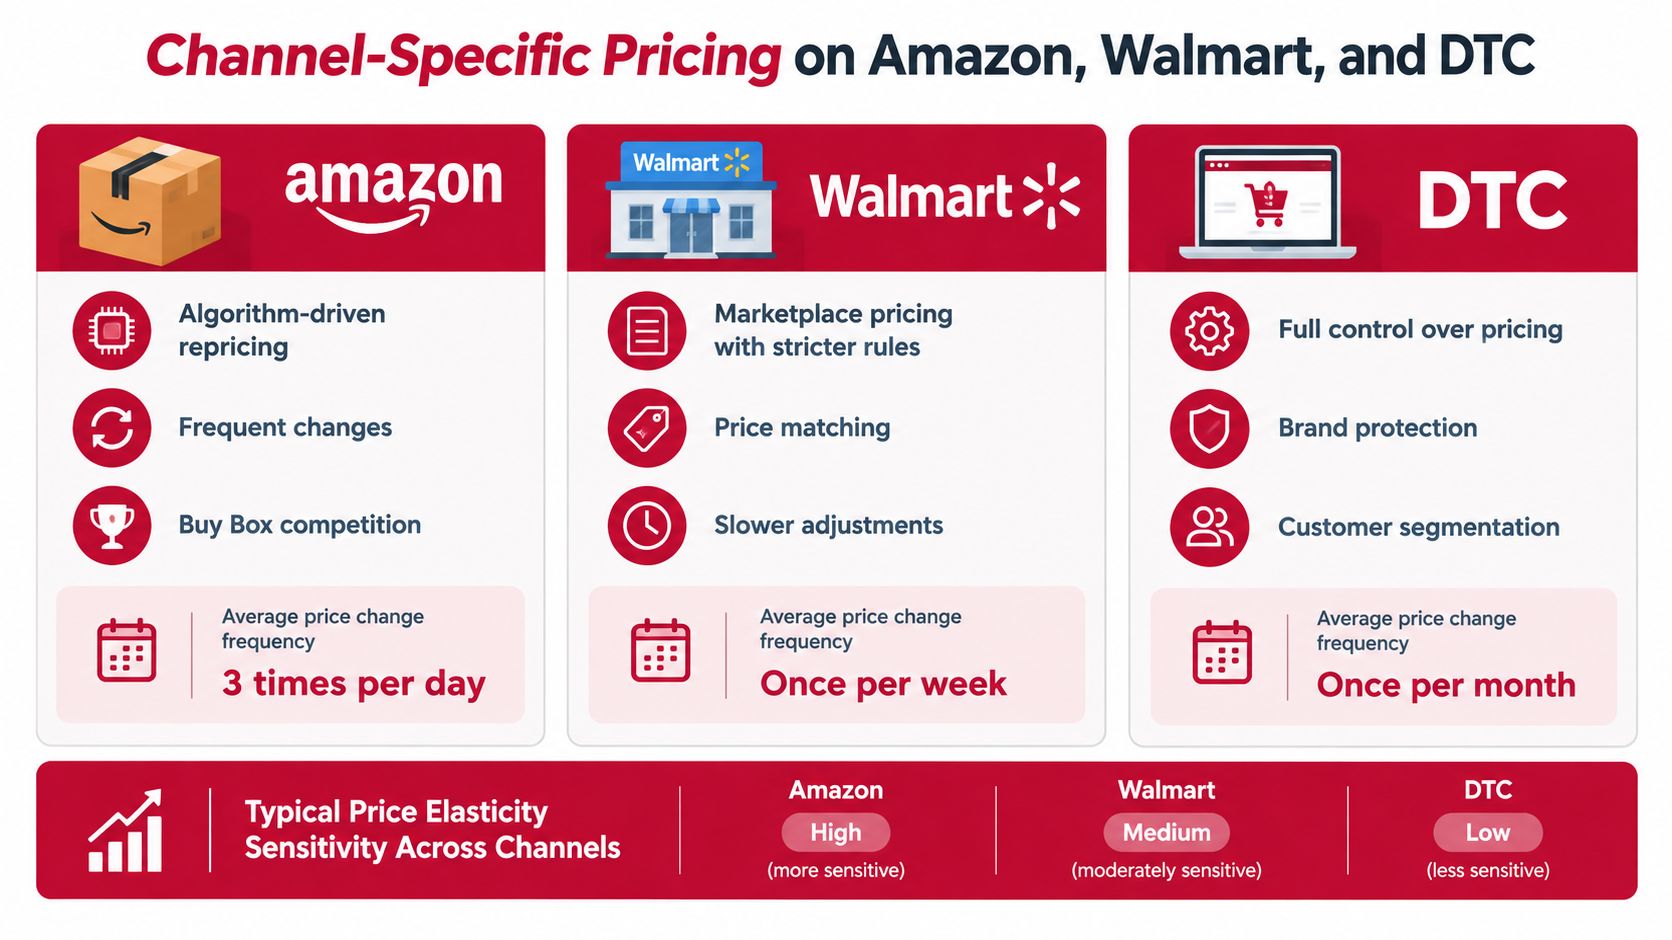
Amazon's published U.S. fee schedule says average FBA fees increase by $0.08 per unit sold, or less than 0.5% of the average item's selling price, with most changes generally effective January 15, 2026 (Amazon's published FBA fee schedule). For a $12 item, that average increase represents 0.67% of selling price before advertising, returns, discounts, and product-cost changes. A brand selling 100,000 units annually would absorb approximately $8,000 in additional fulfillment cost if its products tracked the average increase. The point isn't to apply that average blindly to every SKU; it's to recheck price floors when marketplace costs change.
Amazon also charges FBA storage by cubic feet occupied in its fulfillment network, with seasonal variation and potentially higher rates in holiday months (Amazon's FBA storage-cost guide). When inventory moves slowly, a price designed only to protect unit margin can increase storage exposure and tie up cash.
Walmart's WFS schedule lists a $3.45 base fulfillment fee for standard items weighing 1 pound or less, and storage at $0.75 per cubic foot per month from January through September. In October through December, inventory stored for up to 30 days remains at that rate, while inventory stored longer than 30 days incurs an additional $1.50 per cubic foot per month. For an item occupying 0.10 cubic feet, the extra peak-period charge is $0.15 per unit per month after that threshold (Walmart's WFS fee schedule).
Walmart calculates storage volume by multiplying package length, width, and height in inches, then dividing by 1,728. A 12 × 8 × 6-inch package occupies about 0.333 cubic feet, or roughly $0.25 per unit per month at the stated base rate. Reducing it to 10 × 7 × 5 inches brings volume to about 0.203 cubic feet and storage to roughly $0.15 per unit per month, a saving of about $0.10 per unit per month. Across 20,000 units held for three months, that would be approximately $6,000 in avoided storage cost before considering trade-offs such as damage, pallet efficiency, or customer perception (Walmart's pricing and volume guidance).
DTC gives a brand more control over price and customer communication, but shipping, returns, and paid acquisition can absorb the difference. Set a separate contribution floor for each channel, then account for inventory and fulfillment before adjusting price.
Start with the economics, not the software. A repricer can execute rules quickly, but it can't rescue a brand that hasn't defined the costs the rules must protect.
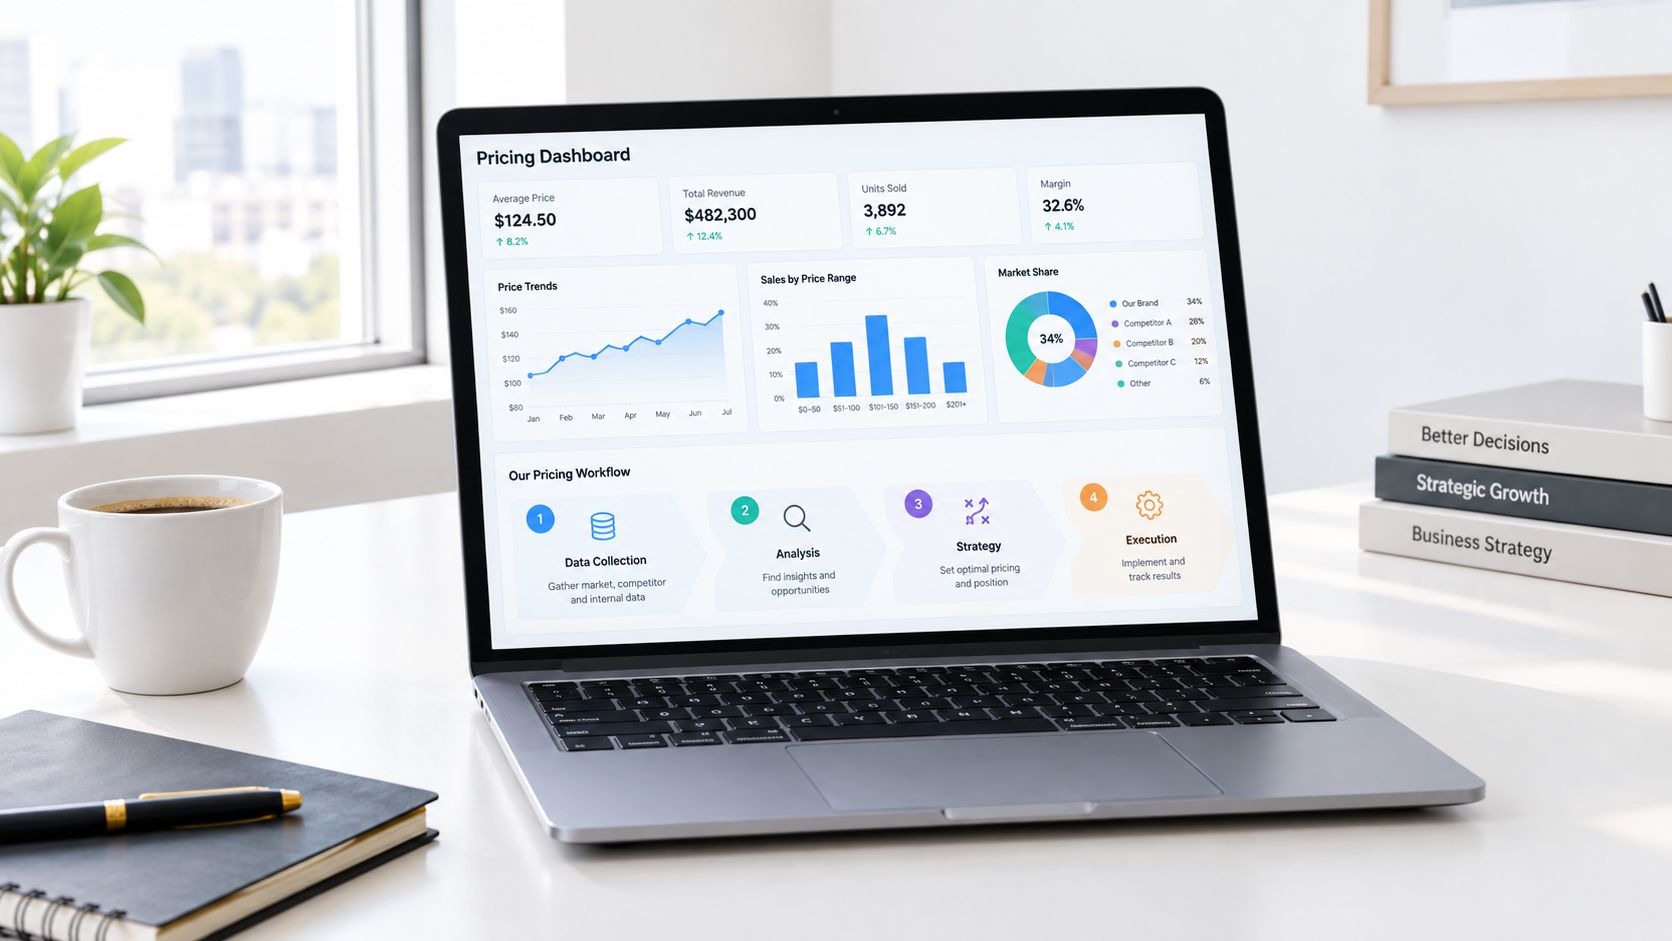
Foundation means establishing the economics for each SKU and channel. Bring landed product cost, marketplace fees, pick-pack, storage, returns, advertising allocation, and expected discounts into one view. Set a minimum contribution floor before letting any system change the price.
Optimization adds the decision rules. Use elasticity estimates, weeks of cover, channel inventory, and fulfillment costs to determine when a price change is justified. Include inventory shadow cost: the value of keeping a scarce unit available for a more profitable channel or future demand. A broader look at increasing restaurant profits can also offer a useful comparison for businesses balancing price decisions against per-order operating costs (10Seat's guide to increasing restaurant profits).
Amplification comes after the first two stages are working. Advertising, promotions, and channel expansion can compound a healthy SKU's performance, but scaling demand before confirming margin and availability can make a weak unit model more expensive.
Take a SKU selling for $20 with $4 contribution before storage. A 10% price reduction cuts contribution by $2 per unit before accounting for demand response. It's only justified if the added velocity is valuable enough to reduce aged inventory, improve cash recovery, or avoid a larger future markdown. The decision should use expected contribution across the affected inventory, not the lower price's conversion rate alone.
This walkthrough shows the operating sequence in practice:
Then set controls the pricing system can't override. Document minimum advertised price constraints, cap price-change frequency, and define acceptable deviation from a reference price. Review a weekly SKU view with price, units per day, weeks of cover, storage exposure, advertising spend, and contribution dollars. Keep the rollout narrow enough that operators can verify the inputs and explain unexpected results before extending the rules.
A more aggressive pricing algorithm isn't automatically a better one. A 2025 peer-reviewed study found that algorithmic dynamic pricing reduced consumer trust and increased the time consumers spent searching for prices. The negative trust effect weakened as shoppers became accustomed to the practice, and price-matching communication helped rebuild confidence (study on dynamic pricing and consumer responses).
That matters to CPG brands because customers don't always see Amazon, Walmart, and DTC prices as separate decisions. They see one brand. If the same product has inconsistent prices across channels, shoppers may question the difference, and wholesale or retail partners may object to an online price that undercuts their economics. A short-term marketplace gain can become a trust or channel-relations cost.
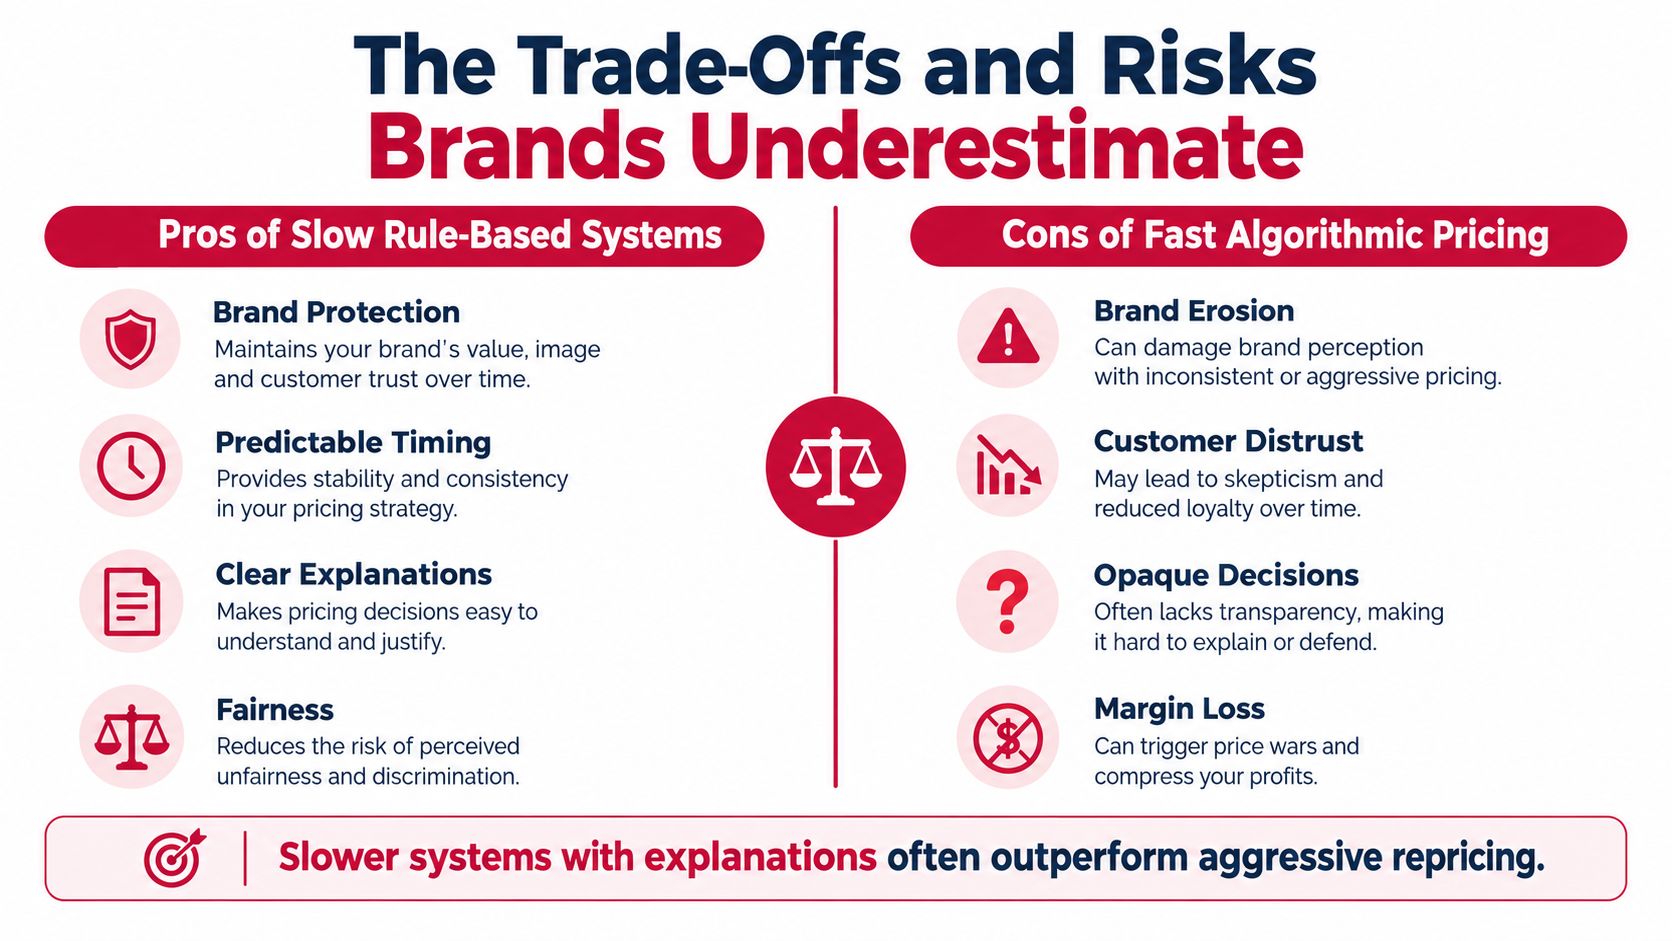
For many smaller brands, a slower rule-based system is easier to govern than an opaque model that changes prices rapidly. Set clear price bands, establish who approves exceptions, and use customer behavior rather than sensitive traits to shape any segmentation. Check MAP obligations and retailer agreements before changing channel prices.
Trust-adjusted contribution margin means accounting for more than the immediate sale. Watch repeat purchase, customer-service contacts related to price, price-search behavior, and movement between channels. Use holdout tests to compare the price change with a group that didn't receive it, and judge the result over a useful period rather than on the day of the adjustment.
The operational risk is just as important. A price test can change demand while purchase orders, lead times, and inventory allocation remain fixed. A discount may drive volume into a channel that can't fulfill it efficiently; a price increase may slow velocity while storage exposure continues. The right amount of price variability is the amount that improves contribution without undermining customer confidence, retention, or partner relationships. There isn't a universal frequency that fits every SKU.
Revenue dashboards can make a price increase look successful even when a brand earns less after costs. Measure the economics at SKU and channel level, and compare outcomes with what would likely have happened without the change.
Track contribution profit per SKU per week, contribution per unit after storage exposure, conversion by price band, repeat purchase, cart abandonment, and customer-service contacts related to pricing. A reported MIT study of dynamic airline pricing found that selective fare increases and discounts could raise revenue by 1% to 4% compared with traditional pricing and revenue-management methods alone (MIT study of dynamic airline pricing mechanisms). For a CPG operator, the useful lesson is to test selective actions against a meaningful counterfactual, not to treat a topline lift as proof of profit.
Use a minimum contribution floor, a maximum price-change frequency, and a defined limit for deviation from the reference price. Track the results by SKU and channel. If an observed lift could be explained by a promotion, a stock change, or a shift in advertising, don't credit the price rule until you can separate those effects.
A practical review compares three views: performance before the price change, a holdout group that stayed at the old price, and a static-price counterfactual based on the same business conditions. Review conversion and contribution alongside inventory velocity, repeat purchase, and abandonment. Re-estimate elasticity by product and channel as new transaction data becomes available, and include confidence intervals so teams know when a recommendation rests on limited evidence.
Use channel profitability analysis to identify where fulfillment and marketplace expenses change the result. The decision rule is simple: retain a price change when it improves contribution and doesn't breach trust, inventory, or channel guardrails. If revenue rises but contribution falls, the optimization missed its target.
Reddog Consulting Group works with CPG founders and operators on marketplace margin, channel economics, inventory velocity, and growth planning. Book a free 30-minute strategy call with Reddog Consulting Group as a working session to review your pricing rules and identify where price, inventory, or fulfillment decisions are affecting contribution.
Leave a comment: