
Published: March 2020 | Last Updated:May 2026
© Copyright 2026, Reddog Consulting Group.

TL;DR:
- Sales velocity measures how efficiently a product moves through retail channels while maintaining margin and building loyalty. It is crucial for gaining shelf space, supporting promotions, and attracting investor interest, but must be analyzed net of promotional spikes and returns for accurate insights. Building organic, sustainable velocity relies on strategic placement, targeted campaigns, and quality drivers rather than heavy discounting.
Sales velocity is one of the most misunderstood metrics in CPG retail. Most founders hear “velocity” and think it simply means selling faster. But faster sales with eroding margins, misaligned channels, or unsustainable promotions is not growth — it’s a slow bleed. True sales velocity measures how efficiently your product moves through each retail channel while protecting contribution margin, building repeat purchase behavior, and signaling genuine consumer demand. This guide breaks down exactly what sales velocity means for CPG brands, how to calculate it across channels, and what you can do right now to move the needle in ways that actually matter for long-term brand value.
| Point | Details |
|---|---|
| Sales velocity defined | It’s not just speed—it’s how quickly and profitably products sell per channel. |
| Calculation matters | Understand and adapt the sales velocity formula for every retail and digital channel. |
| Impact on growth | Better velocity leads to faster retail expansion and improved margins. |
| Practical tactics | Use targeted strategies—from analytics to in-store activation—to boost velocity sustainably. |
| Quality over speed | Prioritize margin and loyalty as much as volume to unlock lasting brand success. |
Before diving into formulas and tactics, let’s make sure we’re all talking about the same thing when we say “sales velocity” in the retail CPG world.
The classic definition of sales velocity is straightforward: the number of units sold per store, per week. Retail buyers use this number to determine shelf placement, reorder frequency, and promotional investment. A product moving 3 units per store per week in a 500-store chain looks very different to a buyer than one moving 0.8 units. That gap can mean the difference between expanded distribution and a deauthorization notice.
But for brand operators building for the long term, this definition is incomplete. Sales velocity in a true CPG context must also account for contribution margin per unit, sell-through rates relative to your distribution footprint, and channel-specific cost structures. A product flying off Amazon shelves at a 40% discount may show impressive velocity numbers while quietly destroying your profit structure.
Here’s a quick breakdown of what healthy velocity looks like across formats:
| Channel | Key velocity metric | Warning sign |
|---|---|---|
| Grocery retail | Units per store per week | Below 1.0 UPSPW in chain accounts |
| Amazon FBA | Units per day, BSR movement | Velocity driven by coupons only |
| Walmart WFS | Replenishment order frequency | High returns distorting sell-through |
| DTC / ecommerce | Revenue per visitor, reorder rate | Single-purchase dominance |
| Wholesale / distributor | Case fill rate, depletion velocity | Inventory sitting in DC, not selling |
The most common mistake brands make is treating velocity as a speed metric only. They run a promotion, see a spike, and interpret it as traction. In reality, promotional velocity spikes are often followed by velocity valleys as the consumer pantry-loads and stops buying at full price. You need to look at baseline velocity — the rate at which your product sells without promotional support — to understand what’s actually working.
Pro Tip: Separate your promoted weeks from your baseline weeks in your velocity analysis. Buyers know the difference, and so should you. Baseline velocity is the number that drives long-term shelf confidence.
Velocity is also a key indicator for your growth strategy workflow — it tells you which channels deserve more investment and which ones are consuming resources without proportional return.
A few additional factors that separate velocity analysis from simple sales reporting:
With the definition clear, let’s walk through exactly how sales velocity is measured — including multichannel nuances — for your brand.
The core formula for retail velocity is simple:
Velocity = Total units sold ÷ Number of active stores ÷ Number of weeks
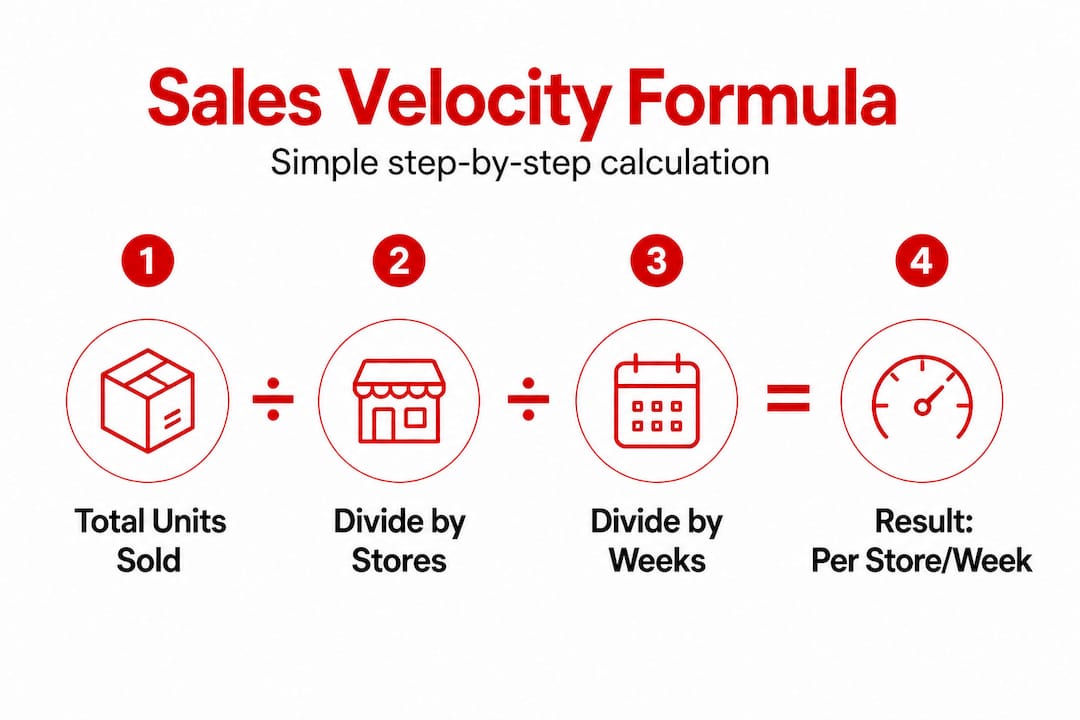
So if you sold 6,000 units across 200 stores in 4 weeks, your velocity is 6,000 ÷ 200 ÷ 4 = 7.5 units per store per week. That’s a strong number in most grocery categories. But the formula gets more layered when you operate across multiple channels.
For a blended multichannel velocity metric, you need to add a digital layer:
Here’s how two brands might look at the same blended velocity number very differently:
| Metric | Brand A | Brand B |
|---|---|---|
| Total monthly units sold | 12,000 | 12,000 |
| Retail velocity (UPSPW) | 4.2 | 1.8 |
| Amazon units (% of total) | 20% | 65% |
| Average contribution margin | 38% | 19% |
| Repeat purchase rate | 42% | 17% |
Brand A and Brand B show identical top-line volume. But Brand A is building a sustainable business. Brand B is Amazon-dependent with margin compression and low loyalty. A sales conversion rate guide perspective would show that Brand B is also likely spending heavily on PPC just to maintain that velocity — which further erodes the margin picture.
The biggest pitfalls in velocity calculation include promotional spike distortion, which we already covered, and overlooking returns. On Amazon especially, return rates above 5% in grocery or consumable categories are a red flag. Returns inflate gross shipment numbers but reduce net sell-through, which is what actually matters.
Pro Tip: Build a simple velocity tracker in Google Sheets or your BI tool that shows rolling 4-week, 13-week, and 52-week velocity per channel. Patterns become obvious fast. Use your retail channel tracking process to set a consistent cadence.
Understanding how to measure sales velocity is helpful, but why does velocity deserve so much attention from operators and investors?
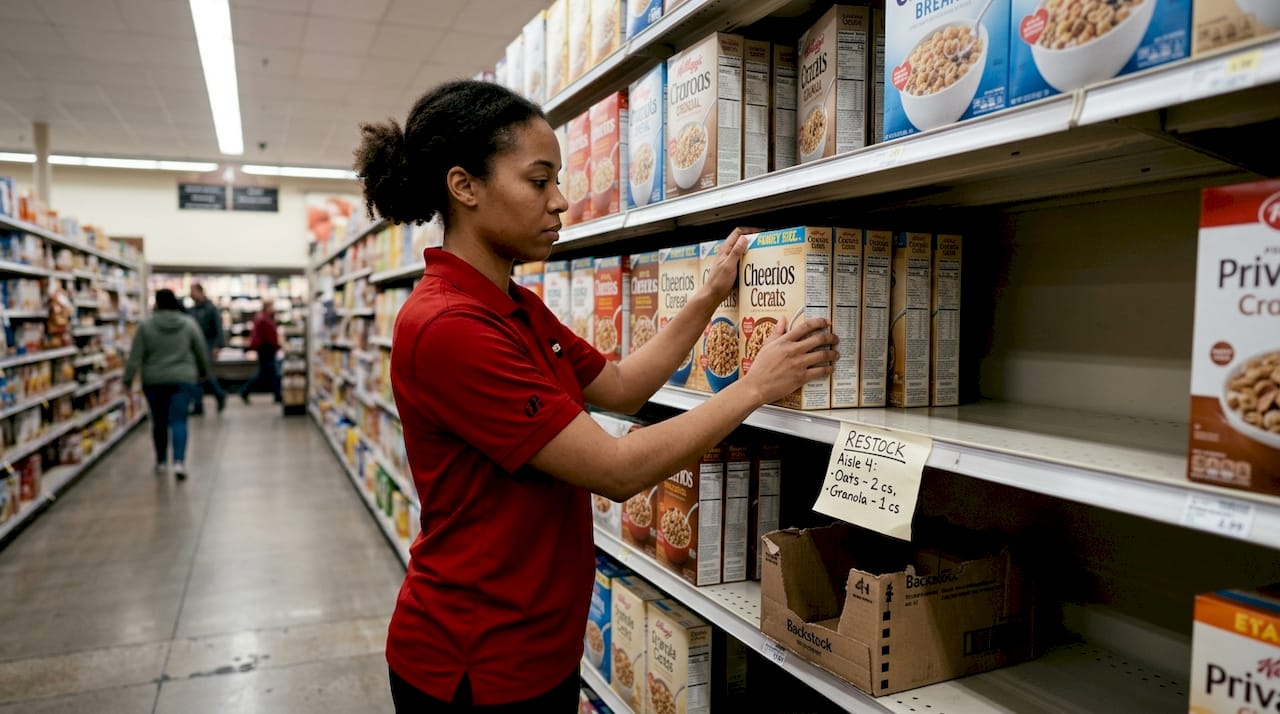
Retail buyers at major chains like Kroger, Target, H-E-B, or Sprouts are managing thousands of SKUs across dozens of categories. They have limited shelf space and they are accountable for category performance. When they see a brand with strong velocity, especially velocity that holds up between promotions, they pay attention. Strong velocity data is one of the most persuasive tools you have in a buyer meeting, especially when you can show week-over-week growth across multiple stores or markets.
Here’s what improved velocity actually unlocks for CPG brands:
The margin dimension is where most brands underinvest in their thinking. A 10% improvement in velocity does not simply mean 10% more revenue. It can mean significantly more contribution dollars if it comes with pricing stability rather than deeper discounting. Consider this: a brand selling 10,000 units per month at $4.00 average net after trade spend generates $40,000 in gross revenue. If they grow velocity 10% by optimizing shelf placement and digital content rather than cutting price, they generate $44,000 at the same margin. If instead they drive that 10% through a 20% price cut, they may generate more units but less total contribution.
“The brands that win in retail long-term are the ones that grow velocity without growing their trade spend at the same rate. That gap is where real profitability lives.” — A core operating principle we see validated time and again across the brands we work with.
Velocity also protects you against out-of-stocks, which are far more damaging than most operators realize. A single out-of-stock event in a retail account can result in a consumer switching brands permanently. Research shows that out-of-stocks cost CPG brands billions in lost revenue annually, and the damage compounds because retail systems may reduce your shelf allocation if your in-stock percentage falls.
Recognizing the impact of velocity is only useful if you know how to influence it. Here are proven, scalable ways CPG brands punch above their weight on velocity.
Merchandising and placement optimization is the highest-leverage in-store tactic. Eye-level placement on a primary shelf outperforms lower or upper shelf placement in most categories by 30 to 50%. If you’re in a natural or specialty channel like Whole Foods or Fresh Market, secondary placement on an end cap or in-aisle display can double your per-store velocity during a 4-week feature period.
Promotional cadence discipline is about being strategic rather than reactive. Brands that promote every 4 to 6 weeks train consumers to wait for deals. The most effective brands run fewer, deeper promotions at strategic moments (new distribution launches, seasonal events, competitive displacement opportunities) and protect their everyday price the rest of the time.
Digital velocity feeding physical retail is a strategy more brands should use intentionally. Strong Amazon reviews and sales rank signal consumer preference. When you walk into a buyer meeting with a product ranked in the top 10 of its subcategory on Amazon, that data point carries weight. Improving ecommerce conversions is not just a digital growth tactic — it’s building social proof that translates to retail shelf wins.
In-store demo programs remain one of the highest-ROI velocity drivers available to emerging CPG brands. A well-executed demo in the right retail environment — matched to your core consumer demographic — can generate 10 to 15 times normal velocity on demo day and lift surrounding weeks by 20 to 40%.
Analytics and rapid experimentation separate operators from founders. Build a testing cadence: try a new price point in 10 stores, measure velocity change, and make a call within 4 weeks. The brands that iterate fastest win more often. Your multichannel sales workflow should include a formal testing protocol so you’re generating learnings consistently, not just reacting to numbers.
Pro Tip: Before spending on paid media to drive velocity, audit your product page content, pricing, and in-store placement. Most velocity problems are execution problems, not awareness problems. Fix the fundamentals first.
All the tactics above matter — yet our experience shows there’s a more nuanced way to approach sales velocity.
Here’s what we see consistently: brands that chase velocity at all costs tend to plateau. They discount heavily, over-promote, and end up training their retail partners and consumers to expect deals. When they eventually try to normalize pricing, velocity collapses. They’ve built a price-sensitive consumer base rather than a brand-loyal one.
The brands that build lasting category positions do something different. They resist the urge to buy velocity with discounts. They focus on why their product moves — is it placement, word of mouth, strong creative, or genuine product differentiation? Then they double down on those drivers. When velocity grows organically, it holds. When it’s manufactured through promotions, it evaporates the moment the promotion ends.
We worked with a CPG brand in the Texas market that was hitting solid velocity numbers in a regional grocery chain. Their instinct was to run a deep price promotion to push into the top tier of their category. Instead, we helped them invest in in-store shelf strips, improve their packaging callouts, and run a targeted social campaign driving consumers specifically to those store locations. Velocity increased 28% over the next 8 weeks without touching the price. More importantly, it held for the 12 weeks after that.
This is what we mean by velocity quality. It’s about building the conditions for sustainable movement, not just spiking numbers for a buyer review. The best business growth workflow for a CPG brand includes a clear answer to this question: are we growing velocity in a way that builds or erodes brand equity?
Smart operators track both velocity and margin per channel simultaneously. They set a floor for contribution margin and refuse to run tactics that breach it, even if the volume looks attractive. That discipline is what separates brands that scale to $20M and beyond from those that stall or get squeezed out by better-capitalized competitors.
If you’ve made it this far, you understand that sales velocity is not just a number on a retailer’s report card — it’s a strategic signal about your brand’s health, channel fit, and growth trajectory.
At RedDog Group, we work with CPG brands in the $500K to $20M range who are serious about scaling profitably across retail channels. We help you build velocity tracking systems, identify where margin is leaking, and develop channel-specific growth plans that reflect how retail actually works. If you’re ready to build velocity that lasts, explore our CPG growth solutions and see how a contribution-margin-first approach changes the way you think about your retail strategy. Your next stage of growth starts with the right framework, not just more hustle.
Sales velocity tells you not just how fast your product moves, but how strong your demand signal is, how much retail support you’re likely to receive, and whether your channel mix is generating sustainable margin or burning through it.
Most brands benefit from weekly tracking as their baseline, but during new channel launches, promotional periods, or competitive disruptions, daily velocity monitoring allows for faster course corrections.
Deep promotional discounts, short-term channel stuffing, and heavy coupon activity can all spike velocity numbers in ways that mislead operators — always compare promoted versus baseline velocity and track repeat purchase rates to get the real picture.
Strong digital velocity, particularly on Amazon where search rank and review count are visible, gives retail buyers external validation of consumer demand and can meaningfully strengthen your case for expanded shelf placement.
Leave a comment: