Published: March 2020 | Last Updated:February 2026
© Copyright 2026, Reddog Consulting Group.

For a CPG operator, a pay-per-click report isn't a marketing summary; it's a channel-level P&L. It's the tool that translates every dollar spent on Amazon Ads, Walmart Connect, or Google into a measurable impact on your contribution margin, inventory velocity, and overall business health. If your report only shows clicks and impressions, it's not doing its job.
This guide breaks down how to build and read a PPC report that supports operational decision-making, not just marketing vanity metrics.
It's time to throw out the typical marketing agency scorecard. As a CPG operator, your PPC report isn't for celebrating high click-through rates or low CPCs. It’s an operational tool, plain and simple, designed to manage your contribution margin.
Every dollar you pour into platforms like Amazon or Google has to be accountable to your bottom line. That means factoring in everything—from your COGS and fulfillment fees all the way down to inventory velocity.
The global pay-per-click market is on track to hit $299.88 billion by 2032, which tells you one thing: brands are betting big on paid channels for growth. But here's the catch—that massive investment is often wasted by chasing the wrong metrics.

The most common trap CPG brands fall into is treating Advertising Cost of Sales (ACOS) as the ultimate measure of success. Sure, a low ACOS on a single campaign feels like a win. But in reality, it tells you nothing about that campaign’s actual impact on your total business. It's a siloed metric that completely misses the big picture.
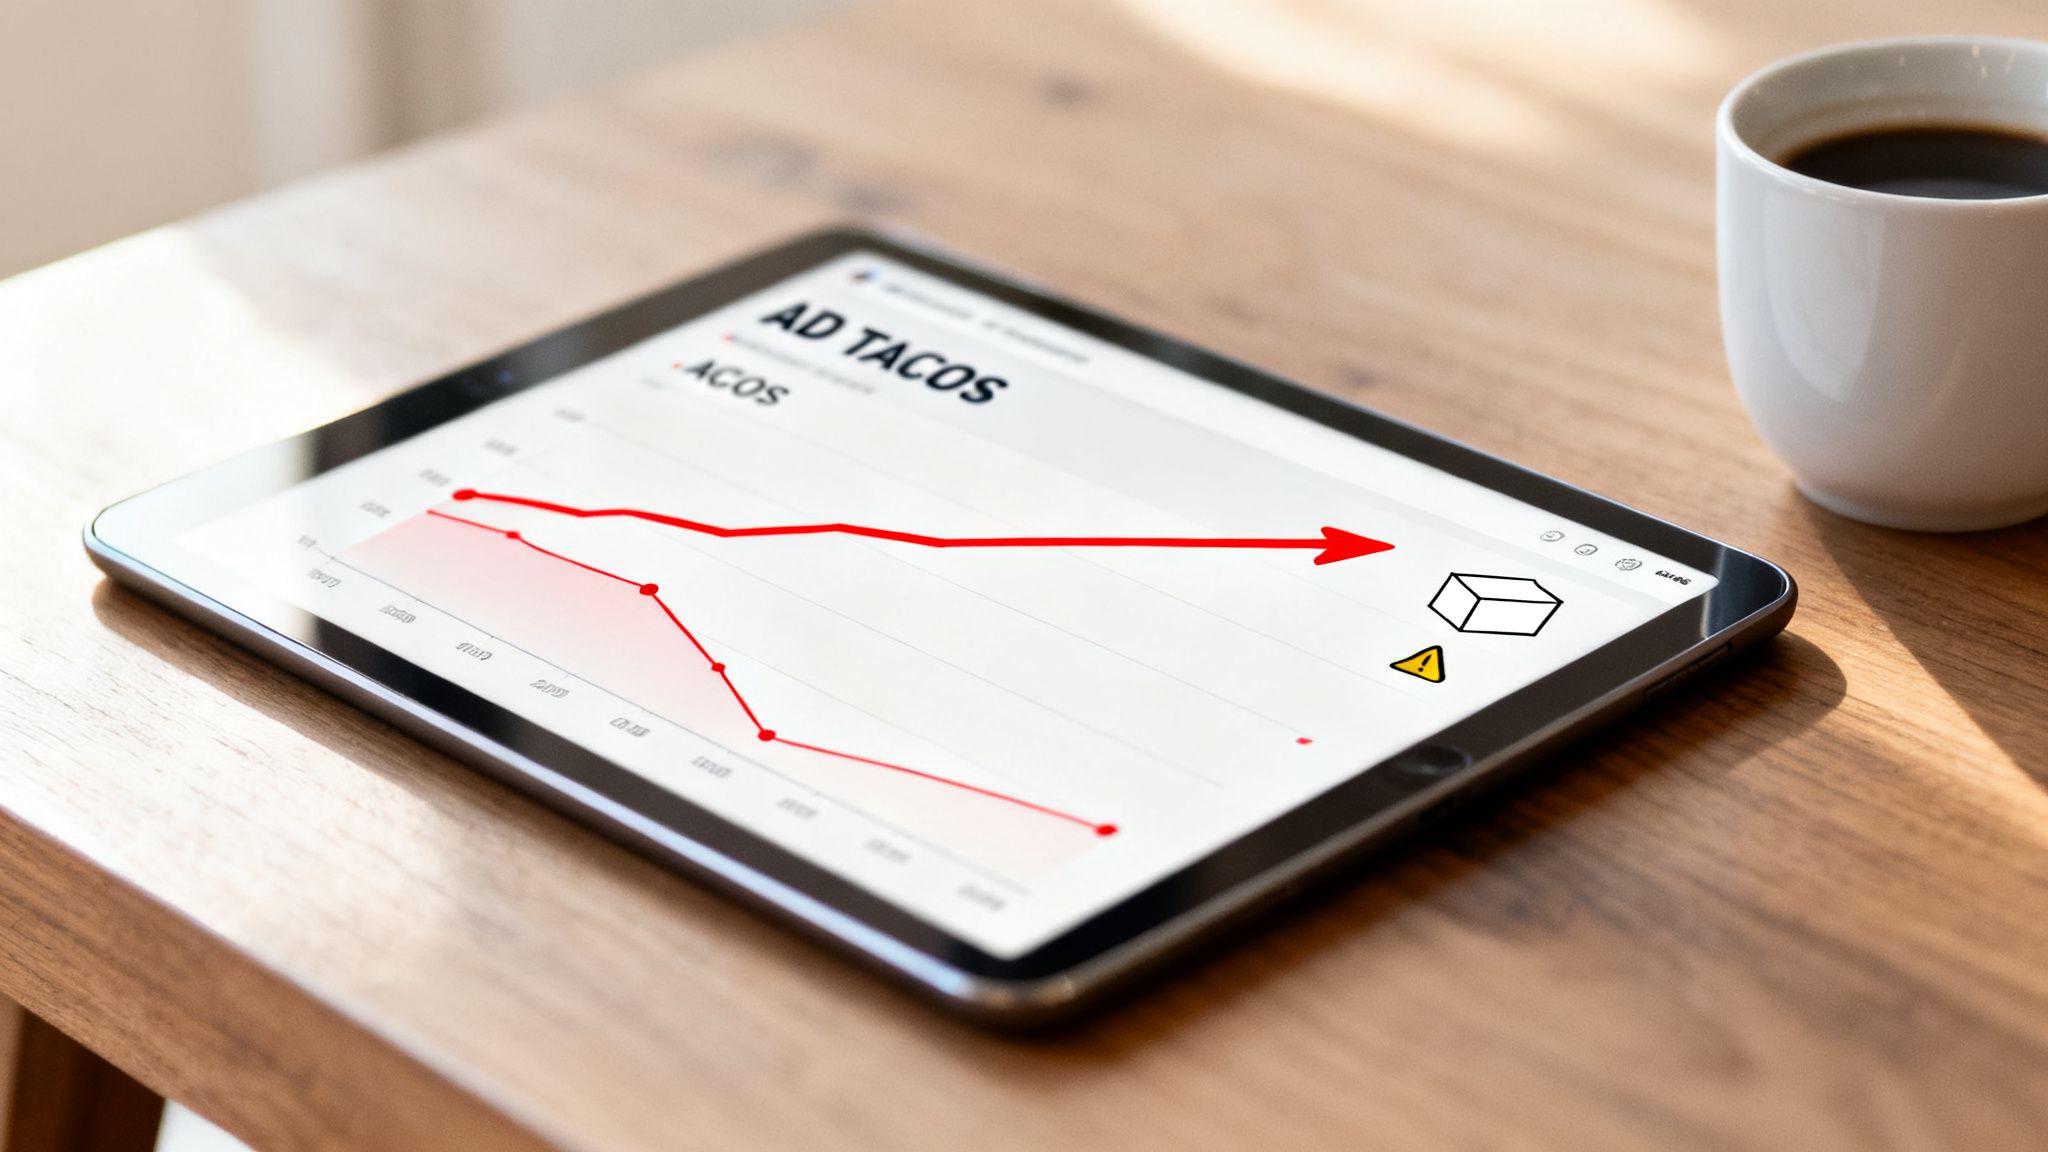
To get a real, honest assessment of performance, you have to look at Total Advertising Cost of Sales (TACOS).
TACOS measures your total ad spend against your total sales—both paid and organic. This is the one metric that shows whether your advertising is genuinely growing your business or just cannibalizing sales from customers who would have bought your product anyway.
If your TACOS is trending down, it means your ad spend is creating a halo effect, lifting organic sales and building real brand equity. But a rising TACOS, even with a "good" ACOS, is a red flag. It signals a dangerous dependency on paid traffic that will slowly but surely erode your margins.
This shift in perspective—from obsessing over campaign-level ACOS to focusing on account-level TACOS—is the critical first step. It's how you build pay-per-click reports that drive profitability, not just clicks.
| Metric | Standard Marketing View | CPG Operator View |
|---|---|---|
| ACOS/ROAS | Is the campaign efficient on its own? | Is the ad-driven sale profitable after all variable costs? |
| CTR | Is the ad creative engaging? | Is the ad attracting qualified buyers or just window shoppers? |
| CPC | Are we winning bids cheaply? | Is the bid cost justified by the product's contribution margin? |
| Conversion Rate | How many clicks turn into a sale? | How does this conversion impact inventory velocity and potential stockouts? |
| TACOS | Often overlooked. | The #1 indicator of profitable, sustainable growth for the entire business. |
This table highlights the fundamental difference: marketers look at ad efficiency, while operators look at business profitability.
Your PPC report must directly tie ad performance to your channel P&L. For a CPG brand, this means pulling in a few critical data points that marketing-focused reports almost always leave out:
This approach reframes your entire PPC strategy. Building a margin-first report is the Foundation that enables smart Optimization and, eventually, profitable Amplification.
A profitable PPC strategy is never one-size-fits-all. Each sales channel—whether it's Amazon, Walmart, or your own DTC store—operates with its own unique fee structure, customer behavior, and advertising platform. Forcing a single reporting model across all of them is a direct path to margin erosion. As an operator, your pay-per-click report has to be tailored to the specific economics of each channel.
This isn’t about creating more work; it’s about building a P&L for each platform that actually reflects reality. An acceptable ACOS on Amazon might be a complete disaster on Walmart once you factor in WFS fees and different margin structures. The goal is to establish clear, channel-specific KPIs that put contribution margin at the center of every single ad dollar spent.
This is the foundational work. Without a clear, margin-first report for each channel, any attempt at optimization is just guesswork.
For Amazon, the standard metric everyone talks about is Advertising Cost of Sales (ACOS), but relying on it alone is a critical mistake. A "good" ACOS means nothing if the sale it generated was unprofitable. Your first step is to calculate your Break-Even ACOS. This isn't a vanity metric; it's your operational guardrail.
Break-Even ACOS is the absolute maximum ACOS you can sustain on a product before you start losing money on each ad-driven sale. It’s calculated by factoring in your Cost of Goods Sold (COGS), Amazon's referral fees, and the ever-changing FBA fulfillment fees.
Here’s a practical scenario:
In this case, any campaign running above a 40% ACOS is actively burning cash. Your report must track this for every SKU, especially as FBA fees shift. You can use our retail profit margin calculator to streamline these calculations.
Your report also needs to elevate Total Advertising Cost of Sales (TACOS). This metric reveals the true impact of your ad spend on your entire Amazon business by measuring total ad spend against total sales (both paid and organic). A declining TACOS shows your ads are creating a halo effect, lifting your organic rank and building sustainable momentum.
Walmart’s marketplace operates on a different economic model, and your reporting needs to reflect that. While you can calculate ACOS, the industry standard here is Return on Ad Spend (ROAS). ROAS simply measures the gross revenue you generate for every dollar you spend on advertising.
A $4 ROAS means you generated $4 in revenue for every $1 of ad spend. However, just like with ACOS, this top-line metric is misleading without the context of your channel costs—particularly Walmart Fulfillment Services (WFS) fees.
Your Walmart PPC report must connect ROAS directly to your product's contribution margin. You need to know your Break-Even ROAS—the minimum return required just to cover your COGS, WFS fees, and other variable costs.
A common mistake brands make is chasing a high ROAS on low-margin products. A 5x ROAS might feel great, but if your product margin after all costs is only 15%, you're still losing money on every sale.
Your report should clearly segment ROAS by campaign and product, measured against your break-even targets. This ensures your ad spend isn’t just driving revenue but is actively contributing to your bottom line.
On your own DTC channel (like Shopify or BigCommerce), the game changes entirely. Here, you own the customer relationship, making Customer Lifetime Value (CLV) the most critical long-term metric. Your advertising report should therefore focus on Customer Acquisition Cost (CPA) in relation to CLV.
A high CPA might seem alarming at first glance, but if that customer goes on to make multiple repeat purchases, the initial investment can be incredibly profitable. The key is understanding the payback window. How many months does it take for a new customer's gross margin to cover their acquisition cost?
Your report must answer:
This data allows you to make strategic trade-offs. You might accept a higher CPA from one channel if the data shows it acquires customers with a 50% higher CLV. This long-term, margin-focused view is essential for building a durable DTC business.
This thinking must also account for the overwhelming trend toward mobile. Mobile PPC ads are predicted to account for 66% of total digital ad spend in 2025, a clear signal of where consumer attention is. For CPG brands on Amazon and Walmart, where app-based shopping is dominant, this trend is not just a forecast but a current operational reality. Find out more about how this mobile shift impacts PPC strategy and learn more about these PPC statistics.
Building a truly effective PPC report means going beyond the default metrics provided by each platform. You need a clear-eyed view of profitability at the channel and product level. This checklist breaks down the must-have KPIs for each channel to ensure your reports are always grounded in margin.
| Metric Category | Amazon | Walmart | DTC (Google/Meta) |
|---|---|---|---|
| Top-Line Performance | Ad Sales, Total Sales, Clicks, Impressions, CTR | Ad Sales, Clicks, Impressions, CTR | Revenue, Clicks, Impressions, CTR |
| Efficiency Metrics | ACOS, TACOS, CPC | ROAS, CPC | ROAS, CPA, CPC |
| Profitability Guardrails | Break-Even ACOS (by SKU), Contribution Margin | Break-Even ROAS (by SKU), Contribution Margin | CLV to CPA Ratio, Payback Window |
| Growth Indicators | Organic Rank Movement, New-to-Brand Metrics | N/A | New vs. Returning Customer Rate |
Remember, the goal isn't just to report on what happened, but to understand why it happened and what levers you can pull next. By tracking these specific KPIs, you move from reactive reporting to proactive, profit-driven optimization.
A solid pay-per-click report is so much more than a summary of what happened last month; it's your playbook for making tough operational and financial calls. The data doesn't just tell you if a campaign was "good" or "bad"—it shows you where to put your money, when to tweak your pricing, and how to keep your inventory moving. For any CPG operator, this is where the real work begins.
Think of the numbers in your report as signals. A rising Cost-Per-Click (CPC) on a keyword you rely on isn't just a marketing headache; it's a direct shot at your contribution margin. The knee-jerk reaction might be to just bid up or down, but the real question is deeper. Should you raise your product's price to cover the higher ad cost, even if it means your conversion rate might dip? Or do you eat the cost to defend your spot, accepting a temporary hit to your margins to protect your hard-won organic rank?
These aren’t just marketing decisions. They're business decisions, grounded in the economics of each channel.
To get real value from your report, you have to look at how metrics relate to each other, not just in isolation. A single KPI can be totally misleading, but the story woven between several of them reveals the true health of your business.
Let's say you just launched a new product. Your first report might show a 65% ACOS, a number that would normally send anyone into a panic. But if that same report shows your TACOS is holding steady or even getting better, and the product's organic rank shot up from page ten to page one, you're not looking at a failed campaign. You're looking at a smart, albeit expensive, investment in grabbing market share. That high ACOS was simply the price of entry.
Here’s another trade-off you’ll constantly face:
You get a notification that FBA fees are increasing by 10% for your top-selling SKU. This isn’t just an annoying line item on your next Amazon statement; it directly reshapes your ad strategy. If your product's break-even ACOS was 40%, that fee hike might drag it down to 36%. Your report now has a new guardrail, and every campaign tied to that product must operate within this tighter threshold to stay profitable.
This is what optimization actually looks like—using raw data from your PPC report to sharpen your strategy, defend your margins, and make intelligent pivots. A great report doesn't just show you numbers; it forces these kinds of strategic conversations.
The diagram below shows exactly how contribution margin should be the starting point for every channel-specific PPC strategy.
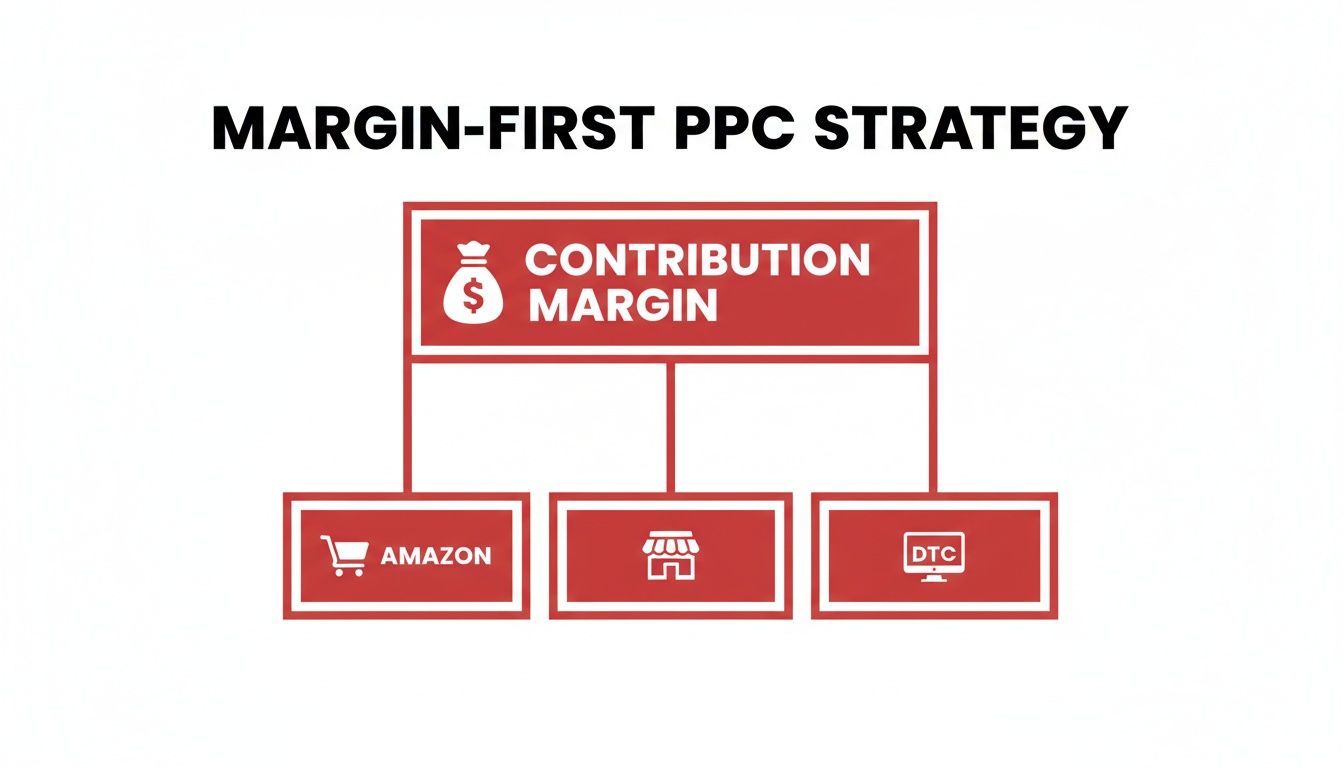
This hierarchy drives home a simple point: whether you're running ads on Amazon, Walmart, or your own DTC site, every decision has to be traced back to its impact on your unit-level profitability.
Your pay-per-click report is also one of your best tools for managing inventory. Spending aggressively on a product with only two weeks of stock left is a classic, costly mistake. You pay to drive sales, you stock out, and then you watch your organic rank tank, wiping out all the progress you just paid for.
A savvy operator weaves inventory data right into their PPC analysis.
The same logic applies to pricing. If your report shows a consistently high conversion rate and a healthy ACOS for a certain keyword, you might have room to test a price increase. On the other hand, if CPCs are climbing and your margin is getting squeezed, the data might be telling you it’s time for a price adjustment to protect your target break-even ACOS. Your report becomes the source of truth for these critical, margin-defining choices.
The most dangerous threats to your advertising profitability are rarely the obvious ones. It’s not the sudden spike in CPC or a single underperforming campaign that does the real damage. Instead, it’s the slow, hidden leaks in your strategy that quietly drain your contribution margin over time, often while your top-line metrics look perfectly healthy.
As an operator, you have to look past the campaign-level dashboards and spot the underlying risks that most marketing-focused reports completely miss. These issues aren't just about wasted ad spend; they create operational drag that can compromise your entire marketplace presence. A well-structured pay-per-click report is your first line of defense, but only if you know what you’re looking for.
One of the most common pitfalls is celebrating a low campaign-level ACOS while your account-level TACOS is steadily climbing. This is a classic symptom of ad cannibalization. It happens when your ads are converting customers who would have bought your product organically anyway. You're essentially paying for sales you already owned.
For instance, a branded search campaign might show a fantastic 15% ACOS. But if those clicks are coming from existing customers searching your brand name directly, you're not acquiring new business. You're just inserting a paid touchpoint into an organic journey, and your TACOS will creep up as a result, eating into your total account profitability.
A healthy ad strategy generates incremental lift. If your paid campaigns aren't driving down your TACOS over the long term, they are not building sustainable growth—they are creating a dependency that compresses your margins.
Your report must track both metrics side-by-side. This dual view is non-negotiable for understanding if your ad spend is truly building your business or just poaching your own organic traffic.
Another hidden risk is the attribution fallacy—over-crediting ads for sales that were already in the bag. This is especially common with retargeting campaigns. A shopper might see your product, add it to their cart, and fully intend to buy it later. When a retargeting ad pops up and they click it to complete the sale, the ad gets full credit.
In reality, that ad didn't generate a new sale; it just closed an existing one. While there's value in that, over-investing based on inflated attribution data can lead you to pour money into bottom-funnel tactics while starving the top-funnel activities that actually create new demand. It's a subtle but critical distinction that impacts your long-term growth.
To combat this, your analysis needs to separate campaign types:
Finally, the most overlooked risk is completely operational: ignoring inventory levels. Aggressively spending on a product with low stock is one of the fastest ways to burn cash and destroy your organic momentum. You pay to accelerate sales, trigger a stockout, and your Best Seller Rank (BSR) plummets.
When you're finally back in stock, you have to spend even more ad dollars just to regain the ground you lost. It’s a vicious, expensive cycle.
Your PPC report has to be tied to your inventory data. A simple "days of cover" metric right next to each SKU's ad spend is essential. This ensures your advertising strategy is always aligned with operational reality, preventing you from paying to create problems that cost even more to fix. This is a core part of building a foundational system that anticipates trade-offs rather than just reacting to them.
Manual reporting is the slow road to bad decisions. Spending hours pulling data from different ad platforms into a spreadsheet isn't just a massive time sink—it's also a breeding ground for human error. One simple copy-paste mistake can send you chasing a problem that doesn't even exist or, worse, ignoring a real one that's quietly eating away at your margins. As an operator, your time is your most valuable asset; it should be spent making decisions, not wrestling with data.
Building an efficient, automated reporting system is a non-negotiable step toward scaling profitably. It gets rid of the operational drag from manual work and gives you a consistent, accurate look at your performance. This frees you up to focus on strategy—interpreting the data and making the tough calls that actually move the needle on your contribution margin.
An automated system lets you build a proactive rhythm for managing performance, instead of constantly putting out fires. A realistic and effective cadence for most CPG brands usually looks something like this:
The tools you use to automate your pay per click report will depend on your scale, budget, and in-house technical skills. Each option has clear trade-offs between cost, control, and how easy it is to use.
The dashboards inside platforms like Amazon Advertising Console or Google Ads are the natural starting point. They’re free and provide all the essential performance data.
Tools like Perpetua, Pacvue, or Skai are built specifically for marketplace advertising. They plug directly into platforms like Amazon and Walmart to automate bidding, campaign creation, and reporting.
For many growth-stage CPG brands, these platforms are the sweet spot. They offer a huge efficiency boost over manual management without demanding the heavy investment of a custom BI solution.
Using tools like Tableau, Power BI, or Looker Studio gives you the ultimate flexibility and control. By pulling data from all your different sources (ad platforms, inventory systems, financial software), you can build a truly comprehensive dashboard that ties every ad dollar directly to your contribution margin.
The right choice comes down to your operational maturity. Start with the native dashboards, graduate to a third-party platform as you scale, and consider a custom BI solution once your complexity and budget make it a worthwhile investment. The end goal is a system that delivers accurate, actionable insights with as little manual work as possible.
A great pay-per-click report doesn’t just tell you what happened last month; it tells you what to do next. For a CPG operator, the real magic happens when you use its insights to make smarter, margin-boosting decisions across your entire business. This is where we move past simple ad tweaks and into strategic growth.
This turns your report from a static summary into a dynamic engine for growth. Suddenly, that data becomes a feedback loop, directly shaping everything from product development to pricing and even inventory planning. This is how you build a durable, profitable brand—not just a collection of efficient ad campaigns.
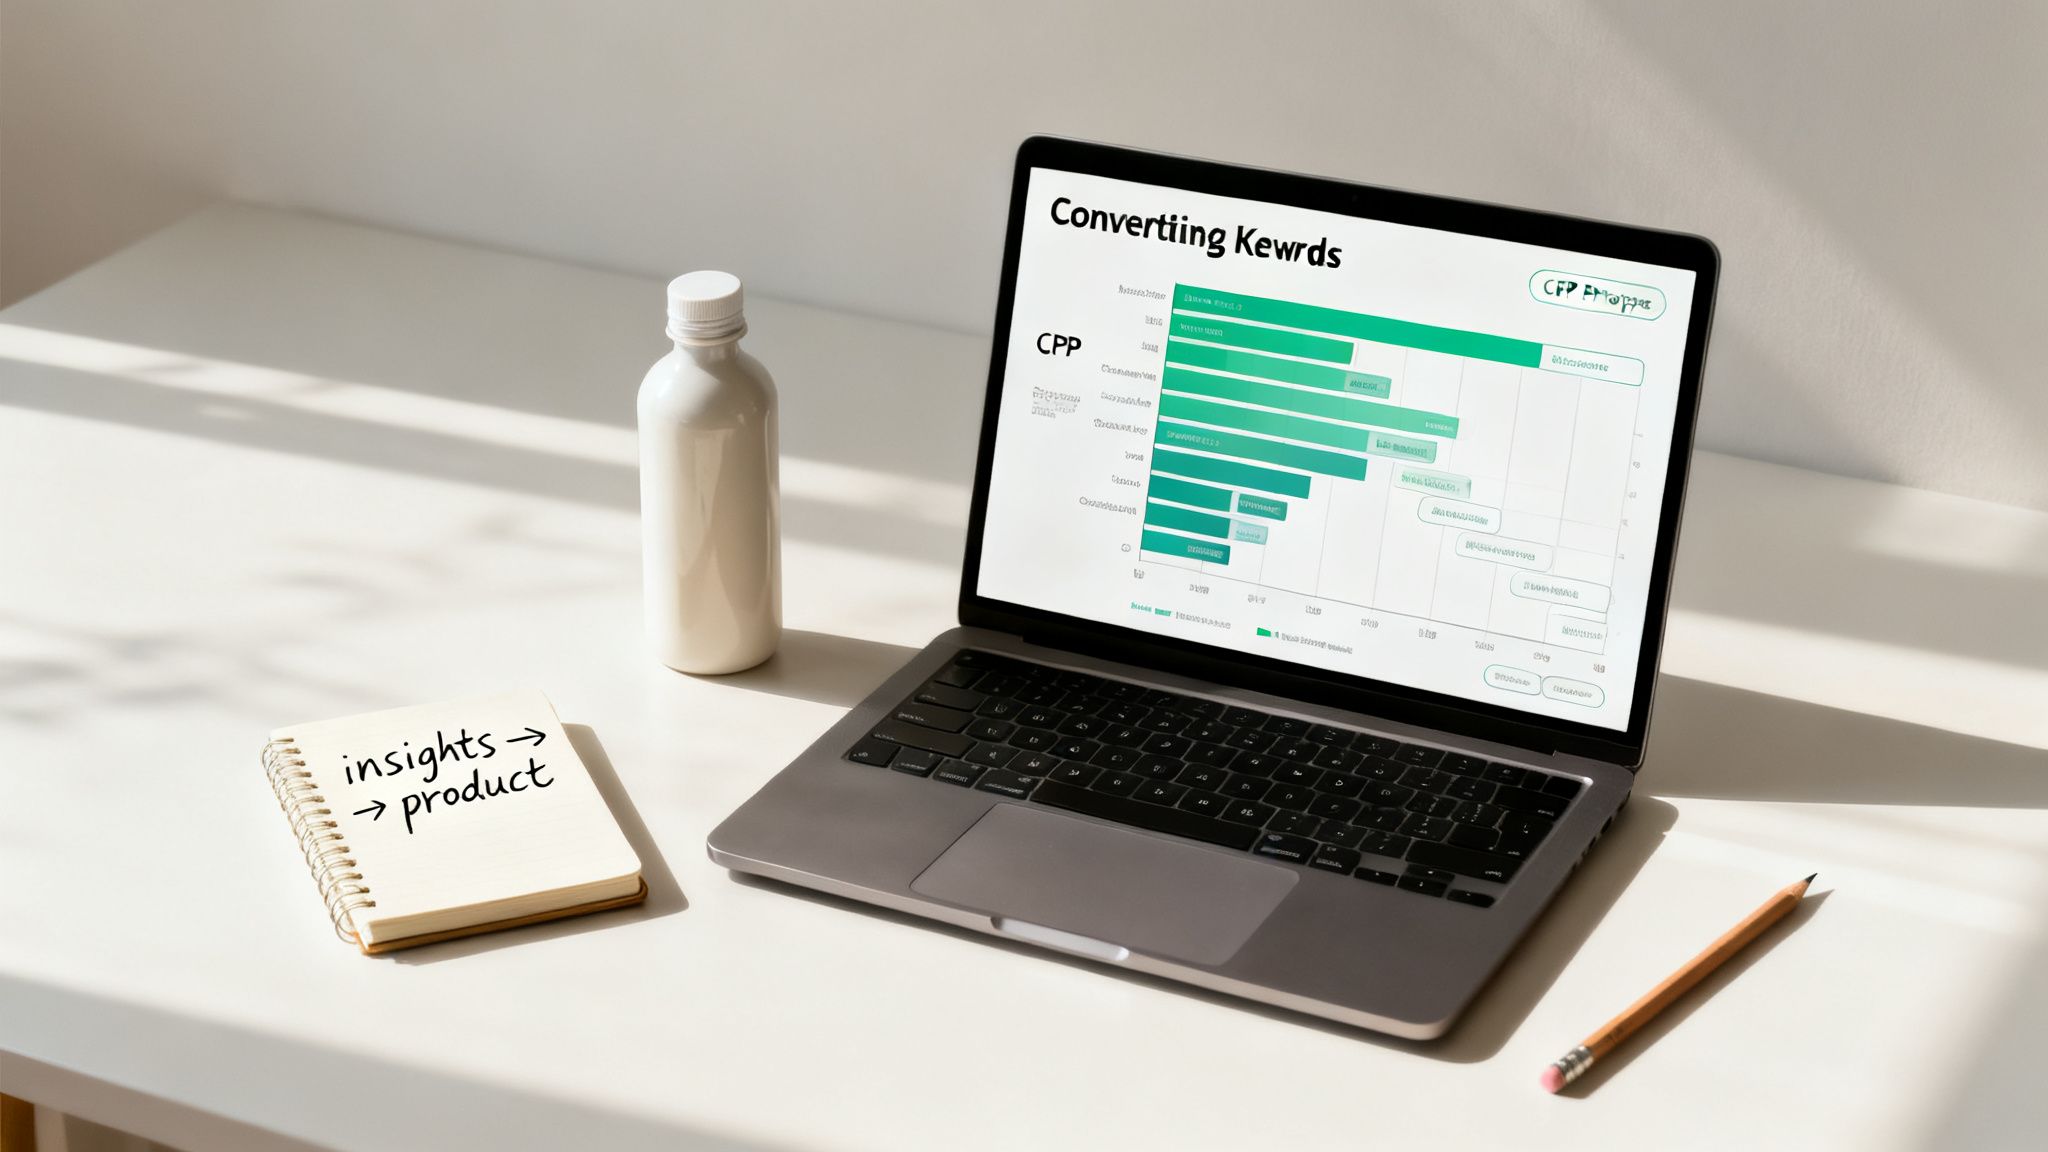
The insights buried in your PPC report are basically real-time signals from the market. Your job is to translate those signals into moves that protect your contribution margin and unlock new ways to make money.
It’s all about asking bigger, more strategic questions based on what the numbers are telling you:
When you start thinking this way, your advertising data becomes a powerful R&D tool.
Your PPC report is one of the fastest and cheapest ways to test new market opportunities before you commit serious cash or inventory. For instance, you can gauge demand for a new product idea by running ads to a simple "coming soon" landing page and just measuring clicks and email sign-ups.
This de-risks growth. Instead of investing $50,000 in a new production run based on a gut feeling, you can spend $1,000 on a targeted ad campaign to gather real-world data on consumer intent.
The same logic applies to managing your inventory. By keeping a close eye on search volume trends and conversion rates in your report, you can build a much more accurate sales forecast. If you see search volume for a seasonal keyword starting to spike two weeks earlier than last year, you can adjust your inbound shipments to avoid a costly stockout.
This direct line between advertising data and operational planning is what separates brands that scale profitably from those that are constantly putting out fires.
Is your ad spend actually driving profit, or is it just creating complexity? A properly structured pay-per-click report should give you a clear answer. If it doesn't, it's time to fix the underlying system. Tying every ad dollar to contribution margin, inventory velocity, and channel economics is the foundation of profitable growth.
Book a free, 30-minute strategy call with us. This is a working session for CPG operators, not a sales pitch. We'll map your PPC performance to your channel P&L and identify exactly where your ad spend can work harder to improve your contribution margin.
Secure your session here: https://www.reddog.group/pages/cpg-retail-growth-offer
Leave a comment: