
Published: March 2020 | Last Updated:October 2026
© Copyright 2026, Reddog Consulting Group.

More SKUs don't automatically create more growth. In a large cross-market study of 13,681 brands and 92,877 SKUs across 15 packaged-goods categories, the top-selling SKU contributed approximately 50% of a brand's total penetration and about 40% of its sales (research on SKU portfolio productivity). The implication isn't that every secondary item should be deleted. It is that portfolio decisions must distinguish between products that acquire or retain disproportionate demand and products that merely add complexity.
Brand portfolio management shapes a profitable portfolio for each channel, while keeping the brand clear to shoppers and manageable for operators. The unit of analysis is contribution margin by channel, not company-wide SKU velocity.
A SKU that earns money through DTC can lose money on Amazon. Referral fees, fulfillment, advertising, returns, storage, discounts, and working capital can consume the contribution shown in a direct-to-consumer revenue report. Sales can also mask cannibalization when a product pulls demand from a higher-margin core item.
Operator rule: Approve a new SKU only when it adds profitable, strategically useful demand.
Ask what job each product performs in each channel. A hero item may recruit buyers on Amazon, support a retailer's price ladder, or anchor replenishment on DTC. A slower item can earn its place by serving a specific occasion, pack size, customer segment, or retailer relationship.
Brand cohesion carries the same operational weight. Naming, packaging, claims, and visual hierarchy determine whether shoppers understand the range or see disconnected products. This marketing and brand awareness guide explains how brand visibility supports demand. Apply that perspective alongside contribution data, never as a substitute for it.
Run the work in three stages:
This sequence keeps growth decisions disciplined. Portfolio expansion can increase trade spend, create slower inventory, dilute shopper navigation, and force the business to support items without a credible route to distribution.
For broader strategic context, the CPG brand strategy framework provides a useful structure for connecting brand roles with commercial choices. The operating test is straightforward: every SKU needs a consumer job, a channel role, a margin hurdle, and a clear relationship to the rest of the portfolio.
Portfolio decisions fail when contribution margin is incomplete. A low-velocity SKU may support a premium price ladder, satisfy a retailer commitment, recruit a customer, or protect repeat demand. Marking it for deletion on unit sales alone destroys value before the team measures the replacement effect.
Build one reconciled item-level source of truth first. The Foundation stage should show what each SKU contributes by channel, customer type, and fulfillment model. Optimization and Amplification come later, after those economics are visible.
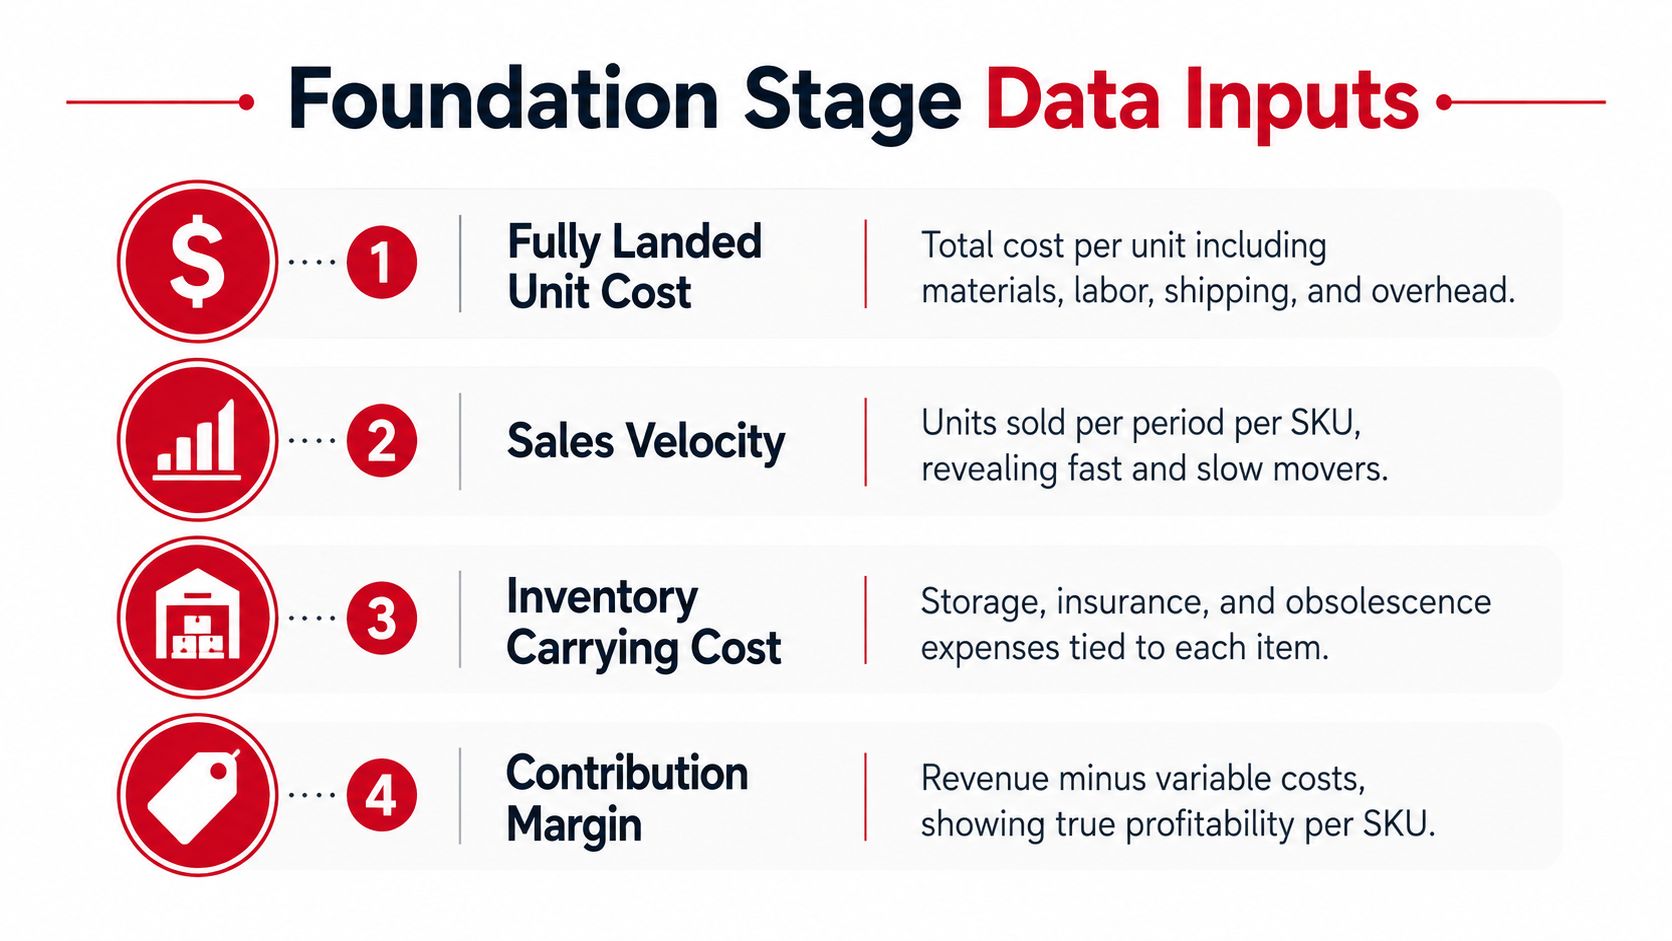
Product cost covers only part of the decision. Capture materials, labor, inbound freight, duties where applicable, packaging, preparation, warehousing, and every other cost required to place a saleable unit in a channel. Keep channel expenses separate rather than hiding them inside a blended average.
For a marketplace SKU, record referral fees, fulfillment, storage, advertising, coupons, returns, and expected chargebacks. Wholesale items may carry less paid media but more trade spend or distributor deductions. DTC items may avoid marketplace fees while absorbing pick-and-pack, payment processing, customer service, and acquisition costs. Compare contribution margin channel by channel.
Record units sold by SKU, channel, customer type, and time period. Revenue can conceal price changes and promotional loading. Velocity can conceal margin erosion and inventory burden.
Estimate incremental demand by testing the disappearance scenario. If the SKU leaves, does the buyer switch to a core product, leave the brand, choose a competitor, or buy another pack? That answer separates a weak item from one that protects the portfolio.
Review product names, pack hierarchy, colors, claims, images, and navigation. Acceptable unit economics do not excuse a catalog or shelf that shoppers cannot understand.
Research covering 125 brands and 1,023 products in nine UK packaged-goods categories found that larger portfolios tend to lose cohesion, while additional visual elements and sub-brands are associated with lower portfolio-cohesion scores (portfolio cohesion research). Treat architecture as operating data, not a design preference.
The item-level file must support filters for SKU, channel, customer, and fulfillment model. Include:
A product-information system can synchronize names, claims, pack details, and channel attributes. The PIM for Shopify stores reference is useful when catalog data is scattered across commerce platforms.
The first Foundation checkpoint is a reconciled contribution-margin view that finance, operations, merchandising, and growth teams can use. Apply a channel profitability analysis framework before changing assortment, then proceed to Optimization only when each proposed action has a measurable channel role.
Architecture determines how much complexity the portfolio can absorb before shoppers, retailers, and internal teams lose the thread.
A branded house puts most products under one dominant brand. Dove is a recognizable example. The model can concentrate awareness, simplify shopper navigation, and make media and packaging systems more reusable. The trade-off is exposure. A failed extension, confusing claim, or weak product can affect the parent brand more directly.
A house of brands gives each brand its own identity. Procter & Gamble's portfolio illustrates this approach through brands such as Tide, Pampers, and Gillette. It supports sharper positioning by audience or category and can isolate risk, but it requires separate brand-building, packaging systems, content, and often retailer support.
An endorsed brand sits between the two. Products retain distinct identities while receiving credibility from a parent brand, as Marriott does across several hotel brands. In CPG, this structure can help a company enter a new category without forcing every product into the same visual or promise architecture.
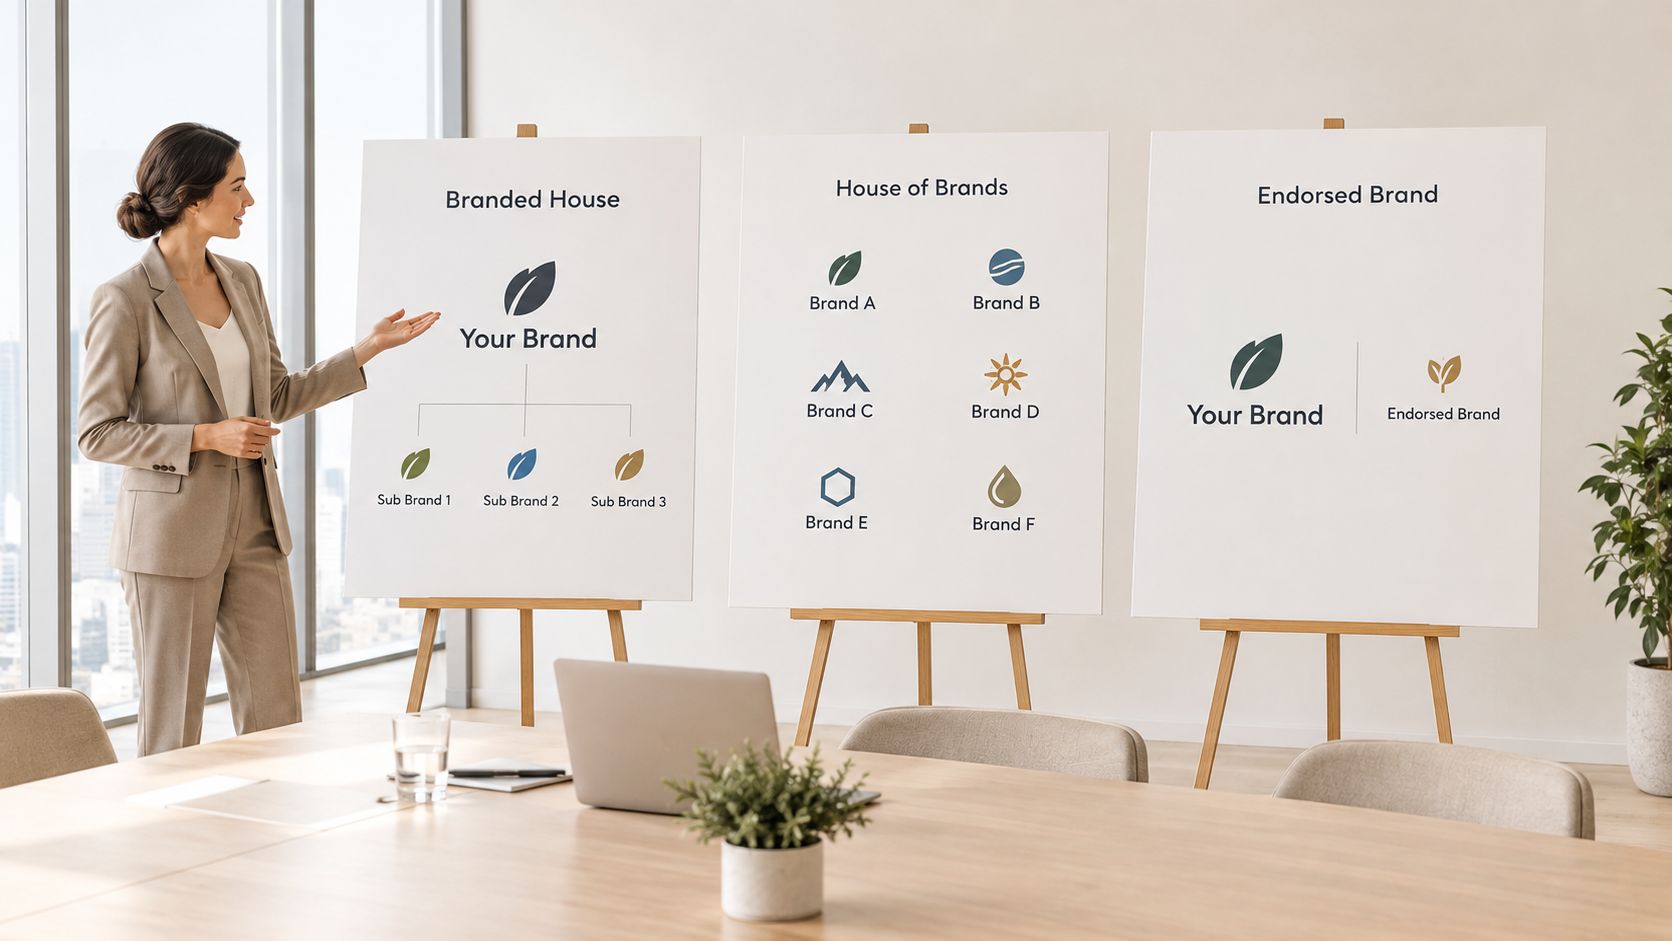
Use a branded house when shared awareness and cross-selling matter more than highly separate category identities. Use a house of brands when customer needs, price points, or channel strategies differ. Use an endorsed structure when the parent brand can transfer trust without erasing the reason a product deserves its own position.
Ask four questions before adding another sub-brand:
Architecture should also influence trade-spend decisions. A branded house may let the team reuse creative and shopper education, while a house of brands may justify distinct positioning but require separate investment. Neither model is automatically more profitable.
Set a governance rule before the next launch: every addition must document its consumer job, channel role, margin hurdle, naming relationship, packaging relationship, and exit condition. If the team can't explain why the product belongs in the architecture, it isn't ready for commercialization.
Contribution margin is the operating language of serious portfolio management. The useful number isn't list price minus product cost. It is the money left after every variable cost required to sell, fulfill, support, and carry the unit.
A practical formula is:
Net selling price minus product cost, referral fees, fulfillment, storage, advertising, discounts, returns, chargebacks, and allocated working capital.
Calculate that result separately for every SKU and channel. Don't use a blended company margin to approve marketplace expansion.
Amazon's 2026 U.S. fee schedule shows why small physical or pricing changes can alter the decision. For standard-size products priced from $10 to $50, average FBA fulfillment fees increased by $0.08 per unit. The effect varied by size: small standard-size products increased by $0.25 per unit on average, while large standard-size products increased by $0.05 (Amazon's 2026 FBA fee schedule).
Products below $10 received an average low-price fulfillment-fee discount of $0.86 compared with products priced at $10 or more. That creates a real pack-architecture decision. A larger pack that moves the offer above the threshold may produce more selling price while losing the gain through fulfillment, advertising, returns, and overhead.
Build a break-even price by SKU. Start with required contribution, add product and channel costs, then test price, pack dimensions, conversion assumptions, and advertising scenarios. A portfolio-wide margin target won't catch a small product that crosses a fee boundary.
Walmart Marketplace referral fees range from 6% to 15% depending on category and total sales price, with no setup or monthly seller fee. WFS lists fulfillment at $3.45 for items weighing up to one pound and $5.45 for a three-pound item. Storage is listed at $0.75 per cubic foot per month from January through September. From October through December, inventory stored for up to 30 days has no added peak charge, while inventory stored longer than 30 days incurs an additional $1.50 per cubic foot per month (Walmart Marketplace seller economics).
That means a slow seasonal SKU can look attractive on referral economics and still lose money through storage. Prioritize WFS for compact products with predictable velocity. Test other fulfillment options or smaller case packs when demand is uncertain.
The contribution-margin calculation guide can help standardize the spreadsheet. The important discipline is ownership. Finance should validate costs, operations should validate fulfillment assumptions, and growth teams should validate advertising and demand inputs.
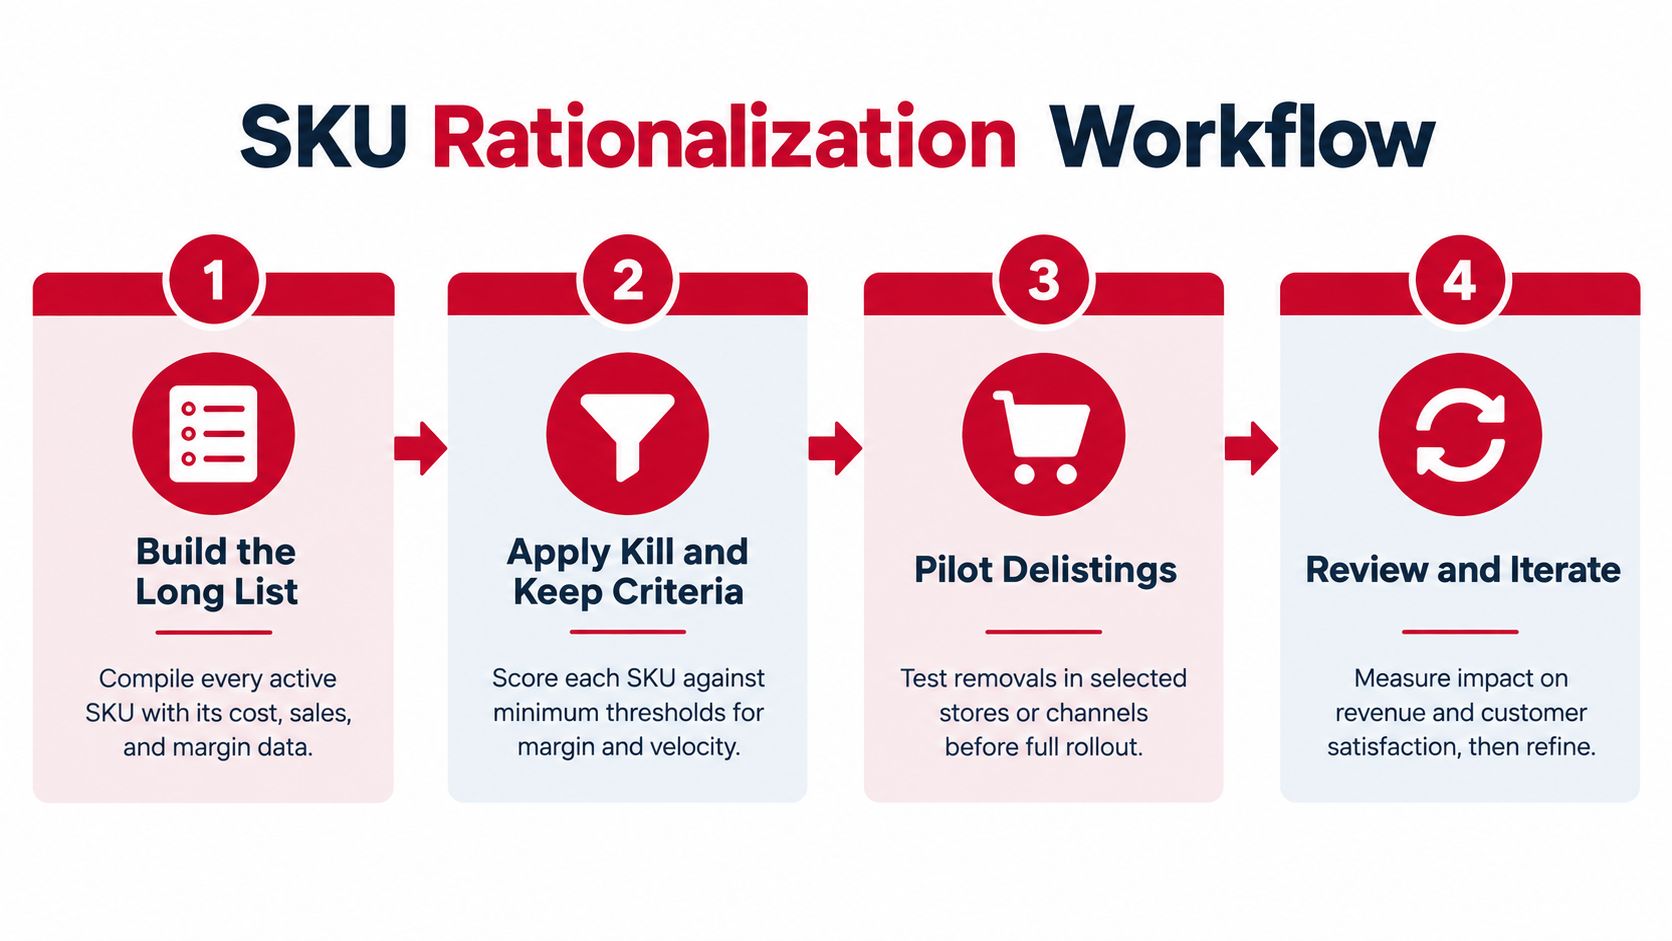
A SKU rationalization workflow should protect contribution margin without creating avoidable service failures. Run it in stages, by channel, and test removal before making it permanent.
Start with every active item in every channel. Include discontinued products still held in inventory, retailer-specific variants, bundles, samples, and inactive marketplace offers. Attach the Foundation data before ranking items, including channel costs, inventory exposure, and each SKU's strategic role.
Classify every item:
This classification prevents a high-velocity item from receiving automatic protection when its channel contribution is weak. It also gives the team a reason to preserve a low-volume SKU that recruits buyers or completes a price ladder.
Put a SKU into the kill queue when it has negative contribution for two consecutive quarters, weak retail distribution with low turnover, and no meaningful recruiting, retention, pricing, or channel role. Treat those criteria as a trigger for investigation before any deletion decision.
Check the fix before removing the item. A smaller pack, revised price, better content, or channel restriction may restore its economics. A profitable DTC product may fail on Amazon after fulfillment and advertising costs. A retailer-specific variant may justify its place through distribution economics even when direct velocity looks unimpressive.
Pilot delistings in selected stores, regions, or channels. Track substitution into core products, total category demand, repeat purchase, customer service contacts, retailer reorder behavior, and inventory service levels. Keep contingency inventory when removal could create a stockout or weaken an important account.
If the SKU supports a price ladder, test the replacement architecture before delisting it.
Practical rule: Delete the complexity before you delete the customer choice.
As the cohesion research showed earlier, profit benefits can arrive early after brand deletions, while revenue recovery may take three to five years (research on portfolio rationalization and cohesion). Do not judge a staged retirement from the first reporting cycle. Set a review window, then remove protection when the item continues to weaken cash conversion.
The final assortment should differ across Amazon, Walmart, DTC, wholesale, and distribution when customer behavior, fulfillment, pricing, and channel contribution differ.
Channel allocation turns SKU economics into channel roles. Keep one master catalog for governance, then build channel assortments around contribution margin, fulfillment requirements, customer behavior, and price structure.
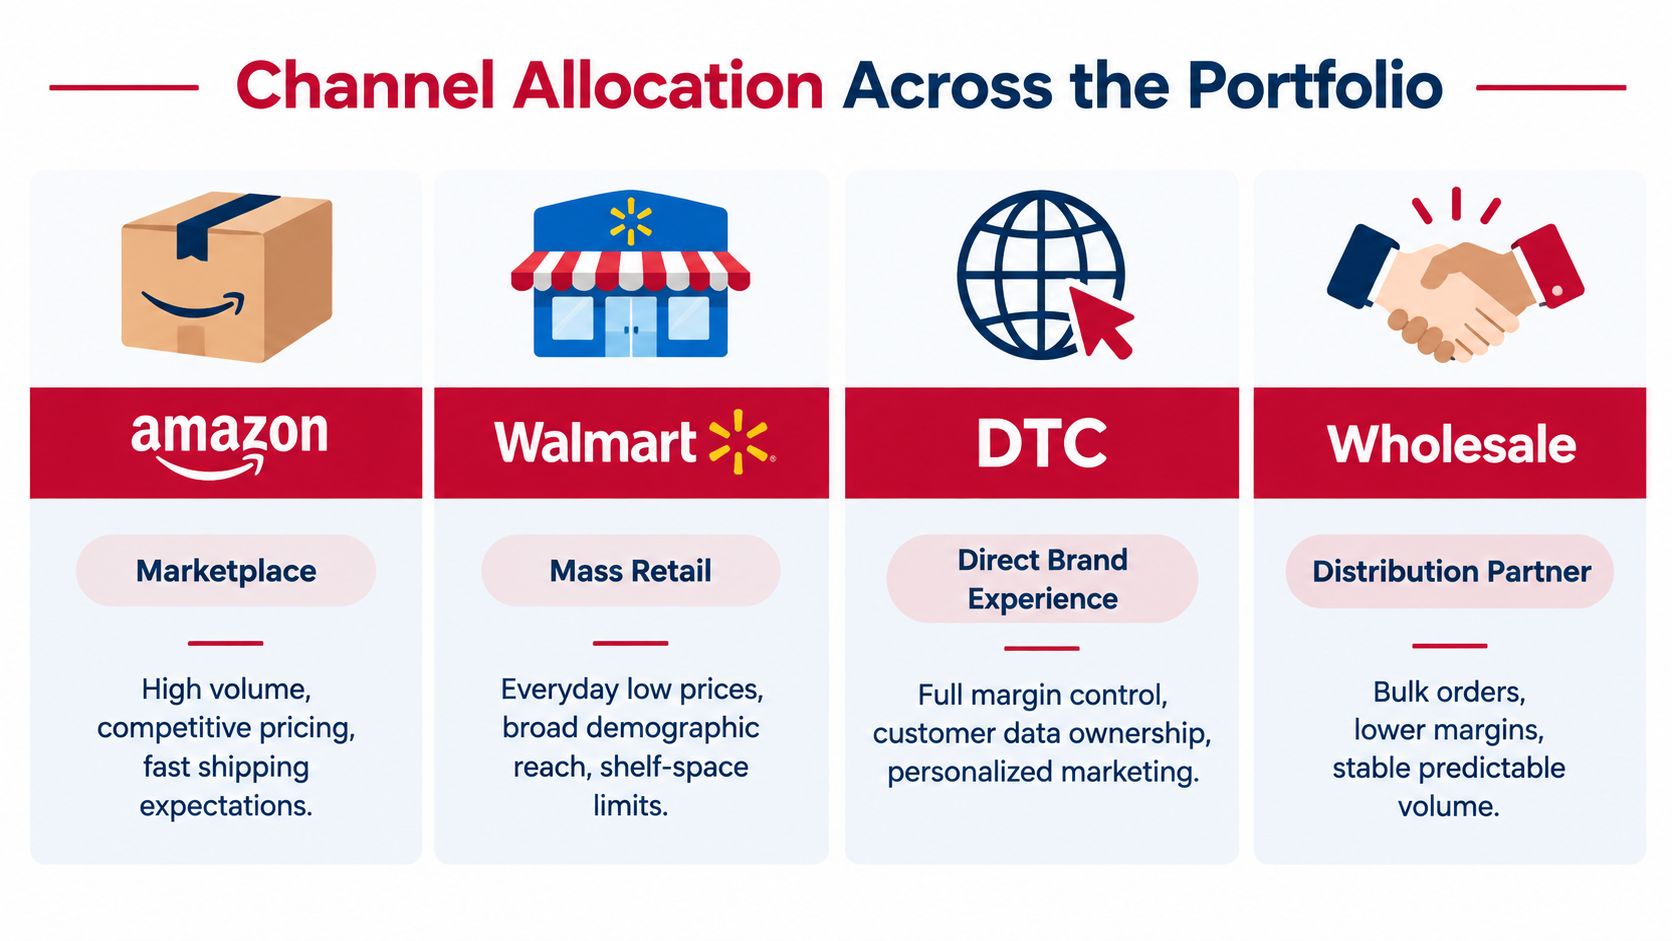
Amazon provides discovery, search demand, and high-volume fulfillment, while its cost stack includes referral fees, FBA, storage, advertising, coupons, returns, and periodic fee changes.
Amazon's 2026 schedule introduces a 3.5% fuel- and logistics-related surcharge on U.S. and Canadian FBA fulfillment fees beginning April 17, 2026, with holiday peak fulfillment fees scheduled to apply from October 15, 2026 through January 14, 2027 (Amazon's fulfillment fee update). A product with a $4.00 pre-ad contribution after product cost and referral fees would lose approximately $0.21 per unit from a 3.5% surcharge applied to a $6.00 fulfillment charge. Across 20,000 units, that removes about $4,200 before peak fees.
Review dimensions, packaging, replenishment timing, and price architecture before increasing advertising. More spend cannot repair weak unit economics.
Walmart can support volume and mass-retail positioning, but shelf-space limits and everyday pricing expectations demand a focused assortment. WFS suits compact products with reliable velocity. Model storage and carrying costs before committing slow-moving seasonal items.
DTC gives the brand control over merchandising and can support retention, bundles, and first-party customer economics where permitted. The channel also funds acquisition, customer support, pick-and-pack, and returns. A product that performs after marketplace fees can still lose money when paid acquisition is expensive or repeat demand is weak.
Wholesale and distribution can generate larger, more predictable orders and faster inventory movement. Gross margin may be lower, while trade terms can reduce net revenue. Use the channel to clear slow-moving inventory only when its contribution and working-capital release justify those terms. Do not turn a marketplace problem into a wholesale margin problem.
U.S. retail e-commerce sales reached $316.1 billion in the fourth quarter of 2025, up 1.7% from the prior quarter, according to the U.S. Census Bureau release. The figure confirms channel importance, not channel profitability.
Assign each channel a specific role, then measure incremental contribution after its full cost stack. Build the assortment in sequence: establish the Foundation with clean channel economics, optimize the portfolio by role and margin, then amplify the products that earn broader distribution.
A launch calendar without stage gates produces activity reports instead of decisions. The dashboard should force every portfolio review toward channel-level contribution margin, inventory exposure, and a clear action.
Track contribution margin by SKU and channel, days of supply, weighted retail distribution, advertising cost of sale, and cohesion. Each metric answers a management question and gives an owner a specific operating signal.
| KPI | Decision it supports |
|---|---|
| Contribution margin by SKU and channel | Keep, reprice, restrict, or retire |
| Days of supply and inventory velocity | Replenish, slow orders, or reduce exposure |
| Contribution-weighted distribution | Expand availability for items that can earn it |
| Advertising cost of sale | Separate paid growth from organic demand |
| Cohesion score | Protect navigation, architecture, and shopper understanding |
Distribution deserves close review. A census of more than 79,000 SKUs across 37 CPG categories, representing approximately $55 billion in annual revenue, found that the relationship between SKU market share and retail distribution was increasing and convex in 86% of categories (research on distribution and SKU market share). Broader availability generally supported disproportionately higher share, including among weaker SKUs within leading brands.
The finding does not justify expanding every item. Test whether a low-share SKU is weak because shoppers reject it or because the business has not built a viable route to availability. That distinction determines whether to improve the offer, change the channel, or stop funding distribution.
Use this dashboard guide for operations leaders to structure the reporting layer. Keep the dashboard operational. Every red metric needs an owner, a decision date, and a defined action.
Deloitte reported that 95% of surveyed consumer-products executives considered new products or services a priority in 2025, while 80% planned to increase product-innovation investment (Deloitte's 2025 consumer products outlook). That level of investment requires post-launch governance, not another launch presentation.
Set evidence gates at 30, 60, and 90 days:
A low-volume launch can still validate a premium tier, new format, audience, or channel. A high-revenue launch can harm the portfolio if it steals demand from a higher-margin core item or creates operational complexity. Contribution and strategic role must determine the decision.
Days 1 to 30, Foundation
Days 31 to 60, architecture and rationalization
Days 61 to 90, allocation and amplification
Run the portfolio in sequence: Foundation establishes reliable economics, Optimization improves roles and margin, and Amplification expands products that have earned broader distribution. Skipping Foundation or Optimization leaves the business paying to accelerate an offer that was never economically sound.
Reddog Consulting Group helps CPG founders and operators review contribution margin by SKU and channel, diagnose marketplace performance, and build practical portfolio growth plans. Book a free 30-minute working session with Reddog Consulting Group to work through margin, assortment, or channel allocation priorities.
Leave a comment: