
Published: March 2020 | Last Updated:November 2026
© Copyright 2026, Reddog Consulting Group.

Stop chasing a target ACoS. That popular advice is the fastest way to scale a losing SKU, because a percentage that looks efficient in Ads Console tells you nothing about what is left after landed cost, referral fees, FBA fulfillment, storage, discounts and returns.
A workable Amazon FBA PPC strategy starts in the opposite direction. You calculate what each SKU can afford to pay for an order, set that number as a ceiling, and only then decide bids, campaign structure and budget. Launch, ranking and clearance work can run above that ceiling, but only with a named reason, a fixed cap and an exit date.
I would treat PPC as a margin decision first and a traffic decision second. If the unit economics don't support the click, better keywords won't fix the order.
ACoS is a guardrail, not a goal. A 25% ACoS can be profitable on one SKU and destructive on the next, even when both sit in the same campaign and convert at the same rate. The ceiling has to come from the SKU, not from Ads Console.
Amazon's ACoS guide defines advertising cost of sales as ad spend divided by ad revenue, multiplied by 100, so $50 in PPC spend producing $100 in attributed sales equals a 50% ACoS. That formula tells you what the click cost relative to the sale. It only becomes a decision rule when you compare it with what the product keeps before advertising.
Use this formula for every active ASIN:
Break-even ACoS = contribution dollars before advertising ÷ selling price
Contribution before advertising means price minus landed product cost, referral fees, FBA fulfillment, storage allocation, discounts, coupons, expected returns and any per-unit overhead you assign at SKU level. If you need the underlying math laid out in order, this guide to how to calculate contribution margin walks through the inputs sellers most often miss.
Take a product that sells for $30 and leaves $12 after non-ad selling costs. Its break-even ACoS is 40%. At 40%, advertising consumes the full $12 and the attributed order contributes zero before fixed costs. Above 40%, the order loses money on contribution. Below 40%, it leaves something behind.
That matters because percentages hide dollars. Put the same 40% ACoS on a $25 item that leaves only $5 before ads. The ad cost on an attributed order is $10, so you lose $5 per order while reporting an identical ACoS. Account-level targets allow one strong SKU to mask several weak ones for weeks. Set the ceiling per SKU instead, then set bids to respect it.
| SKU profile | Selling price | Contribution before ads | Break-even ACoS | Spend posture |
|---|---|---|---|---|
| Launch item | $30 | $12 | 40% | Launch and ranking, capped spend |
| Mature item | $25 | $5 | 20% | Harvest only, bids at or below ceiling |
| Excess stock | $20 | $3 | 15% | Clearance window with weekly review |
| Low-price accessory | $18 | $6 | 33% | Ranking bids within ceiling |
The table is permission to spend with limits, not an order to hold every campaign under its ceiling. A launch campaign may run above break-even to build indexed search terms, early reviews and organic rank. Treat that as a planned subsidy with a daily cap, a review date and a clear condition for stopping. Without those three controls, testing becomes leakage.
A harvest campaign gets stricter treatment. If a proven exact-match term cannot convert at or below the ceiling, the constraint is usually price, conversion rate, fee load or bid. It is rarely traffic volume. Raising the bid buys the loss faster, while fixing the listing or repricing the offer can bring the term back inside the ceiling without extra spend.
Practical rule: If a campaign runs above break-even, write the reason and the exit date next to it. If you can't name both, bring the bid back under the ceiling.
This same discipline applies to any channel where platform-reported returns flatter performance, because attributed revenue still has to survive product costs and fees before it becomes profit, a point explained in evaluating meme advertising beyond pixel reporting.
Do the unglamorous work first. Calculate the ceiling for every active ASIN, put it beside the campaign name in your tracker, and force every bid change to reference that number. That single habit turns PPC from rented sales into a margin decision you can defend, scale, or stop.
One SKU should not carry one permanent campaign role. A product moves through launch, ranking, harvest and defense, and each stage buys a different outcome. Discovery buys information, ranking buys visibility on proven terms, harvest buys contribution, and defense buys protection on branded search.
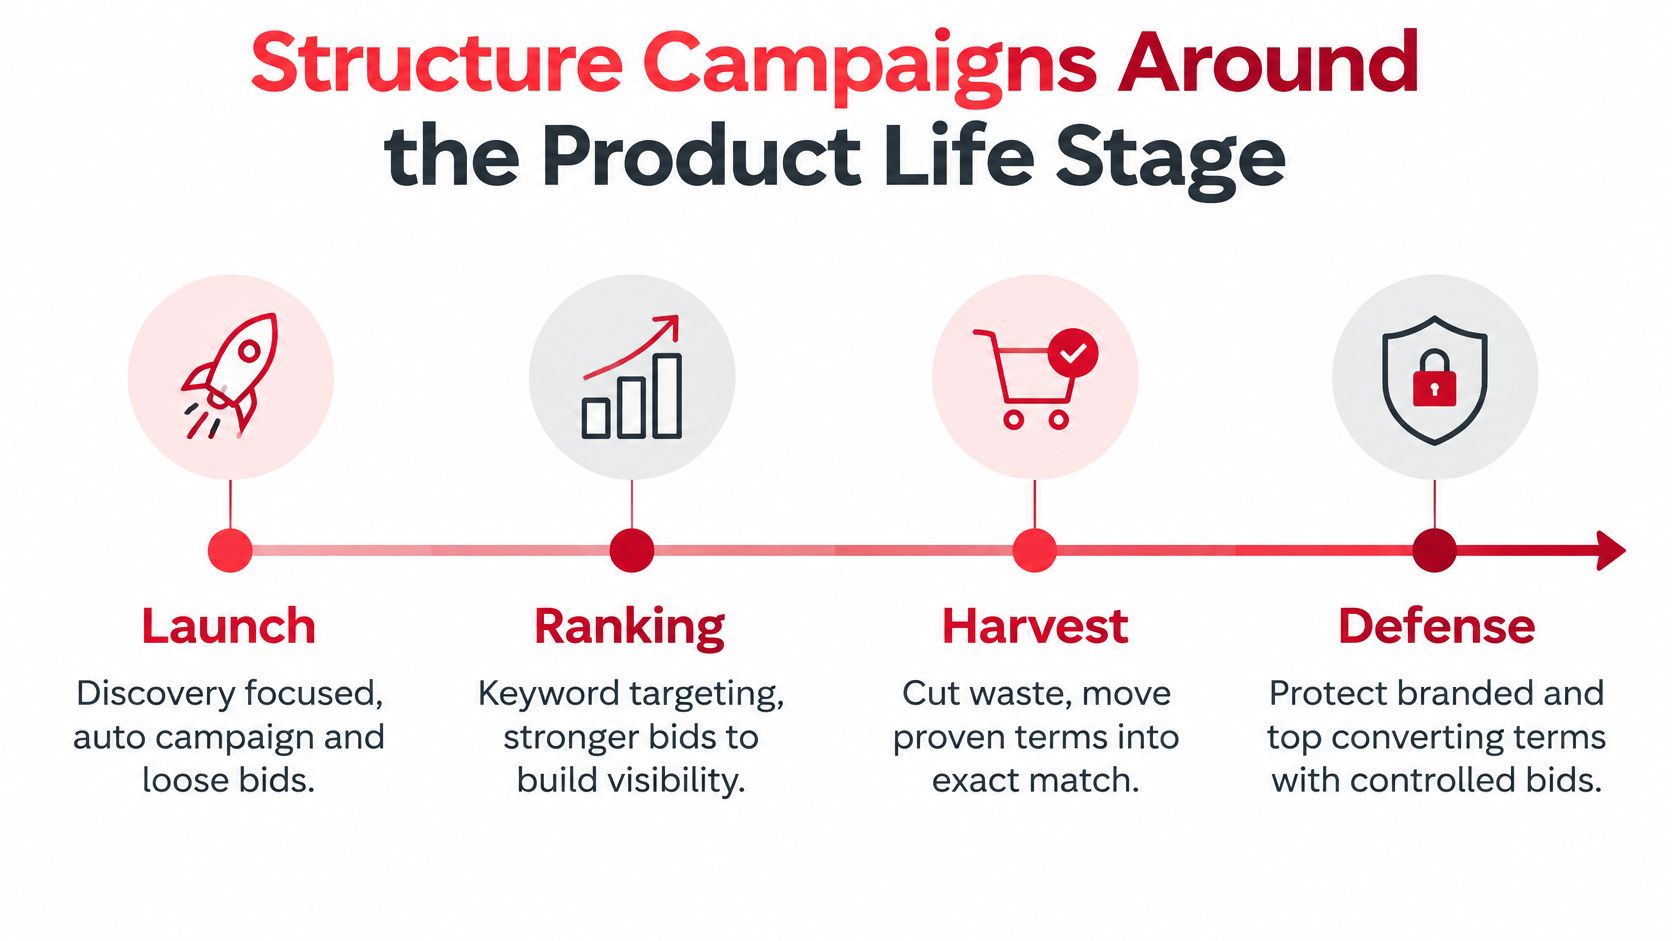
Mix those roles in one campaign and the reporting stops making sense. Branded terms make discovery look efficient, broad terms drag down harvest, and budget flows to whichever term spends fastest rather than whichever stage needs funding.
| Stage | Campaign type | ACoS guardrail | Budget rule | Exit signal |
|---|---|---|---|---|
| Launch discovery | Auto and broad | Not a bid target; capped by daily budget and exit date | Fixed daily cap per SKU | Terms with orders identified after 2-3 weeks |
| Ranking | Exact match on converting terms | At or below break-even | Budget follows converting terms | Rank holds for two weeks without the ad |
| Harvest | Exact and phrase on proven terms | About 80% of break-even | Share of account budget | Term stops converting for 14 days, then negate |
| Defensive branded | Branded exact | Set separately, reviewed quarterly | Fixed daily cap | Competitor conversions on brand terms fall |
The 80% of break-even harvest guardrail leaves a buffer for fee variance, returns and normal conversion swings. Ranking can sit closer to the ceiling because you're buying position on terms that already convert. Discovery is different. Its guardrail is cash and time, not an ACoS target it probably can't meet while it is still learning which queries matter.
Say a new CPG line has three SKUs priced between $18 and $26. Each gets its own automatic discovery campaign with a fixed daily cap. You don't pool the budget, because the strongest listing would consume the learning spend and leave the other two without usable search term data.
After two to three weeks, terms with orders move into exact-match ranking campaigns. The discovery campaigns continue at a lower cap to keep finding language buyers use. Once organic rank holds for a term without paid support, budget shifts toward harvest and the bid comes down to protect contribution.
The branded campaign runs separately from the start. Its job isn't to prove PPC is profitable. Its job is to stop a competitor from sitting above you when a shopper searches your brand name. Judge it on whether competitor conversions on your terms fall, and review the spend quarterly so defense doesn't become a tax on orders you'd have won anyway.
Stage changes should happen on a date and a metric, never on a feeling. Discovery ends when converting terms are identified. Ranking ends when position holds without the ad. Harvest ends for a term when it stops converting. Write those signals down before launch, because in the moment it's always tempting to give a campaign one more week.
Keyword lists built from seller intuition usually reflect how the brand talks, not how buyers search. Search term reports correct that bias. They show the exact language that produced clicks and orders on your listing, at your price, against your current competitors.
Before you buy that traffic, fix the listing. Product listings are optimized by refining titles, descriptions, keywords, and images, and weak indexing wastes discovery spend because Amazon can't match the product to relevant queries reliably. Our breakdown of how to find Amazon keywords covers the research side, but paid discovery only works when the detail page can convert the click it buys.
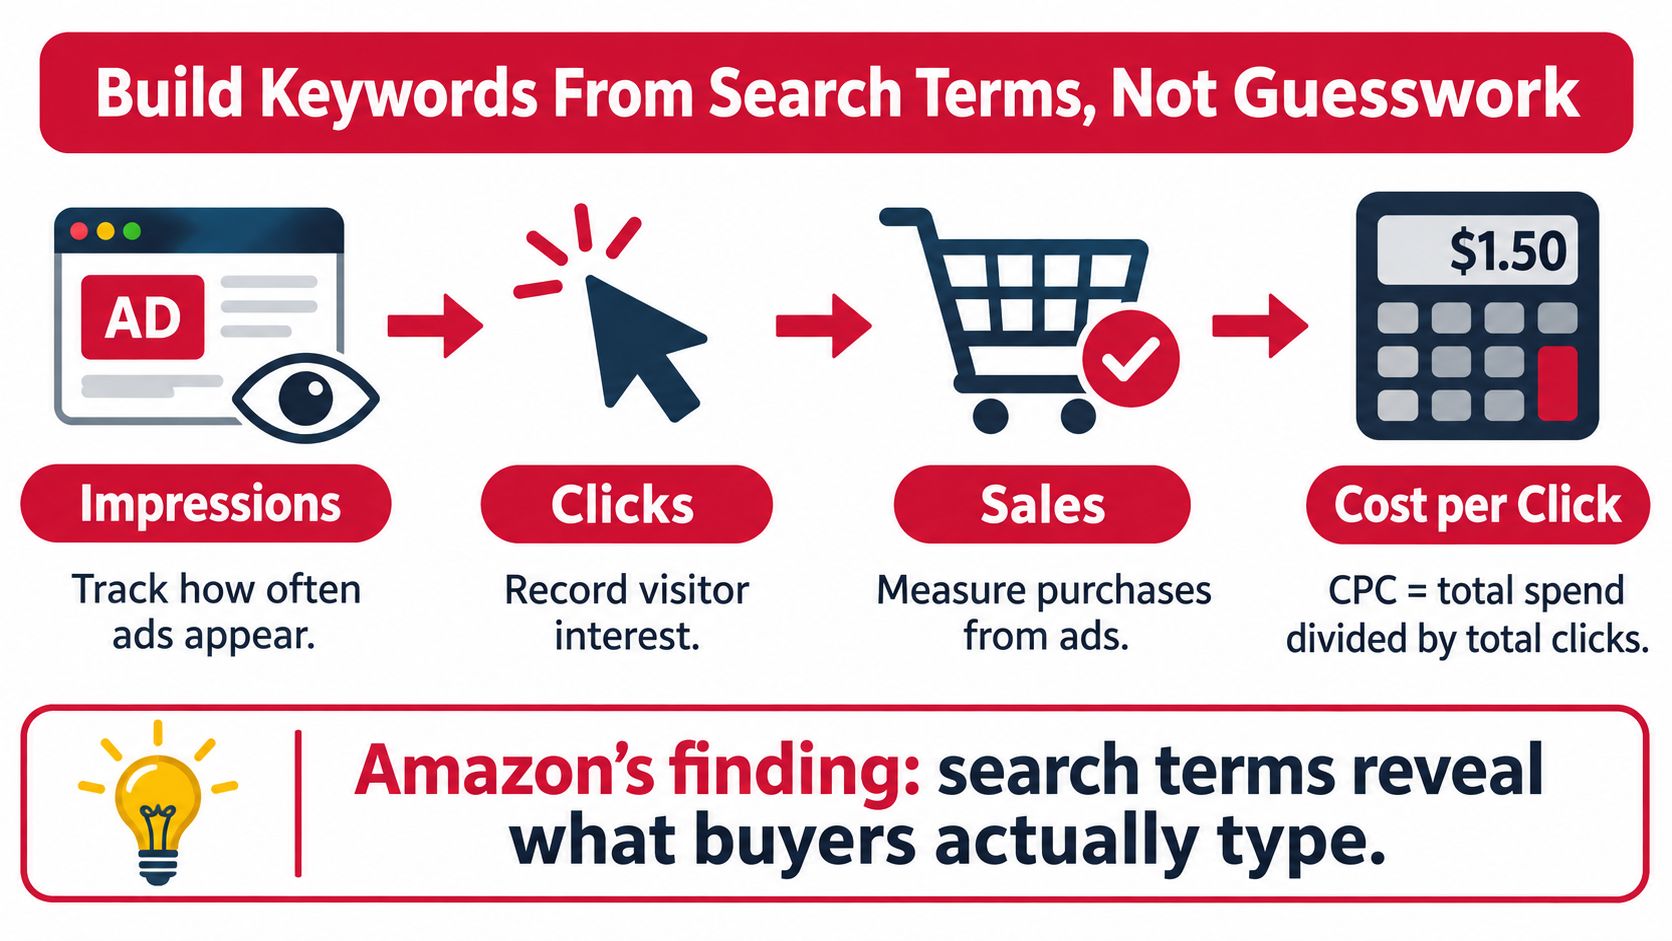
Amazon's Sponsored Products best practices guide tells advertisers to monitor impressions, clicks, sales, and cost per click, with cost per click calculated as total advertising spend divided by total clicks. The same guidance reported that products Amazon suggested for advertising were 321 times more likely to generate ad-attributed sales than products that were not suggested, based on worldwide internal data from December 2021 through May 2023 among sellers whose campaigns ran for at least six months. Treat that as a directional signal about product readiness, not a promise of return.
Keep discovery running until exact-match campaigns carry most non-branded orders. Cutting it too early freezes your keyword set around the first terms that happened to convert, while competitors keep finding cheaper language.
Say a SKU holds 120 days of supply and earns $3 before advertising. A temporary campaign that leaves $2.50 of contribution after ads looks weak beside a harvest campaign, but it may be the right call if it avoids larger storage, removal, markdown or expiry costs. You're comparing an ad loss against the cost of holding the units, not against perfection.
That logic flips when stock is tight. Aggressive bids on a SKU with constrained replenishment or short shelf life can clear the last saleable units, break rank continuity and leave you paying to relaunch a listing that was already working.
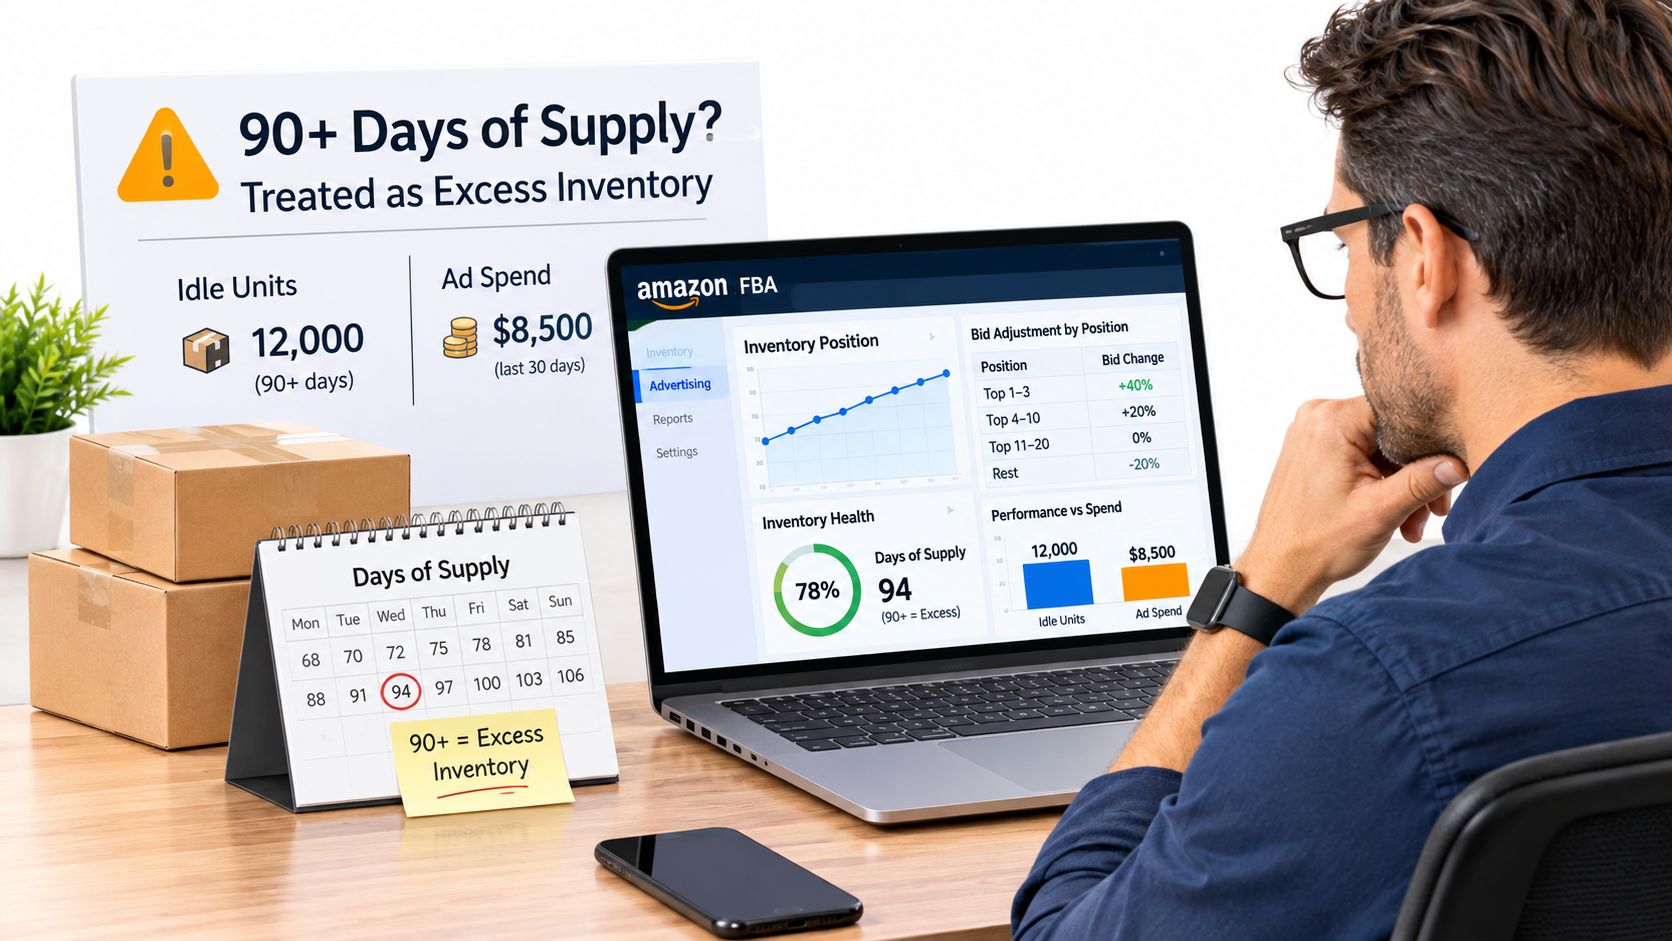
Amazon's FBA inventory guidance considers inventory excess when an item has more than 90 days of supply based on forecasted demand, and describes excess units as inventory where leaving the product idle and paying storage is more expensive than action such as a markdown or removal. Its calculation considers demand, product costs and fees, which is exactly the comparison your bid decision should make.
| Days of supply | Classification | Bid posture | Budget rule |
|---|---|---|---|
| Under 14 days | Stockout risk | Hold bids to protect remaining stock; pause if stock runs out | Reduce to replenishment-safe level |
| 14-30 days | Fast-moving | Bid at break-even to hold rank | Daily budget matched to replenishment rate |
| 30-90 days | Healthy | Bid at about 80% of break-even as a buffer | Steady daily budget |
| Over 90 days | Excess | Bid above break-even only if avoided storage and removal costs exceed the ad loss | Time-boxed, reviewed weekly |
Pacing matters as much as bid level. If replenishment supports a certain unit rate per day, set the daily budget so paid demand slows before stock enters the replenishment window. A campaign that sells through three weeks of inventory in nine days hasn't outperformed. It has created a stockout.
For the operational side of that discipline, our guide to manage inventory on Amazon connects reorder timing with marketplace availability. The PPC rule is simpler. Review days of supply weekly for every advertised SKU, move each one into a band, and apply that band's bid and budget rule.
Pausing ads to protect stock is not lost momentum. Running out of stock is.
Excess stock deserves the most scrutiny. Increasing bids can improve sell-through, but buying demand at a bad ACoS may convert storage expense into advertising expense. Run the comparison in dollars per unit, time-box the clearance push, and review it weekly against actual storage exposure.
A campaign spends $5 and generates $25 in attributed sales. That's a 20% ACoS, and it tells you almost nothing by itself. If the product leaves $5 before advertising, the campaign is exactly at break-even before fixed operating costs. If it leaves $3, the same respectable looking 20% destroys $2 on every order.
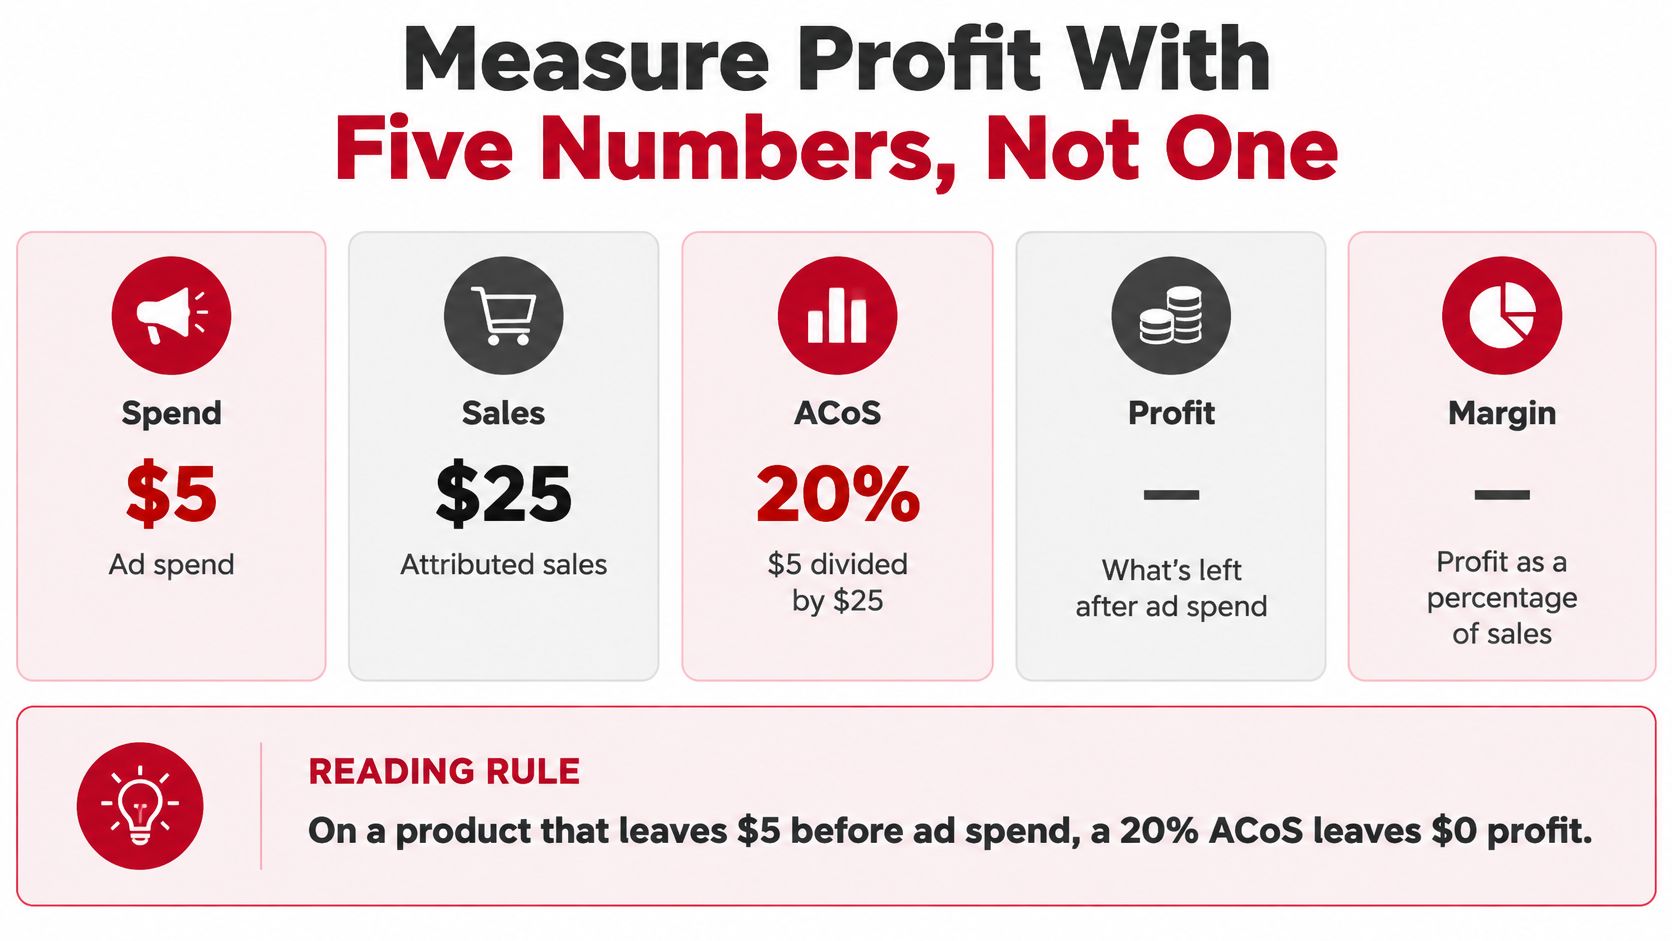
Amazon's advertising FAQ defines ACoS as a campaign efficiency measure based on attributed ad revenue rather than total business profit. That distinction matters most when campaigns defend branded search, launch products or support promotions, because the attributed number can look efficient while total contribution falls.
| Metric | Calculation | What it tells you | Where it misleads |
|---|---|---|---|
| ACoS | Ad spend ÷ attributed ad sales | Efficiency of ad-attributed sales | Ignores COGS, fees and organic halo |
| ROAS | Attributed ad sales ÷ ad spend | Same signal as ACoS, inverted | Same blind spots; no margin view |
| TACoS | Total ad spend ÷ total sales | Ad dependence of the whole account | Hides which SKUs or campaigns drive it |
| Contribution after ads | Sales − COGS − fees − ad spend | Profit per order after advertising | Needs clean SKU cost data; slower to review |
| Break-even ACoS | Contribution before ads ÷ price | Ceiling for each SKU's bids | Breaks when fees or prices change |
Report at least three views side by side for every active SKU: attributed ACoS, total advertising cost as a percentage of total marketplace sales, and contribution after advertising. ACoS shows campaign efficiency, TACoS shows dependence, and contribution shows whether the business kept any money.
The trade-off is predictable. Optimizing only for lower ACoS shifts budget toward easy branded conversions and starves non-brand discovery. Optimizing only for sales hides fee compression and inventory risk. Other channels have the same attribution trap, which is why assessments such as TikTok advertising performance in 2026 are useful only when platform returns are reconciled with margin.
Judge campaigns on the contribution line. A high ACoS non-brand campaign can still be rational during Amplification if it brings incremental customers, supports repeat purchase or clears stock before aged fees build. But you should be able to point to that benefit in total sales and contribution, not just in attributed revenue.
A $0.25 fee increase can erase 10% of contribution on a low margin CPG SKU before a single click is bought. Amazon's 2026 US FBA fee summary states that average FBA fulfillment fees increase by $0.08 per unit sold, including an average $0.25 increase for small standard-size products priced from $10 to $50. On an item with only $2.50 of pre-ad contribution, that change resets the ceiling for every bid.
Historical ACoS targets do not adjust for that reset. Automation keeps bidding against the old margin, and higher spend multiplies the error across more units.
Set the ceiling from SKU contribution after referral fees, FBA fees, storage and inventory position. I recommend treating that contribution number as the control, with automation allowed to optimize only inside it.
Fee and storage changes: Fulfillment fees vary by size and shipping weight, while monthly storage is based on daily average inventory volume. Recalculate every advertised SKU after each published fee update, not once a year.
Aged inventory and overage charges: Amazon applies aged-inventory surcharges and can charge an overage fee when inventory exceeds a storage limit. A slow SKU can turn from low profit to active cost while PPC reporting still looks stable. Contribution after ads catches the shift. Attributed ACoS does not.
Automation chasing branded efficiency: Automated bidding raises bids on terms that already convert, which are often branded. The account looks efficient while new customer discovery stalls and you pay more for demand you already owned.
Scaling a compressed SKU: Traffic growth on a product whose contribution already dropped locks in the lower margin at higher volume. Set a bid ceiling from current contribution that automation cannot exceed.
Borrowed organic halo: Some lift disappears when ads switch off. Run holdout tests on a sample of terms before treating paid rank support as permanent organic gain.
Cash trapped in velocity: Ad-driven sales can pull inventory forward faster than replenishment and cash flow can support. A daily cap per SKU works as a working capital control, not only a media setting.
Single dashboard attribution often looks clean while true economics are weaker, a pattern also discussed in coverage of why Shopify analytics can mislead when traffic quality is not checked against business outcomes. Judge the account on contribution after ads, with ACoS and total ad cost used as supporting views.
Operator check: Automation should optimize inside guardrails you set from margin, inventory and cash. It should not set those guardrails for you.
Seasonal events add one more distortion. Auction conditions during a major event can produce efficiency that does not survive normal weeks, so event performance should not justify permanent bid increases. Recalculate unit economics in Foundation before increasing traffic. Tighten ceilings and caps through Optimization. Only then does scaling test demand instead of testing how much margin volume can remove.
A stronger attributed sales line is not permission to raise spend. If contribution after referral fees, FBA fees, storage, and ads is flat or falling, more traffic only multiplies a weak unit. I treat scale as a go or no-go on that SKU, not on how clean the campaign report looks.
Work the check in this order, and stop at the first fail.
That sequence follows Foundation, Optimization & Expansion, and Amplification. Foundation builds the base for operations, sales, and marketing. Optimization & Expansion improves and scales what already holds. Amplification drives awareness, engagement, and conversions through targeted marketing. Extra PPC spend belongs in that third stage, after unit economics, listings, and inventory rules still hold in ordinary weeks.
If reports show growth while contribution does not, Reddog Consulting Group offers a free initial consultation before sign-up. It assesses your current retail strategy and outlines how the work can support the business. Bring your SKU list with prices, fees, and days of supply, and arrange that consultation before the next budget increase.
Leave a comment: