
Published: March 2020 | Last Updated:July 2026
© Copyright 2026, Reddog Consulting Group.

TL;DR:
- SKU rationalization is a data-driven process that reviews product portfolios to improve profit and operational efficiency.
- It significantly boosts margins and reduces complexity, leading to faster production, lower costs, and higher customer satisfaction.
SKU rationalization is defined as the structured, data-driven process of reviewing every stock-keeping unit in a product portfolio to decide which items to keep, fix, or remove based on their true contribution to profit and operational efficiency. The industry also calls this process portfolio pruning or SKU optimization. Done correctly, it is one of the highest-return activities a CPG brand or retailer can execute. Well-executed programs improve operating margins by 4–7 percentage points while preserving 90–95% of total revenue. That combination of margin lift and revenue retention is rare in retail, and it explains why SKU rationalization has moved from a cost-cutting tactic to a core growth discipline.
SKU rationalization is an evidence-based portfolio review, not a forward-looking product launch plan. It connects front-of-house shopper behavior with back-of-house operational realities like picking accuracy, storage costs, and handling complexity. That distinction matters because most brands track sales velocity but ignore what it actually costs to fulfill each unit.

The core question SKU rationalization answers is simple: does this product make money after every cost is counted? A SKU can show strong gross revenue while quietly destroying margin through Amazon FBA fees, 3PL storage charges, excess handling, and markdown risk. Brands that skip this analysis often discover they are working harder to sell products that make them poorer.
For eCommerce and CPG operators, the stakes are especially high. Marketplace fees, freight costs, and retail slotting charges vary by channel and by SKU size, weight, and velocity. A product that earns solid margin in direct-to-consumer may be a money loser on Walmart WFS. SKU rationalization forces that channel-level math into the open.
The financial case for rationalizing product lines is direct. McKinsey research shows SKU reduction programs improve gross margin by 2–4 percentage points on average. For a brand doing $5M in revenue, that is $100,000–$200,000 in recovered margin without adding a single new customer.
Operational gains are equally significant. Portfolio simplification projects for consumer brands unlock 14% production capacity and can generate over $10M in annual EBIT improvement at scale. That freed capacity translates directly into faster production runs, lower changeover costs, and better fill rates on the SKUs that actually sell.
The benefits extend beyond the income statement:
The EBIT improvement figure deserves emphasis. Brands often treat SKU proliferation as a revenue strategy, assuming more options equal more sales. The data says otherwise. Complexity costs accumulate across procurement, warehousing, marketing, and customer service. Removing that complexity releases cash that was invisible on the P&L.
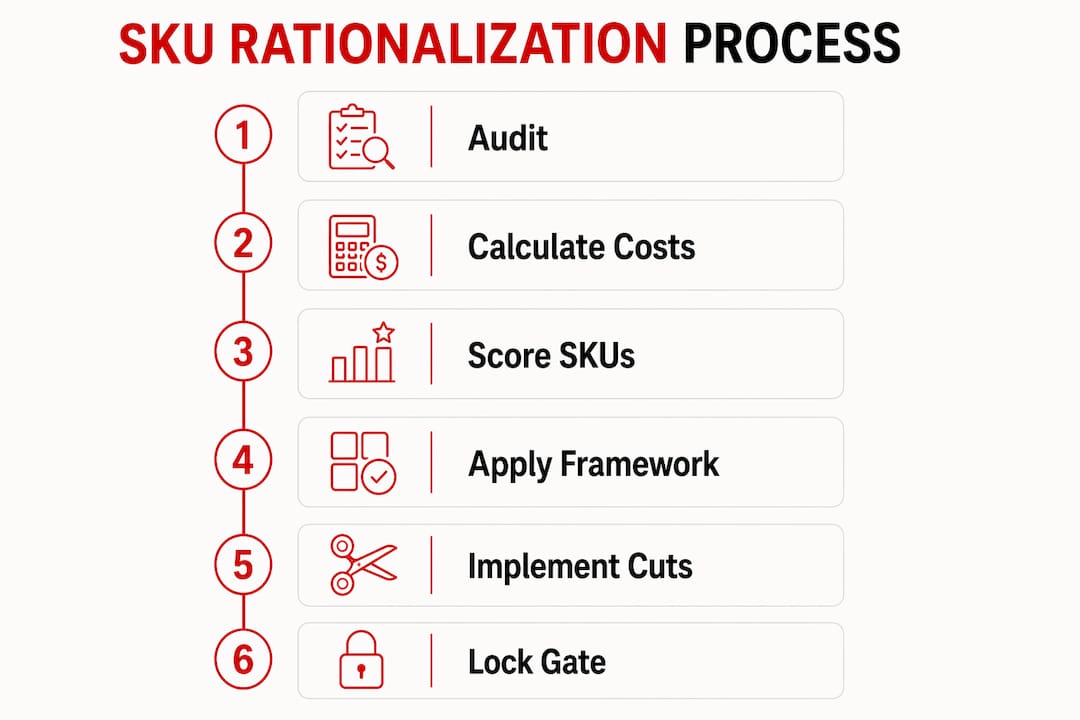
The 7-step SKU rationalization playbook provides a repeatable framework: audit SKU-level P&Ls, calculate cost-to-serve, score each SKU on a keep-or-cut grid, map substitution options, make informed decisions, execute phased discontinuations, and schedule ongoing reviews. Each step builds on the last, so skipping the audit phase guarantees bad decisions downstream.
The most practical scoring tool is a four-category classification system:
Contribution margin after channel fees is the veto metric in this framework. A SKU with negative contribution margin should be cut regardless of its velocity score, brand heritage, or sales team attachment. High velocity on a money-losing SKU does not recover losses. It accelerates them.
The Fix category is where most rationalization projects stall. Teams assign a SKU to Fix, set a vague intention to improve it, and revisit it six months later with no progress. The solution is a strict time-bound gate: if a Fix SKU does not hit its margin target within 90 days, it automatically moves to Cut. No exceptions.
Pro Tip: Build the Fix-to-Cut escalation rule into your governance document before the project starts. Once the review is underway, emotional attachment to specific SKUs will push back against any rule that feels arbitrary. A pre-agreed protocol removes the argument.
The final step in any rationalization process is preventing new complexity from creeping back in. Without strict new-product introduction thresholds, SKU proliferation rebounds and negates the gains within 18–24 months. Every new SKU proposal should require a business case that includes projected contribution margin, cost-to-serve estimate, and a named SKU it will replace or justify adding alongside.
The right metrics separate a genuine SKU rationalization from a gut-feel product cull. The table below summarizes the core data points every operator needs before making a keep-or-cut decision.
| Metric | Definition | Decision implication |
|---|---|---|
| Contribution margin after channel fees | Revenue minus COGS, marketplace fees, freight, and returns | The primary veto metric; negative CM means cut |
| Days of inventory on hand | Average inventory divided by daily sales rate | High days signal slow velocity or overbuying |
| Sales trend (13-week vs. 52-week) | Short-term vs. long-term velocity comparison | Declining trend flags Watch or Fix candidates |
| Total cost-to-serve | All costs to deliver a unit to the customer, forming direct product profitability | Reveals hidden margin drag invisible in gross profit |
| Transferable demand rate | Estimated share of demand that shifts to other SKUs if this one is cut | Protects revenue when removing a SKU |
Total cost-to-serve is the metric most brands underuse. It captures not just COGS and fees but also picking labor, packaging materials, damage rates, and return processing. A SKU that looks profitable at the gross margin line can turn negative once these costs are allocated correctly.
Transferable demand analysis is equally critical before executing any cut. It estimates what percentage of a discontinued SKU’s demand will shift to other products in the portfolio. Brands that skip this step often cut a SKU, lose the revenue entirely, and conclude that rationalization hurt sales. The revenue did not disappear because of the cut. It disappeared because no substitute was positioned to catch it.
Pro Tip: Run your transferable demand model before you announce any discontinuation internally. Once a cut is public, retail buyers and marketplace algorithms begin adjusting, and you lose the ability to test substitution quietly.
For eCommerce operators, optimizing product pages for the SKUs you keep is as important as the cuts themselves. A tighter catalog only delivers margin if the remaining products convert efficiently.
A one-time rationalization project delivers a short-term margin lift. A sustained program builds a permanently healthier portfolio. The difference lies in governance.
The practices that separate brands that hold their gains from those that revert within two years:
Pro Tip: Tie SKU portfolio health metrics to your quarterly business review agenda, not just to a separate inventory meeting. When the CEO and CFO see contribution margin by SKU alongside revenue, the conversation about cuts becomes much easier.
The most common pitfall after a successful rationalization is treating it as a completed project. Locking the gate on new SKU introductions is not a one-time decision. It is an ongoing discipline that requires the same rigor as the original review.
SKU rationalization delivers lasting margin improvement only when contribution margin after channel fees drives every keep-or-cut decision, and when governance structures prevent new complexity from rebuilding.
| Point | Details |
|---|---|
| Contribution margin is the veto metric | Cut any SKU with negative CM after channel fees, regardless of velocity or brand history. |
| Margin gains are measurable and significant | Well-run programs improve operating margins by 4–7 percentage points while retaining most revenue. |
| Total cost-to-serve reveals hidden losses | Gross profit alone misses picking, storage, and return costs that can flip a SKU from profitable to negative. |
| Transferable demand protects revenue | Model demand transfer before any cut to avoid losing sales that could shift to substitute products. |
| Governance sustains the gains | Quarterly reviews and new-product introduction gates prevent SKU proliferation from rebuilding within 18–24 months. |
The hardest part of SKU rationalization is not the analysis. The data almost always tells a clear story. The hard part is acting on it when a SKU has a vocal internal champion, a long sales history, or a founder’s personal attachment.
At Reddog, we see this pattern repeatedly with growth-stage CPG brands. A SKU that launched the company, or one that a key retail buyer once requested, gets protected long after the numbers say cut it. The team frames the decision as a loyalty question rather than a math question. That framing is expensive.
The fix is to make the math non-negotiable before the conversation starts. When the Keep/Watch/Fix/Cut framework is agreed upon in advance, and when the contribution margin threshold is set before anyone looks at specific SKUs, the emotional argument loses its footing. The rule applies to every SKU equally, including the founder’s favorite.
SKU rationalization also requires separating the review from the people who sell the products. Sales teams are rewarded for revenue, not margin. Asking them to lead a rationalization is like asking someone to grade their own exam. Finance and operations need equal weight in the decision, and an external perspective often breaks the internal deadlock faster than any internal process can.
The brands that build rationalization into their quarterly rhythm, rather than treating it as a crisis response, consistently outperform those that wait until margin pressure forces the issue.
— Reddog

Reddog works with CPG brands in the $500K–$20M revenue range that need to understand exactly where their margin is going and which products are carrying the portfolio versus dragging it down. Our work covers omnichannel growth across Amazon, Walmart, DTC, wholesale, and distribution, with contribution-margin-first analysis at the center of every engagement.
We help operators build the SKU scoring frameworks, cost-to-serve models, and governance structures that make rationalization stick. The goal is not just a one-time cleanup. It is a permanent improvement in how your portfolio earns.
If you want a practical, no-pressure review of your SKU portfolio, contribution margin by channel, or inventory velocity, book a free 30-minute strategy call with the Reddog team. We will focus on the numbers that matter most to your next stage of growth.
SKU rationalization is the process of reviewing every product in your portfolio and deciding which ones to keep, improve, or remove based on their true profitability and operational cost. The goal is a tighter assortment that earns more margin per unit sold.
SKU rationalization is an evidence-based review of existing products, focused on cutting what is not working. Assortment planning is a forward-looking process for deciding which new products to introduce. The two processes are related but serve different purposes.
Contribution margin after channel fees is the primary metric. Any SKU with negative or near-zero contribution margin after accounting for marketplace fees, freight, and returns should be cut regardless of its sales volume.
A formal review should run at least once per year, with lighter quarterly check-ins to catch Watch and Fix SKUs before they deteriorate further. Brands that wait for a margin crisis to trigger the review typically face harder cuts with less time to manage them.
Cutting SKUs can reduce revenue short-term if transferable demand analysis is skipped. When substitute products are properly positioned before a discontinuation, most demand shifts within the portfolio and total revenue holds while margin improves.
Leave a comment: