Published: March 2020 | Last Updated:June 2026
© Copyright 2026, Reddog Consulting Group.

TL;DR:
- ROAS measures revenue earned for every dollar spent on ads and is a key indicator of ad efficiency. A 4:1 ratio is the industry benchmark for strong eCommerce performance, but it does not guarantee profitability without considering costs and margins. Accurate measurement requires server-side data, understanding of context, and combining ROAS with other metrics like contribution margin and MER.
Return on Advertising Spend (ROAS) is defined as the revenue a business earns for every dollar spent on advertising. A 4:1 ratio is the strong benchmark for eCommerce, meaning $4 in revenue for every $1 spent on ads. Below a 1:1 ratio, a campaign is losing money on ad spend alone. Understanding what is ROAS, how to calculate it, and what it actually tells you about profitability separates brands that scale from brands that bleed cash on ads.
ROAS is the standard KPI for measuring ad revenue efficiency across paid channels including Amazon Sponsored Products, Meta, and Google Shopping. It answers one direct question: how much revenue did this ad spend generate? That answer drives budget allocation, bid strategy, and channel prioritization.
The ROAS definition is straightforward. Divide total attributed ad revenue by total ad spend. If a campaign generates $10,000 in revenue from $2,500 in ad spend, ROAS is 4.0. That 4:1 result sits at the industry benchmark for strong eCommerce performance.
ROAS matters because it is the fastest signal for whether a campaign is working. A brand running five ad campaigns simultaneously can use ROAS to identify which two are carrying the budget and which three are dragging it down. Without this metric, ad spend decisions rely on gut feel rather than data.

One critical caveat: ROAS measures revenue, not profit. A campaign with a 5:1 ROAS can still produce a negative margin if product costs, shipping, and fees consume the revenue. That distinction shapes how you set targets, which the next sections cover in detail.
The ROAS formula has two inputs: total attributed ad revenue and total ad spend. Getting both numbers right is where most marketers make mistakes.
ROAS = Total Attributed Ad Revenue ÷ Total Ad Spend
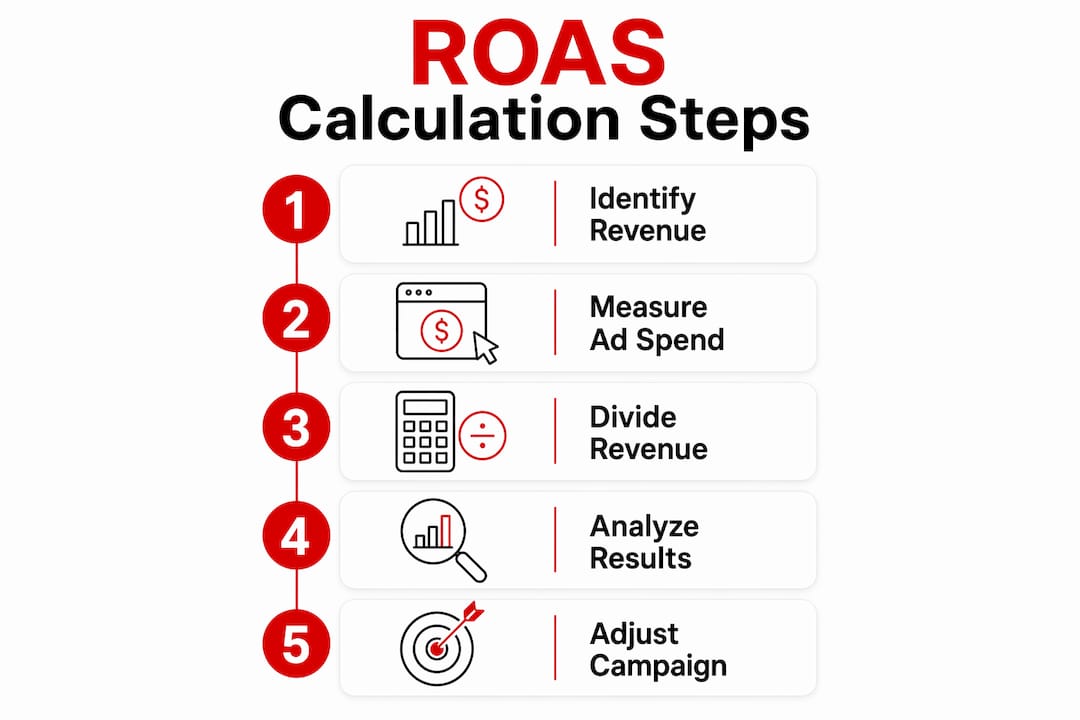
Follow these steps to calculate it correctly:
In-platform reporting overstates ROAS by 15–40% compared to server-side attribution, particularly on iOS-heavy traffic. That gap exists because Apple’s App Tracking Transparency framework limits the signals ad platforms can collect. A campaign that looks like a 6.0 ROAS in Meta Ads Manager may be closer to a 4.0 when measured through server-side data.
Server-side tracking sends conversion data directly from your server to the ad platform, bypassing browser and device restrictions. This produces a more accurate revenue figure for the denominator in your ROAS calculation.
Pro Tip: Always cross-reference in-platform ROAS with your own analytics or a server-side pixel before making budget decisions. The platform number is a starting point, not the final answer.
A ROAS of 4:1 is the widely cited benchmark for eCommerce, but that number is not universal. The right target depends on your margins, your cost structure, and your growth stage.
Here is how to interpret common ROAS ranges:
A campaign can show a healthy ROAS and still produce a negative ROI after COGS, shipping, and fees. Consider a brand selling a $50 product with $30 in landed cost, $5 in fulfillment, and $3 in payment processing. That leaves $12 in gross margin. If the campaign runs at a 3:1 ROAS, the brand earns $3 in revenue per $1 of ad spend, but the $1 of ad spend comes out of that $12 margin. The math only works if ad spend per unit stays well below $12.
This is why Reddog works from contribution margin first, not ROAS first. ROAS tells you the revenue story. Contribution margin tells you the profit story.
| Metric | What it measures | What it excludes |
|---|---|---|
| ROAS | Revenue per ad dollar | COGS, fulfillment, overhead |
| ROI | Net profit after all costs | Nothing. It is the full picture. |
| MER | Total revenue over total marketing spend | Channel-level granularity |
ROAS ignores non-ad costs like COGS and operations, while ROI includes every expense to evaluate total profitability. Use ROAS to evaluate individual campaigns. Use ROI and marketing ROI metrics to evaluate the business.
ROAS, ROI, and Marketing Efficiency Ratio (MER) each answer a different question. Confusing them leads to poor budget decisions.
ROAS answers: “Did this specific campaign generate enough revenue to justify its spend?” It is a campaign-level signal. ROI answers: “Did this investment make the business more profitable after all costs?” It is a business-level signal. MER considers total revenue over total marketing spend across all channels, capturing organic lift, word-of-mouth, and multi-channel effects that ROAS misses entirely.
A practical example illustrates the gap. A brand runs a Meta campaign with a 5:1 ROAS. That looks strong. But when the brand calculates ROI including Amazon FBA fees, 3PL storage, and returns, the net margin on those sales is 4%. The campaign was efficient at generating revenue. It was not efficient at generating profit.
MER fills a different gap. If a brand spends $50,000 across all marketing channels in a month and generates $300,000 in total revenue, MER is 6.0. That number includes revenue from organic search, email, and repeat buyers who were influenced by ads but did not click one. MER gives a truer read on total marketing productivity.
Combining ROAS with CAC and conversion rate provides the full picture of campaign efficiency. Customer Acquisition Cost tells you what you paid to acquire each new buyer. Conversion rate tells you how efficiently your landing page or product detail page converted ad traffic. ROAS alone cannot tell you either of those things.
Pro Tip: Track ROAS at the campaign level, MER at the brand level, and reduce CAC by improving conversion rate before increasing ad spend. That sequence protects margin.
Accurate ROAS measurement is harder than the formula suggests. Three problems show up repeatedly in growth-stage brands.
Attribution model mismatch. Last-click attribution undervalues top-of-funnel ads for brands with long sales cycles. A customer who sees a Meta awareness ad in week one and converts via a Google Shopping ad in week three gives all credit to Google under last-click. The Meta campaign looks unprofitable. It may have been the reason the customer entered the funnel at all. Time-decay and data-driven attribution models distribute credit more fairly across touchpoints.
Privacy-driven signal loss. Experienced media buyers warn against relying solely on in-platform ROAS because privacy updates have degraded reporting accuracy. iOS 14.5 and subsequent Apple privacy changes reduced the match rate between ad clicks and conversions in Meta’s system. The result is under-attribution of real conversions and, paradoxically, over-attribution of others through modeled data.
Hidden costs excluded from ad spend. Most brands calculate ad spend as media cost only. Creative production, agency fees, and platform subscription costs belong in the denominator too. Excluding them inflates ROAS and produces targets that are impossible to hit once full costs are counted.
Best practices for reliable ROAS measurement:
ROAS measures revenue per ad dollar, but profitability requires pairing it with contribution margin, ROI, and MER to make sound budget decisions.
| Point | Details |
|---|---|
| ROAS definition | Revenue divided by ad spend; a 4:1 ratio is the standard eCommerce benchmark. |
| Accurate calculation | Use server-side data to avoid the 15–40% overstatement common in in-platform reporting. |
| Context-dependent targets | Set ROAS targets based on your gross margin, not industry averages alone. |
| ROAS vs. ROI | ROAS measures ad revenue efficiency; ROI measures total business profitability after all costs. |
| Measurement discipline | Combine ROAS with MER, CAC, and conversion rate for a complete view of campaign performance. |
Most brands I work with arrive treating ROAS as the scoreboard. They want it high, and they assume high means healthy. That assumption costs them margin every month.
The real problem is that ROAS is a revenue metric wearing a profitability costume. A 6:1 ROAS on a product with 25% gross margin and $8 in Amazon FBA fees per unit can still destroy contribution. The number looks great in the dashboard and terrible in the bank account. I have seen this pattern repeatedly with CPG brands scaling on Amazon and Meta simultaneously, where each channel reports strong ROAS but the blended economics are quietly negative.
The fix is not to stop tracking ROAS. It is to build a target ROAS that starts from your break-even contribution margin and works backward to the ad spend the business can actually afford. That calculation changes by channel, by SKU, and by season. A flat “we need 4x ROAS” rule applied across every campaign ignores all of that complexity.
Privacy changes have made this harder, not easier. Signal loss means the ROAS number in your dashboard is increasingly a model estimate rather than a direct measurement. Brands that have not implemented server-side tracking are making budget decisions on data that is structurally optimistic. That is a solvable problem, but it requires treating measurement as a core business function, not an afterthought.
The brands that grow profitably use ROAS as one input in a margin-first framework. They know their break-even ROAS by channel. They track MER monthly. They review how to calculate return on ad spend in the context of full channel economics, not just platform dashboards. That discipline is what separates sustainable growth from revenue that evaporates at the contribution line.
— Reddog
If your ROAS numbers look strong but your margins tell a different story, the gap is usually in how costs are allocated across channels.

Reddog works with CPG founders and operators in the $500K–$20M revenue range to build margin-first growth plans. A free 30-minute strategy call covers your contribution margin by channel, where ad spend is creating real return versus surface-level revenue, and what your break-even ROAS should actually be given your cost structure. No generic advice. Just a focused review of your numbers. Book your free strategy call and walk away with a clearer picture of where your ad dollars are actually going.
ROAS stands for Return on Advertising Spend. It measures how much revenue you earn for every dollar spent on ads, calculated by dividing ad revenue by ad spend.
A 4:1 ROAS is the strong benchmark for eCommerce, meaning $4 in revenue per $1 spent. The right target for your brand depends on your gross margin and total cost structure.
ROAS excludes costs like COGS and fulfillment, measuring only revenue against ad spend. ROI includes all business costs and measures true profitability.
In-platform reporting can overstate ROAS by 15–40% due to privacy changes and limited tracking signals, especially on iOS traffic. Server-side attribution produces more accurate numbers.
Yes. A campaign can show strong ROAS while generating negative contribution margin if product costs, shipping, platform fees, and returns consume the revenue. Always calculate your break-even ROAS before setting targets.
Leave a comment: