Skip to content
Reddog Consulting Group
  • Home
  • Growth
    Profitability
    Conversion
    Operations
  • About
  • Contact
Fix My Margins
  • Home
    • Growth
    • Profitability
    • Conversion
    • Operations
  • About Us
  • Contact
Fix My Margins

Unleashing Insights

CPG founder reviewing product assortment samples

Product Assortment for CPG Founders: The Margin Playbook

Posted on July 29, 2026


TL;DR:

  • Product assortment involves selecting SKUs that maximize contribution margin and minimize complexity costs.
  • Focusing on a channel-specific, pilot-tested assortment helps brands improve profit and reduce stock waste.

Product assortment is the breadth and depth of SKUs a retailer stocks within a category, counting every brand, size, and variant across each channel and outlet, as defined by Circana. For emerging CPG brands, the single most important action you can take this quarter is to pick one channel, choose two to three SKUs, and run a controlled pilot that measures incremental contribution margin. Treat assortment as a P&L lever from day one, not a merchandising afterthought.

Table of Contents

  • What is product assortment, and why does the vocabulary matter?
  • Why assortment is a direct P&L lever for CPG growth
  • A channel-first assortment strategy you can run this quarter
  • Which KPIs actually tell you if your assortment is working?
  • How to score SKUs and avoid portfolio fragmentation
  • How to build a sell-in that proves incrementality to retail buyers
  • What does it actually cost and how long does it take?
  • Common assortment mistakes founders make and how to fix them
  • Practical templates and tools to manage your assortment
  • Key Takeaways
  • The assortment mistake most founders make too late
  • How Reddog helps CPG brands build margin-first assortments
  • Useful sources for further reading

What is product assortment, and why does the vocabulary matter?

Getting the language right matters because retail buyers use specific terms, and founders who speak the same language close faster.

  • Breadth (width): the number of distinct product lines or categories you offer. A brand selling a protein bar, a protein shake, and a protein chip has breadth of three.
  • Depth (length): the number of variants within a single line. Six flavors of that protein bar means a depth of six.
  • SKU: a unique, scannable unit. One flavor in one size is one SKU; change the size and you have a second SKU.
  • Assortment vs. catalog: your catalog is every SKU your brand has ever made. Your assortment is the subset a specific retailer or channel actually stocks.
  • Outlet typology: the channel type shapes which SKUs belong. National club stores (Costco) favor large-format multipacks; convenience channels want single-serve impulse items; mass (Walmart) wants everyday value; online marketplaces reward variety packs and bundles.

NielsenIQ’s CPG framework formalizes this further, using actions like “add,” “delist,” and “at-risk” to quantify distribution opportunity by growth and share-of-shelf. Knowing that vocabulary before your first buyer meeting is a real competitive edge.

Why assortment is a direct P&L lever for CPG growth

Assortment decisions change your income statement, not just your shelf presence. Right-sizing assortment reduces holding costs, expiry write-offs, and substitution-driven lost sales while improving sales per linear foot and per digital visit.

The financial impacts stack up quickly:

  • Inventory turns: a bloated SKU count ties up working capital in slow-moving units.
  • Holding and storage costs: 3PL and FBA storage fees compound on SKUs that sit.
  • Expiry and write-off risk: perishable or dated products in the tail destroy margin fast.
  • Trade spend dilution: spreading promotional dollars across too many SKUs lowers the lift on each one.
  • Cannibalization: adding a new size or flavor can simply shift volume from an existing SKU rather than growing the category.

The tail-SKU problem is real. Research shows the bottom 10–20% of SKUs often contribute less than 2% of category revenue while consuming outsized shelf space. That is the first place to look when you need margin recovery.

Smarter assortment also unlocks profit growth by concentrating trade spend and supply-chain capacity on SKUs that actually earn their place.

A channel-first assortment strategy you can run this quarter

This six-step playbook is built for founders who need results in 90 days, not 18 months.

  1. Define your objective in P&L terms. Set a target contribution margin per SKU per channel before you pick a single product. Revenue goals without margin guardrails lead to growth that costs more than it earns.
  2. Segment channels and outlet typologies. Map each channel (Amazon, Walmart, regional grocery, convenience, DTC) by its margin profile, execution cost, and shopper mission. Not every SKU belongs everywhere.
  3. Map shopper missions to SKU roles. Assign each SKU a role: trial driver, hero/core, price anchor, or seasonal. A convenience channel needs a single-serve trial driver; a club channel needs a value multipack.
  4. Set SKU rules and a complexity budget. Define the maximum number of SKUs per distribution center or factory run, tied directly to contribution margin thresholds. Complexity has a cost; cap it explicitly.
  5. Design a pilot and measurement plan. Choose a test cohort of a modest number of stores or an online cohort, a control group, an appropriate measurement window spanning multiple weeks, and three core metrics: sell-through rate, incremental velocity, and contribution margin impact.
  6. Iterate and scale. Only expand distribution for SKUs that clear your margin and incrementality thresholds in the pilot. Everything else gets fixed or cut.

Channel-decision matrix (generic guidance):

Channel Margin Potential Execution Risk Priority Signal
DTC / owned website High Low Test new SKUs first
Amazon FBA Medium–High Medium Validate velocity before retail
Regional grocery Medium Medium Strong for hero SKUs
Mass (Walmart) Low–Medium High Only proven, high-volume SKUs
Convenience Medium Low–Medium Single-serve, impulse formats
Club (Costco) Medium High Large-format, established brands

Pro Tip: Set an absolute SKU-per-DC cap. Every SKU added below your minimum contribution margin threshold increases pick-and-pack complexity, raises 3PL costs, and fragments your trade spend. Define the cap before your next line review.

For a deeper look at CPG market expansion sequencing, the channel economics vary significantly by stage.

Which KPIs actually tell you if your assortment is working?

Track these metrics from POS, scan data, or marketplace dashboards. Every SKU in your assortment should clear a defined threshold or face a rationalization decision.

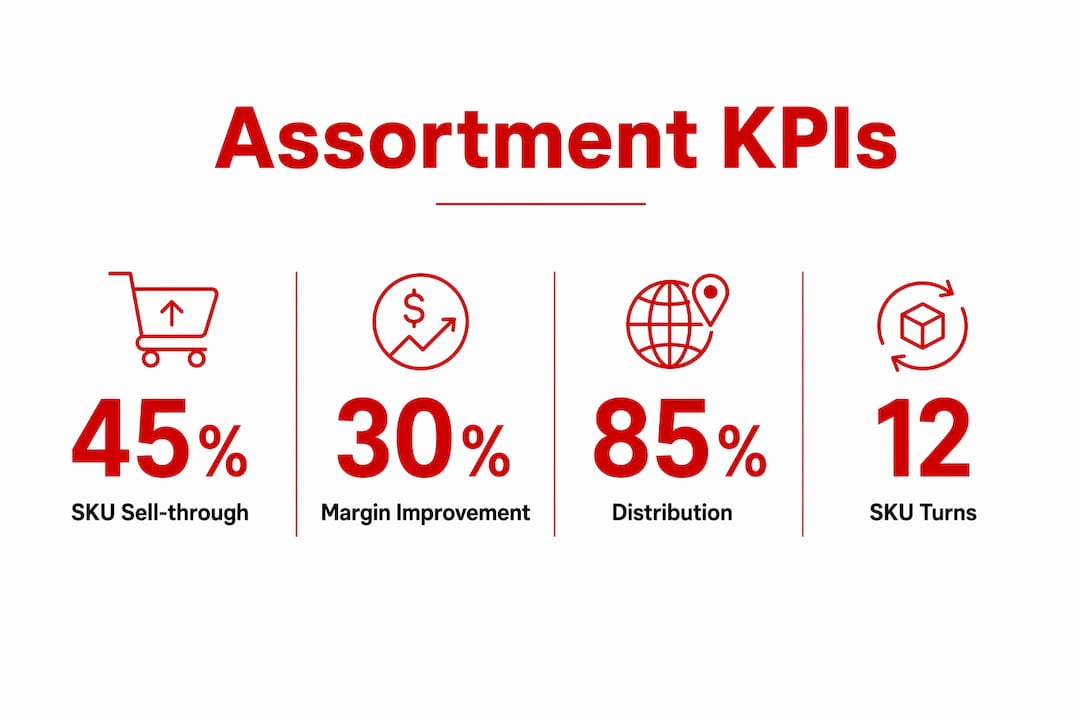
Infographic showing key KPIs for product assortment

KPI Formula Threshold Guidance
Sell-through rate Units sold ÷ Units received Low sell-through signals overstock risk
Inventory turns COGS ÷ Average inventory value Under 4× annually warrants review
Contribution margin Net revenue minus COGS minus direct variable costs Set a floor before launch
Rate of sale (ROS) Units sold ÷ Stores selling ÷ Weeks Benchmark against category average
Cannibalization % Lost sales on existing SKU ÷ New SKU sales Above 20% is a red flag
Incremental lift (Test group sales minus control group sales) ÷ Control group sales Target positive incremental lift

Calculation example: If your test cohort of 30 stores sells 600 units of a new SKU over 8 weeks, and the matched control group shows no change in the existing SKU’s velocity, your incremental lift is the full 600 units. At a $2.50 contribution margin per unit, that pilot generates $1,500 in incremental contribution margin across 30 stores. Annualized and scaled to 300 stores, that is $15,000 in incremental contribution margin before any trade investment.

Retail buyers increasingly expect CPG brands to demonstrate incrementality — evidence that a new SKU drives traffic or basket expansion without cannibalizing existing products. Your KPI table is the foundation of that proof.

How to score SKUs and avoid portfolio fragmentation

A simple ABC scoring model keeps rationalization decisions objective and defensible.

Hands scoring SKUs using printed matrix

Score each SKU across five dimensions on a consistent scale: rate of sale, incrementality, contribution margin, supply-chain complexity cost (inverted — high complexity scores low), and retailer strategic value. Use the composite score to guide maintain, monitor, or delist decisions within defined ranges.

Decision rules to apply alongside the scoring:

  • Delist when a SKU scores C for two consecutive review cycles and has no strategic retailer requirement.
  • Invest when a SKU scores A but has distribution gaps; close those gaps before launching new SKUs.
  • Watch rising-but-low-volume SKUs — a new SKU with strong velocity but low absolute volume may be an A-band SKU in six months. Flag it rather than cutting it prematurely.
  • Protect price anchors even at lower margins if they drive trial that converts to hero SKU purchases.

The SKU rationalization process works best when it runs on a fixed calendar, not reactively.

How to build a sell-in that proves incrementality to retail buyers

Buyers at regional grocery chains and mass retailers see hundreds of sell-in decks. The ones that advance share one thing: a credible incrementality story backed by data.

Your sell-in checklist:

  • Hypothesized job-to-be-done (what shopper need does this SKU fill that your current range does not?)
  • Target outlet typology and store cluster
  • Pilot design: store count, duration, control plan
  • POS or scan data sources you will use to measure results
  • Expected metrics: incremental velocity, basket size impact, cannibalization rate
  • Rollback plan if the pilot underperforms

Pilot design in practice:

  1. Select a moderate number of stores matched on volume, format, and region.
  2. Identify a control group of similar stores that will not carry the new SKU.
  3. Run the pilot for a sufficient duration to capture multiple purchase cycles.
  4. Measure weekly sell-through, rate of sale, and cannibalization against the control.
  5. Package findings in a one-page summary using the buyer’s own category language.

For practical guidance on getting products into retail stores, the sell-in narrative structure matters as much as the data itself.

What does it actually cost and how long does it take?

Realistic timelines and budgets protect your cash flow and prevent margin surprises.

Typical pilot timeline:

  1. Pilot design and retailer approval: 4–8 weeks
  2. Production run and quality check: 4–6 weeks
  3. Distribution and shelf reset: 2–4 weeks
  4. Measurement window: 8–12 weeks
  5. Analysis and scale decision: 2–3 weeks

Total: roughly 5–8 months from concept to scale decision.

Budget line items to plan for:

  • Slotting or trial allowances (varies by retailer and channel; confirm with your broker)
  • Incremental production cost for the pilot run
  • Retail co-op or promotional support
  • Freight and last-mile distribution
  • Shelf execution and reset labor
  • POS data access or syndicated data subscription

Cash-flow caution: payment terms from retailers (net 30–60) combined with upfront production and slotting costs create a cash gap. Build a 60-day cash buffer into your pilot budget. Protect inventory turns by not over-producing the pilot run; a lean initial production quantity limits write-off exposure if the pilot underperforms.

Common assortment mistakes founders make and how to fix them

Most margin leaks in CPG assortments trace back to a handful of recurring errors.

  • Portfolio fragmentation: launching SKUs faster than distribution can support them. Fix: enforce your SKU complexity budget before approving any new launch.
  • Over-complexity: too many sizes and flavors that confuse shoppers and dilute trade spend. Fix: run an ABC review quarterly and delist C-band SKUs on a defined schedule.
  • Weak sell-in evidence: pitching buyers without pilot data or a credible incrementality story. Fix: always run a small DTC or Amazon test before approaching a new retail channel.
  • Ignoring outlet typologies: sending the same assortment to every channel. Fix: build a channel-specific SKU list tied to the shopper mission for each outlet type.
  • Ghost distribution: a SKU is authorized but not actually on the shelf. Fix: close the operational loop with shelf verification and corrective action, not just planogram authorization.

Governance rule: require a signed-off contribution margin projection and a pilot result before any new SKU enters distribution at scale. One approval gate prevents most fragmentation problems.

Practical templates and tools to manage your assortment

You do not need enterprise software to start. These four templates cover most of what an emerging brand needs.

  • Assortment matrix: rows are SKUs; columns are channels. Each cell shows whether the SKU is active, planned, or not applicable for that channel, plus its contribution margin and current rate of sale.
  • SKU scoring spreadsheet: the five-dimension scoring model from the rationalization section, updated quarterly.
  • Pilot tracker: store list, weekly sell-through, control group comparison, and a running incremental margin calculation.
  • Sell-in one-pager: job-to-be-done, pilot design, expected metrics, and rollback plan on a single page.
Tool Category Use Case When to Upgrade
POS / scan analytics Velocity, distribution gaps, sell-through When managing 5+ retailers
Assortment optimization platforms Multi-factor SKU scoring, simulation When spreadsheets lag weekly data
Planogram / POG tools Shelf space allocation, facings When entering 3+ retail banners
Shelf verification apps Ghost distribution detection When distribution exceeds 100 stores

Modern assortment optimization platforms shift the process from periodic reviews to continuous weekly SKU-level alerts. For brands under $5M in revenue, a well-maintained spreadsheet system is usually sufficient. Above that threshold, the speed advantage of a dedicated platform starts to justify the cost. Ecommerce merchandising best practices follow similar logic for digital channel assortment management.

Key Takeaways

Product assortment is a margin lever first: the brands that grow profitably treat every SKU as an asset that must earn its place through measured incrementality and contribution margin.

Point Details
Define assortment by breadth and depth Breadth counts product lines; depth counts variants. Both affect margin and complexity costs.
Tail SKUs destroy margin A small percentage of SKUs contribute a very small fraction of revenue; rationalize them first.
Pilot before scaling Run an 8–12 week controlled pilot in 20–40 stores before committing to full distribution.
Track five core KPIs Sell-through, inventory turns, contribution margin, rate of sale, and cannibalization rate drive every assortment decision.
Reddog’s approach Reddog builds margin-first assortment strategies for CPG brands in the $500K–$20M range, from SKU scoring to retail sell-in.

The assortment mistake most founders make too late

Most emerging CPG brands treat assortment as a catalog decision, not a financial one. They add SKUs to fill retailer requests, respond to competitive pressure, or satisfy internal product teams, and they do it without a margin floor or an incrementality test. By the time the P&L shows the damage, the brand is carrying 30 SKUs where 12 would have done the same revenue at twice the margin.

The brands Reddog works with that scale most efficiently share one discipline: they treat every new SKU as a capital allocation decision. Before a SKU enters distribution, it needs a hypothesized job-to-be-done, a pilot result, and a contribution margin projection. That discipline is not a constraint on growth. It is what makes growth sustainable.

The other underestimated risk is ghost distribution. A SKU can be authorized, listed in the planogram, and counted in your distribution numbers while sitting in a back room or simply never being stocked. Without shelf verification closing the loop, your assortment data is fiction. Fixing that gap, not adding more SKUs, is often the fastest path to incremental revenue.

How Reddog helps CPG brands build margin-first assortments

Reddog works with CPG brands in the $500K–$20M revenue range that need more than a top-line growth plan. We bring a contribution-margin-first lens to every assortment decision: SKU scoring, channel economics, pilot design, and retail sell-in preparation. Whether you are rationalizing a fragmented portfolio or preparing to pitch a new SKU to a regional grocery buyer, we help you build the analytical case and the execution plan.

Reddog

If you are ready to treat your assortment as the P&L lever it actually is, Reddog offers a free 30-minute strategy call for qualified CPG founders and operators. We will review your current channel economics, contribution margin by SKU, and inventory velocity to identify where the fastest margin gains are hiding. Book your free strategy call and come prepared with your top five SKUs and their current sell-through rates.

Useful sources for further reading

  • Circana CPG Dictionary: Assortment — authoritative definition of assortment breadth, depth, and SKU-level measurement used by retail buyers.
  • NielsenIQ CPG Dictionary: Assortment — buyer-facing framework covering add, delist, and at-risk actions with distribution opportunity scoring.
  • Circana: Using market research to drive smart product expansion — practical guidance on proving incrementality and designing sell-in evidence packages.
  • Vision Group: Assortment optimization for CPG — covers tail-SKU dynamics, ghost distribution, and the closed operational loop.
  • Tellius: Assortment optimization for CPG — explains AI-driven continuous monitoring and when platform investment outperforms spreadsheet processes.
  • ShipBob: Product assortment definition and strategies — accessible primer on breadth vs. depth for operators new to assortment design.
  • FieldAssist: Product assortment optimization guide — operational guide connecting assortment choices to holding costs, write-offs, and margin recovery.
  • Reddog blog: Grow profits with smart assortment optimization — margin-first assortment strategies and practical frameworks for U.S. CPG brands.

Recommended

  • How to Improve Contribution Margin: CPG Playbook for 2026 – Reddog Consulting Group
  • How to Launch a CPG Brand: A Margin-First Operator’s Guide – Reddog Consulting Group
  • Grow profits with smart assortment optimization – Reddog Consulting Group
  • How to Get Products into Retail Stores: A CPG Playbook – Reddog Consulting Group
en what is product assortment

Leave a comment:

Please note, comments must be approved before they are published

← Older Post

/

Newer Post →

Contact

1500 Hadley St. #211

Houston, Texas 77001

growth@reddog.group

(713) 570-6068

Marketplaces

Amazon

Walmart

Target

NewEgg

Shopify

Reddog Consulting Services

Omnichannel Retailing & Marketing

Listing Power & Growth (SEO & SERP)

Advertising Management (PPC)

Listing Optimization

Design

CTR Main Image Hack

Account Suspension

Listing Reinstatement

Trademark Registration

UPC to GS1 Barcode Change

Connect with us

Published: March 2020 | Last Updated:July 2026
© Copyright 2026, Reddog Consulting Group.

Country/region

  • Australia (AUD $)
  • Canada (USD $)
  • Mexico (USD $)
  • Pakistan (USD $)
  • United States (USD $)