
Published: March 2020 | Last Updated:September 2026
© Copyright 2026, Reddog Consulting Group.

For a CPG brand, an omnichannel contact center means coordinating sales, pricing, inventory, and marketing across Amazon, Walmart, DTC, wholesale, and brick-and-mortar so every channel is priced, stocked, and measured on its own economics. The immediate payoff is a clear channel P&L and faster inventory velocity. Get there through three levers: building real channel-level profit and loss statements, activating retail media deliberately rather than everywhere at once, and orchestrating inventory so no single channel starves another.
TL;DR:
- Tracking channel-specific profit and loss statements reveals where high-margin channels subsidize lower-margin ones, preventing cash drain.
- Coordinating inventory, fulfillment, and retail media at the channel level optimizes margins and boosts inventory velocity across all outlets.
- Implementing governance rules and assigning dedicated owners to each channel P&L ensures accurate data reconciliation and operational clarity.
- Combining retailer POS with DTC and retail media signals improves demand forecasting, inventory management, and stockout prevention.
- Focusing on contribution margin dollars, inventory turns, and retail media incrementality provides more meaningful benchmarks than sales revenue alone.
Most brands track total revenue and call it a strategy. That number hides more than it reveals. A brand doing $8 million across four channels can look healthy on paper while one channel quietly bleeds cash every month it stays open.
The fix starts with a channel-level P&L, and the discipline is simple: track dollars, not percentages. Channel margin research from Eightx puts this in concrete terms, with DTC often landing near a mid-thirty percent contribution margin, traditional retail closer to thirty percent, and Amazon frequently dropping below twenty percent once referral fees, FBA costs, and ad spend get layered onto a standard cost-of-goods unit.
That gap changes real decisions. A brand chasing Amazon revenue growth without watching contribution dollars can end up funding its lowest-margin channel with cash generated by its highest-margin one, and never notice until the bank account tells them.
Three patterns show up again and again when we look at channel economics:
Why measurement matters more now than five years ago: Oliver Wyman’s research points out that 75% of shoppers now move between digital and physical touchpoints on the same buying journey. That behavior generates far more cross-channel data than a single-channel brand ever had to reconcile, and brands without a system for fusing it are making channel decisions on incomplete information.
Running omnichannel well requires coordinating five distinct pieces, and most brands only manage two or three of them before they stall out.
Pro Tip: Assign one owner per channel P&L before you assign anyone to “omnichannel strategy” broadly. A generalist owning everything usually means nobody owns the numbers.
Fused data pays off in specific, visible ways. Brands that combine retailer POS with their own DTC and RMN signals typically catch stockouts before they become lost distribution, because a demand spike shows up in the data days before a retailer’s own replenishment system flags it. Oliver Wyman’s research frames this as an operational efficiency gain that goes well beyond marketing, touching demand planning and inventory turns directly.
The traps are just as real, and they tend to hit the same brands repeatedly:
The fastest fixes are the ones that move contribution dollars, not the ones that look impressive in a board deck. Fixing a hidden trade spend leak on your highest-volume retail account almost always outperforms launching a new DTC campaign, because you are recovering margin you already earned instead of paying to acquire new margin.
You do not need a twelve-month roadmap to start. You need a sequence that tells you where you actually stand before you commit inventory or ad dollars.
Pro Tip: Run steps 1 through 3 before you spend a dollar on new channel launches. Most margin problems trace back to skipping the P&L and ecosystem mapping steps and jumping straight to activation.
Reddog’s omnichannel strategy process guide walks through governance structures in more depth if you want to build this checklist into a standing operating rhythm.
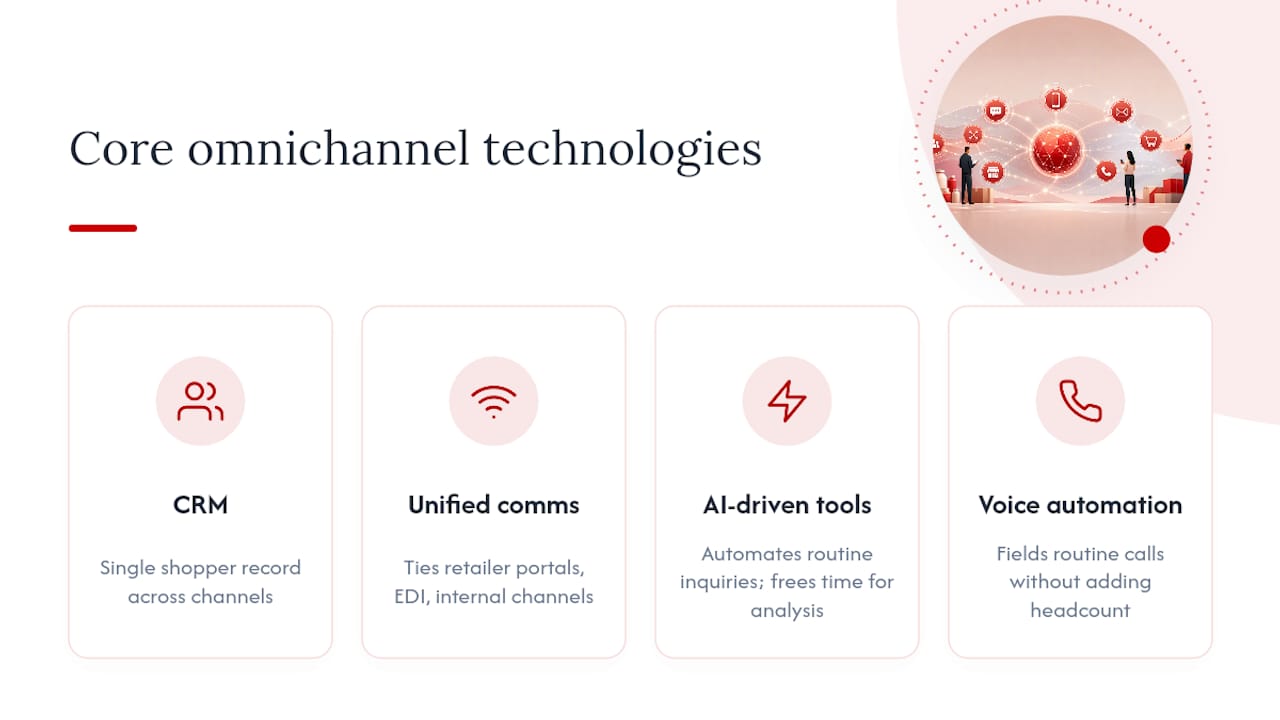
None of this runs on spreadsheets alone past a certain revenue point. Three technology categories do the heavy lifting for CPG brands trying to coordinate channels at scale.
Customer relationship management (CRM) systems track shopper interactions across retailer sites, DTC storefronts, and wholesale accounts, giving you one record instead of five disconnected ones. Unified communication platforms tie together the retailer portals, EDI feeds, and internal team channels that otherwise force someone to manually reconcile numbers from six different logins every week. AI-driven tools, including automated response systems for high-volume customer inquiries, are increasingly handling the routine questions that used to eat up a support team’s week, freeing that time for margin analysis instead of ticket triage.
A voice automation partner like Wattle illustrates where this is heading. Automated voice agents can field a growing share of routine retailer or customer calls without adding headcount, which matters for a lean operator managing four or five channels at once. The technology itself is not the strategy. It is the plumbing that lets a small team run channel-level analysis instead of drowning in manual reconciliation. Brands still need the channel P&L discipline first. Reddog’s breakdown of top omnichannel platforms covers the practical tradeoffs between platform categories if you are evaluating options for your own stack.
A shopper researching your product on Amazon, checking a price at Walmart, and finally buying at a brick-and-mortar shelf is not three separate customers. It is one journey, and most brands only see one-third of it because their data lives in three unconnected systems.
Journey mapping for a CPG brand means tracing where a shopper actually discovers, compares, and completes a purchase, then checking whether your content, pricing, and messaging stay consistent at each step. CommerceIQ’s research on omnichannel retail strategy makes a pointed observation here: brands that treat online and in-store as separate P&Ls internally often fail to share customer data, creative assets, and measurement frameworks across those same channels externally. The shopper experiences one brand. The internal team operates as three.
Personalization at this level does not require a massive martech budget. It requires consistency: the same product claims on your Amazon listing, your Walmart page, and your shelf packaging, backed by pricing that does not contradict itself from one channel to the next. A shopper who sees a lower price on Amazon than in-store, on the same item, on the same week, loses trust in the brand before they lose trust in the retailer. That inconsistency shows up in return rates and review sentiment long before it shows up in a sales report.
The upside of connecting channels is straightforward: shared data catches demand shifts earlier, coordinated promotions avoid cannibalizing each other, and a unified content strategy reduces the risk of a shopper hitting contradictory information mid-purchase. Brands that fuse retailer and DTC signals typically get an earlier read on which SKUs are trending, which matters most during a seasonal launch window when a two-week lag in reordering can mean a stockout.
The challenges are less often discussed, and they tend to be organizational before they are technical. Integrating channels means someone has to reconcile inconsistent data definitions between a retailer’s POS feed and your own DTC analytics platform, and that reconciliation work rarely gets budgeted for. Retailers also do not share data equally: some POS partnerships give you daily sell-through, others give you a monthly summary weeks after the fact, which limits how fast you can actually react.
There is also a real cost to doing this poorly. A brand that connects channels without governance rules often ends up with more data and less clarity, because three systems now disagree about basic numbers like units sold or return rate. Oliver Wyman’s research treats governance as a prerequisite for value, not an optional add-on, and that framing holds up in practice: the brands seeing real operational gains built the governance layer before they built the dashboard.
Revenue growth is the easiest metric to report and the least useful one for judging whether your omnichannel setup is working. A handful of other numbers tell you more.
Contribution margin dollars by channel come first. Track them monthly, not quarterly, so a fee increase or trade spend leak gets caught before it compounds. Inventory turn rate by channel comes next, since a SKU turning six times a year on Amazon but twice a year in wholesale tells you where your capital is actually tied up versus where it is working. Sell-through rate at retail, measured against the retailer’s own POS feed rather than your shipment data, shows whether product is actually leaving shelves or just sitting in a distribution center counted as a “sale.”
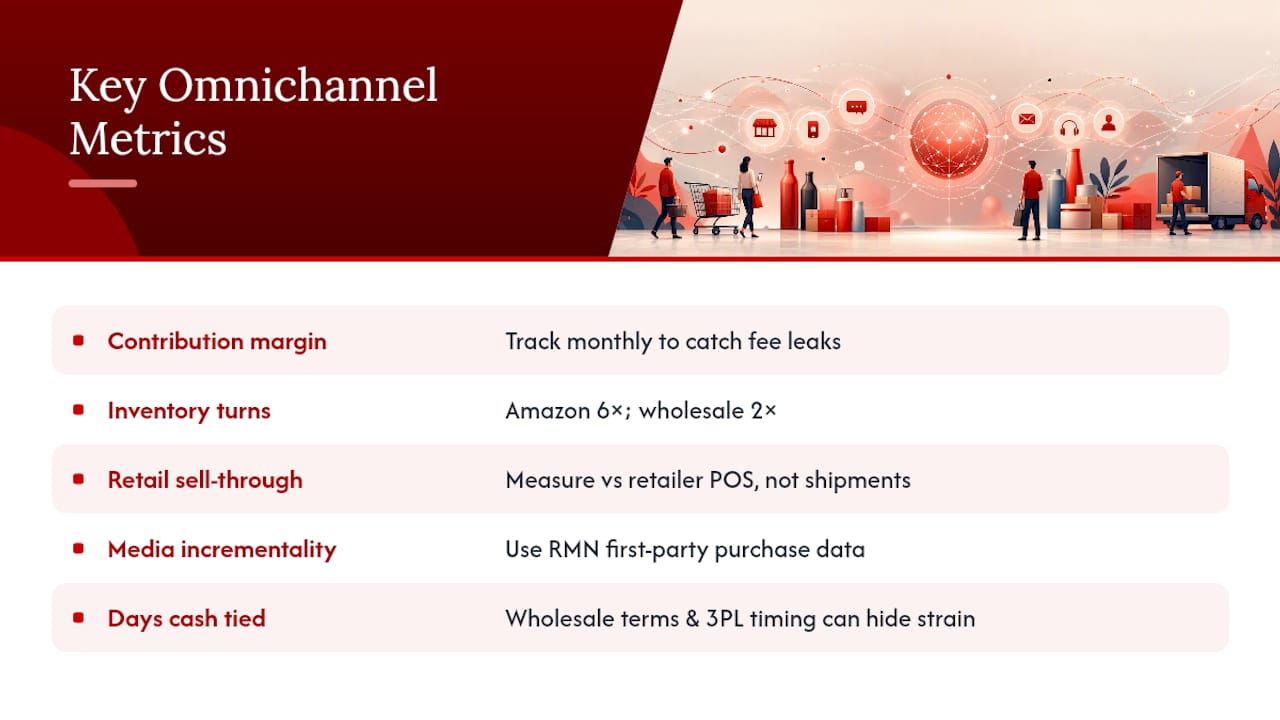
Incrementality from retail media spend matters more than raw impressions or click-through rate. A campaign that drives clicks but cannibalizes organic sales you would have gotten anyway is not growth, it is a cost. JetFuel’s retail media analysis points to first-party purchase data from RMNs as a meaningfully better signal for this than broader social awareness metrics, precisely because it ties spend to an actual transaction rather than an impression.
Finally, track days of cash tied up in inventory by channel. Wholesale net terms and 3PL storage timing can make a channel look profitable on the P&L while quietly straining the bank account every month it operates.
Founders tend to treat omnichannel as a marketing project when it is fundamentally a finance and operations project. The brands that get real traction are the ones who build the channel P&L before they build the retail media plan.
We see the same pattern repeatedly: a brand growing fast on Amazon while quietly starving its cash position because nobody separated FBA fees, ad spend, and storage costs into a clear channel view. Or a wholesale relationship that looks profitable until someone accounts for the net-60 terms tying up working capital. Run the eight-step checklist above as a diagnostic before you commit to a new channel or a bigger media budget.
— Reddog
Reddog gives CPG brands something most agencies never offer: a hard look at what each channel actually contributes to profit, not just what it contributes to top-line revenue. That distinction is the difference between growth that strengthens your cash position and growth that quietly drains it.
If you run a CPG brand doing between $500,000 and $20 million in revenue and you are wrestling with Amazon fee complexity, Walmart WFS margin compression, or inventory that turns fast in one channel and sits dead in another, a focused conversation can clarify more than another quarter of guessing. Book a free 30-minute strategy call with Reddog, framed as a practical review of your channel economics, contribution margin, and inventory velocity, not a sales pitch. Visit the CPG retail growth offer page to find a time that works and come with your current channel breakdown in hand.
Leave a comment: