
Published: March 2020 | Last Updated:July 2026
© Copyright 2026, Reddog Consulting Group.

TL;DR:
- Demand forecasting predicts customer purchase patterns to optimize supply chain decisions and reduce costs. Accuracy improvements directly increase service levels and profit margins across multiple channels, especially for consumer packaged goods brands. Effective forecasting requires aligning models with decision horizons, data inputs, and margin-driven objectives.
Demand forecasting predicts what customers will buy, how much, and when — using historical sales data, promotional calendars, and external market signals to drive supply chain decisions. Done well, it reduces stockouts and excess inventory, improves service levels, and protects contribution margin across every channel you sell through. For CPG operators managing SKUs across Amazon, Walmart, DTC, and wholesale, the gap between a good forecast and a bad one shows up directly in carrying costs, lost sales, and cash flow timing. Accuracy metrics like MAPE (Mean Absolute Percentage Error) give you a quantifiable handle on that gap, while frameworks like DDMRP (Demand-Driven Material Requirements Planning) connect forecast outputs to reorder policies. Reddog works with CPG brands specifically to tie forecasting to margin-first inventory strategy — not just top-line volume.
At its core, demand forecasting is the process of estimating future customer demand for a product at a specific location over a defined time period. The SAP definition frames it simply: predict what customers will buy, how much, and when. That prediction then drives every upstream decision in your supply chain — how much to order, when to reorder, how much safety stock to hold, and how to allocate inventory across channels.
The business case is straightforward. When forecasts are accurate, you order the right quantity at the right time. Carrying costs drop because you’re not warehousing three months of slow-moving product. Stockouts fall because you’re not caught short during a promotional spike. Service levels rise, which matters enormously for retail buyers evaluating your fill rate.
For CPG brands, the importance of demand forecasting extends further. Accurate forecasts feed procurement schedules, production runs, 3PL storage planning, and marketing spend timing. A brand running a Walmart feature ad without a corresponding inventory build is burning margin on a promotion it can’t fulfill.
Key business outcomes tied to forecast quality:
Inventory forecasting fundamentals connect directly to these outcomes — forecast accuracy is the upstream input that determines whether your reorder policies actually work.
AI-based forecasting adoption by large-scale organizations is anticipated to grow significantly by the end of this decade, a signal that the investment case for better tooling is only growing stronger.
Not every forecast serves the same purpose. The horizon you choose should match the decision you’re making — ordering next week’s replenishment requires a different model than planning a new SKU launch six months out.
Short-term forecasting (1–12 weeks) drives operational decisions: replenishment orders, warehouse staffing, promotional inventory builds. These forecasts need high granularity — SKU by location, updated weekly or even daily during volatile periods.
Medium-term forecasting (3–18 months) supports tactical planning: production scheduling, supplier negotiations, seasonal buys, and marketing campaign planning. Monthly updates are typical, with adjustments when market conditions shift.
Long-term forecasting (1–5 years) informs strategic decisions: capacity planning, new market entry, product line expansion, and capital allocation. These forecasts carry wider error bands and rely more heavily on market trend analysis than on SKU-level history.
Beyond horizon, two structural approaches shape how you build a forecast:
When to use each type:
Qualitative methods — sales team input, Delphi panels, expert judgment — fill the gaps where historical data is thin, particularly for new SKUs or market entries. Quantitative methods take over once you have enough history to detect patterns.
Choosing the right model depends on your data maturity, SKU complexity, and the business question you’re answering. Modern forecasting blends statistical time-series models with machine learning and unified analytics platforms to manage complexity across retail channels — but most CPG operators start simpler and upgrade as data volume grows.

| Model Family | Data Needed | Typical Accuracy | Complexity | Best-Fit Use Case |
|---|---|---|---|---|
| Naïve / Moving Average | 3–12 months sales history | Moderate | Low | Stable SKUs, low seasonality |
| Exponential Smoothing (ETS) | 12+ months, trend/seasonal data | Moderate–High | Low–Medium | SKUs with trend or mild seasonality |
| Decomposition | 2+ years, seasonal history | High for seasonal items | Medium | Seasonal CPG categories (holiday, summer) |
| Causal / Regression | Sales + external variables (price, promo, weather) | High when drivers are known | Medium–High | Promotion-driven SKUs, price-elastic items |
| Machine Learning (ML) | Large SKU counts, rich feature sets | High at scale | High | Multi-channel, high-SKU portfolios |
Model selection rules:
Monitoring marketplace trends alongside your statistical baseline is one of the fastest ways to catch demand signals your model hasn’t seen yet.
Garbage in, garbage out — and in CPG forecasting, the garbage usually enters through incomplete promotional data or missing POS feeds. Accurate SKU-level predictions require combining POS data, shipment records, promotional calendars, and external signals like weather or macroeconomic indicators.
Core internal inputs:
External inputs that sharpen accuracy:
Data frequency matters as much as data type. Weekly POS feeds support short-term operational forecasts. Monthly shipment summaries are sufficient for medium-term tactical planning. For multi-channel inventory management, daily data flows become necessary when you’re allocating across Amazon FBA, Walmart WFS, and DTC simultaneously.
Pro Tip: When POS data isn’t available from a retail partner, use your own shipment-to-retailer data as a proxy — but apply a sell-through adjustment based on known inventory levels at the account. Shipments lag actual consumer demand, and forecasting off raw shipments without that correction will inflate your baseline.
Marketing analytics integration adds another layer of signal richness, particularly for brands running paid media that drives measurable demand spikes.
Most CPG teams don’t fail at forecasting because they chose the wrong model. They fail because the process is ad hoc, ownership is unclear, and the forecast never gets reconciled against what sales and marketing actually plan to do. Here’s a framework that fixes that.

Phase 1: Data collection and cleansing Gather SKU-level sales history, inventory positions, lead times, and promotional calendars. Flag and correct anomalies — a stockout period shows zero sales, not zero demand, and leaving it uncorrected will suppress your baseline.
Phase 2: Statistical baseline forecast Run your chosen model (exponential smoothing or decomposition for most CPG SKUs) to generate an unconstrained statistical baseline. This is what demand looks like absent any planned interventions.
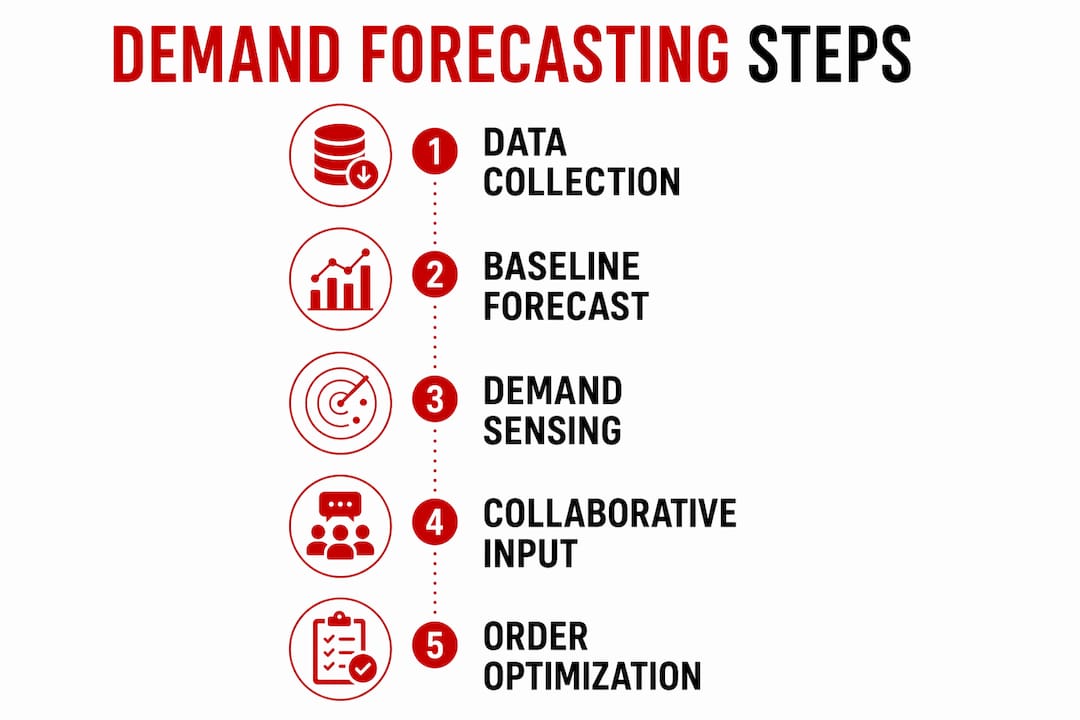
Phase 3: Demand sensing Adjust the near-term forecast (1–4 weeks) using real-time signals: current POS trends, inventory velocity, and any early reads on promotional performance. This is where daily or weekly data feeds earn their value.
Phase 4: Collaborative input Sales and marketing review the statistical baseline and overlay known events: upcoming promotions, distribution gains, new retail placements, and competitor activity. Promotional calendars and sales-team intelligence are critical qualitative inputs that improve forecast realism and prevent the bullwhip effect.
Phase 5: Forecast reconciliation Reconcile the adjusted forecast against financial targets and supply constraints. Flag gaps between the demand plan and available supply capacity. This is your S&OP input.
Governance structure:
Pro Tip: The bullwhip effect — where small demand fluctuations amplify into large swings upstream — almost always starts when sales teams override statistical forecasts without documented rationale. Build a simple log: every manual override gets a reason code and an owner. After 90 days, review which override categories improved accuracy and which made it worse. Most teams find that 20–30% of overrides hurt the forecast.
Promotional lift example: Your baseline forecast for a snack SKU is a certain number of units per week. Sales confirms a discount feature at a regional chain covering many stores for a limited time. Historical data shows a substantial lift for this promotion type at this account. The adjusted forecast reflects this lift for the promotion weeks, followed by a post-promotion dip as pantry-loading clears. That adjusted number drives your pre-build purchase order.
Measuring accuracy isn’t optional. Without it, you have no way to know whether your model is improving, which SKUs are chronically off, or when a governance change is warranted.
| Metric | What It Measures | Strength | Weakness | Operational Trigger |
|---|---|---|---|---|
| MAPE | Average % error across periods | Easy to interpret; comparable across SKUs | Inflated by low-volume SKUs; undefined at zero sales | MAPE > 30% at SKU level: review model or data inputs |
| MAE | Average absolute unit error | Intuitive in units; not distorted by outliers | Not comparable across SKUs of different volumes | Rising MAE during promotions: check promo lift factors |
| RMSE | Root mean squared error; penalizes large errors | Sensitive to big misses; useful for high-stakes SKUs | Harder to interpret; sensitive to outliers | High RMSE vs. MAE ratio: investigate specific large errors |
| Bias | Systematic over- or under-forecasting | Reveals directional model drift | Doesn’t capture magnitude of random error | Persistent positive bias: model is over-forecasting; reduce safety stock trigger |
When to use which metric:
For CPG operators, a practical starting point is tracking MAPE at the SKU-month level and bias at the category level. SKUs with MAPE above 30% and no clear data explanation are candidates for model review or manual override protocols.
Here’s a simple six-month sales history for a single CPG SKU (units sold per month):
| Month | Actual Sales |
|---|---|
| January | 420 |
| February | 390 |
| March | 450 |
| April | 480 |
| May | 460 |
| June | 500 |
Step 1: Compute the 3-period moving average forecast
The 3-period moving average for July = (480 + 460 + 500) / 3 = 480 units
For comparison, the April forecast (first period we can compute) = (420 + 390 + 450) / 3 = 420 units. Actual April was 480. Error = 60 units.
Step 2: Compute single exponential smoothing (α = 0.3)
Start with the January actual as the initial forecast (420). Each period: Forecast(t+1) = α × Actual(t) + (1 − α) × Forecast(t)
Step 3: Compare accuracy using MAPE
MAPE = average of |Actual − Forecast| / Actual × 100 across comparable periods (April–June):
| Month | Actual | MA Forecast | MA % Error | ETS Forecast | ETS % Error |
|---|---|---|---|---|---|
| April | 480 | 420 | — | 423 | — |
| May | 460 | 440 | — | 440 | — |
| June | 500 | — | — | 446 | — |
In this example, the 3-period moving average edges out exponential smoothing slightly on MAPE. That’s not unusual for a short, relatively stable series. Over a longer history with a clear upward trend, exponential smoothing with trend adjustment (Holt’s method) would likely pull ahead. The pedagogical value of this exercise is in seeing how small parameter choices affect accuracy — and why you should always benchmark a new model against a simple baseline before declaring it an improvement.
The right tool depends on your SKU count, data infrastructure, and how much manual effort your team can sustain. There’s no universal answer, but there is a clear maturity ladder.
Tooling tiers:
When to automate:
Vendor evaluation questions to ask:
Retail analytics platforms vary widely in their forecasting capabilities — evaluating them against these questions before committing to an implementation saves significant time and cost. For brands exploring machine learning consulting to scope an ML forecasting build, scoping the data readiness work first is usually the highest-value starting point.
Most forecast failures trace back to a small set of recurring mistakes. Recognizing them early is half the battle.
Pitfalls and fixes:
Red flags that should trigger a model review:
Pro Tip: For new product launches with no sales history, anchor your initial forecast to the performance of the closest comparable SKU in your portfolio, adjusted for distribution points and any known market differences. Treat the first 8–12 weeks of actual sales as a calibration period and update the model aggressively as data accumulates.
Demand forecasting is the single upstream input that determines whether your inventory, cash flow, and channel economics work together or against each other.
| Point | Details |
|---|---|
| Start at SKU-location level | Aggregate forecasts hide item-level variation; forecast at the lowest useful granularity and roll up. |
| Track MAPE and bias separately | MAPE measures error magnitude; bias reveals directional drift that inflates or deflates inventory over time. |
| Embed cross-functional input | Sales and marketing overrides improve accuracy when documented; undocumented overrides usually hurt it. |
| Match model to data maturity | Use exponential smoothing for stable SKUs with 12+ months of history; upgrade to causal or ML only when volume and complexity justify it. |
| Reddog ties forecasts to margin | Reddog helps CPG brands connect forecast outputs to contribution-margin-first reorder policies and channel economics. |
The conventional wisdom in demand forecasting is that more data and more sophisticated models always produce better results. In practice, that’s rarely where the biggest gains come from for emerging CPG brands.
The operators we work with at Reddog most often struggle not with model selection but with process discipline: forecasts that never get updated after the initial build, promotional lifts that live in a sales deck but never make it into the demand plan, and inventory decisions that get made on gut feel because the forecast isn’t trusted. A 3-period moving average that gets reviewed weekly and updated with real promotional data will outperform a sophisticated ML model that runs once a quarter and gets ignored.
The second trade-off that gets underestimated is the relationship between forecast accuracy and contribution margin. Most brands track forecast error as an operations metric, disconnected from the P&L. But every percentage point of MAPE at the SKU level translates directly into either excess inventory carrying cost or lost sales. When you forecast inventory with margin as the governing constraint, the model selection question changes: you’re not optimizing for lowest average error, you’re optimizing for the error profile that minimizes margin leakage across your channel mix.
That’s where consultancy adds the most value. Not in building a fancier model, but in aligning the forecasting process to the financial outcomes that actually matter for a growing CPG brand.
CPG founders managing inventory across Amazon, Walmart, and wholesale don’t need a more complex forecasting model. They need a forecasting process that connects directly to contribution margin, channel economics, and inventory velocity — and a team that understands the operational realities of FBA fees, WFS margin compression, and 3PL storage costs.
Reddog works with CPG brands in the $500K–$20M revenue range to build forecasting processes that are analytical, margin-focused, and built around measurable results. We help you identify where forecast error is leaking margin, align your demand plan with your reorder policies, and structure your inventory strategy across channels so that growth doesn’t come at the cost of cash flow.
If you’re a CPG founder or operator who wants a practical review of your contribution margin, inventory velocity, or channel economics, we’d welcome a conversation. Book a free 30-minute strategy session with Reddog — no pitch, just a focused working session on the numbers that matter most to your business.
Leave a comment: