
Published: March 2020 | Last Updated:August 2026
© Copyright 2026, Reddog Consulting Group.

Customer lifetime value (CLV) is the total gross profit a business expects to earn from a single customer over the entire duration of their relationship. The simplest formula to get started: Average Purchase Value × Purchase Frequency × Average Customer Lifespan. That one number tells you how much you can afford to spend acquiring a customer, how much to invest keeping them, and which segments deserve your most aggressive retention budget. According to Twilio’s CLV analysis, CLV can be calculated on both a revenue and a margin basis, and the distinction between those two versions matters enormously when you are setting CAC limits.
Stat to know: Bain & Company found that a rewards-driven retention program produced a measurable sales uplift over a year in retail tests, a direct signal of how CLV moves when you invest in the right levers.
Most teams start with the revenue-based formula and never move beyond it. That is a mistake. Here are four formulas, ordered by complexity and accuracy.
This is the basic formula used by Shopify and most commerce guides. It is fast to calculate and useful for directional thinking, but it ignores the cost of goods, channel fees, and returns.
Example inputs:
This is the version you should use for acquisition budgeting. If gross margin is 40%, the $600 revenue CLV above becomes $240 in margin CLV. That is the number that should cap your CAC, not $600.
Per Twilio’s formula guidance, this variant suits SaaS and subscription CPG brands. If ARPA is $30/month, gross margin is 60%, and monthly revenue churn is 5%, CLV = ($30 × 0.60) ÷ 0.05 = $360.
For brands with longer customer relationships and access to cohort-level data, DCF CLV applies a discount rate to future cash flows, reflecting the time value of money. This is the most accurate model but requires clean multi-year transaction data and a defined discount rate (typically your cost of capital or a proxy like 10%).
How to calculate each input:
Pro Tip: The most common input mistake is using total revenue (including returns and refunds) to calculate AOV. Pull net revenue after returns and channel fee deductions, or your CLV will be overstated from the first calculation.
Three modelling approaches dominate in practice, and the right one depends on your data maturity and what decision you are trying to make.
Historical CLV looks backward. You sum all revenue or gross profit a customer has generated to date. It is accurate for the past but tells you nothing about future behavior. Use it for reporting, investor decks, and understanding which cohorts have already delivered value.
Cohort-average CLV groups customers by acquisition period (month, quarter, or channel) and tracks their cumulative spend over time. This is the most practical model for most CPG and retail brands. It surfaces which acquisition channels produce the highest-value customers and how retention curves differ by cohort. You need at least 12 months of clean transaction data to make it meaningful.
Predictive CLV uses machine learning or probabilistic models (such as the BG/NBD model or Pareto/NBD) to forecast each customer’s future purchase probability and expected spend. It requires substantial transaction history, customer identifiers, and usually a dedicated analytics platform or data science resource. The payoff is per-customer CLV scores that feed segmentation and personalization engines in real time.
RetentionLab’s analysis makes a point worth internalizing: aggregate LTV is useful for C-suite reporting, but per-customer CLV is what drives operational spend decisions. Retention budgets allocated against an averaged number will systematically over-invest in low-value customers and under-invest in high-value ones.
For small datasets (fewer than 500 customers or less than 12 months of history), a simple cohort spreadsheet outperforms any predictive model. The model is only as good as the data feeding it.
Seven levers move CLV in a meaningful way. Understanding which ones to pull first is where most teams leave money on the table.
Stat to know: Bain found that loyalty rewards programs increased first-time customer acquisition by 22% and drove measurable repurchase rate improvements versus control groups in retail tests.
Pro Tip: Rank your levers by expected ROI before investing. Churn reduction and frequency improvements are almost always higher-ROI than AOV optimization for CPG brands, because they compound across the entire customer lifespan. Measure each lever with a 60–90 day A/B test before scaling spend.
CLV is not just a reporting metric. It is a decision engine. Here is how it translates into specific choices.
Acquisition budgeting. Your maximum allowable CAC is a direct function of CLV. If margin CLV is $240, and you target a 3:1 CLV:CAC ratio (a widely cited rule of thumb per Zendesk’s CLV guidance), your CAC ceiling is $80. Use revenue CLV instead and that ceiling jumps to $200, which can easily push you into unprofitable acquisition.
Retention investment prioritization. CLV segmentation tells you which customers are worth a premium retention offer and which are not. A customer with a predicted CLV of $800 justifies a $50 win-back offer. One with a predicted CLV of $60 does not.
Customer segmentation. CLV-based segments (high, mid, low value) outperform RFM segments for retention budget allocation because they incorporate margin, not just recency and frequency. You can reduce customer acquisition cost by reallocating spend toward channels that produce high-CLV customers.
Payback period. CLV divided by monthly margin contribution tells you how many months it takes to recover CAC. A 12-month payback is generally acceptable for a well-funded brand; 6 months or fewer is a strong signal of efficient acquisition. Payback period is often more useful than CLV:CAC for cash-flow-constrained operators.
Pricing and discount strategy. Discounting to acquire customers only makes sense if the margin CLV justifies the initial margin sacrifice. CLV modeling makes that tradeoff explicit rather than intuitive.
These tactics are ordered by typical ROI for CPG and retail brands. Start at the top and work down.
The second purchase is the strongest predictor of long-term retention. Build a 3-email or SMS sequence triggered within 7 days of first purchase. KPI: Second-purchase rate within 30 days. Test: A/B test a discount offer versus a content-led sequence (recipe, usage guide, how-to).

Bain’s retail data shows rewards programs drive measurable repurchase rate improvements and a measurable sales uplift over 12 months. Points-based programs work; tiered programs that reward your highest-CLV customers with exclusive access work even better. KPI: Repeat purchase rate among enrolled vs. non-enrolled customers.
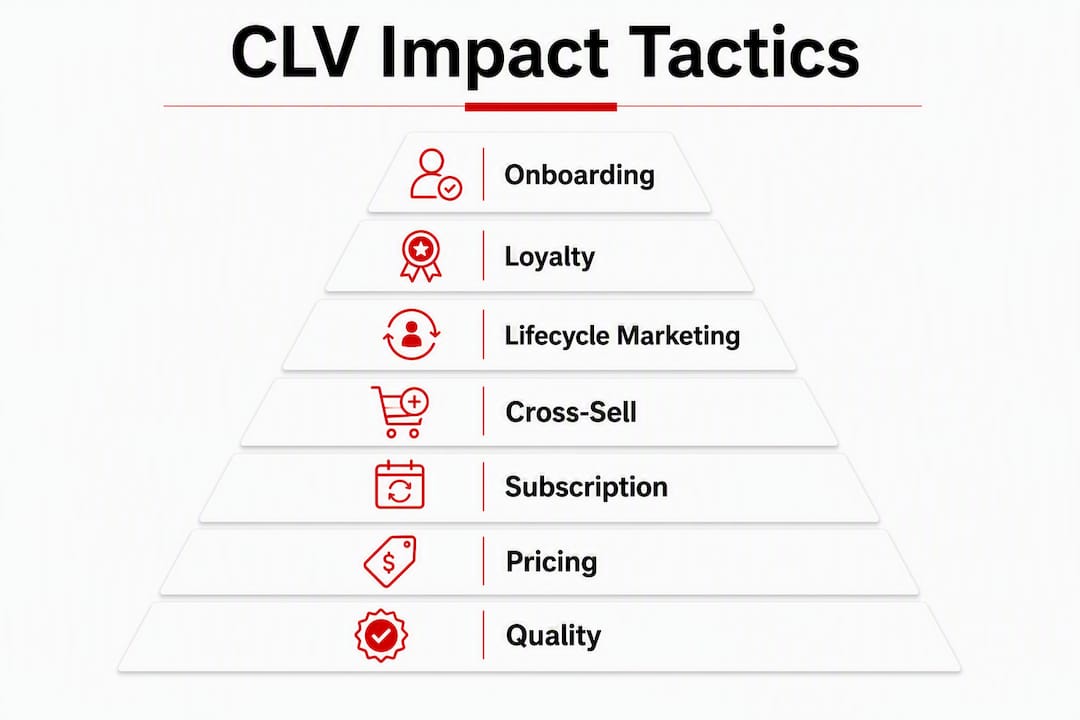
Automated lifecycle flows (win-back, replenishment reminders, cross-sell triggers) are the highest-ROI retention channel for most CPG brands. Segment by CLV tier so your highest-value customers receive your most personalized messaging. KPI: Revenue per email sent by segment. You can explore lifecycle marketing tactics that CPG brands use to extend customer relationships across channels.
Post-purchase pages, replenishment emails, and bundle offers are the three highest-converting cross-sell moments. Focus on adjacent SKUs with higher gross margins than the initial purchase. KPI: Attach rate (% of customers who buy a second SKU within 90 days).
For consumable CPG products, subscription converts a transactional customer into a predictable revenue stream. Even a 10–15% subscriber base materially improves average customer lifespan. KPI: Subscriber retention rate at 3 and 6 months.
Raising prices on low-elasticity SKUs or shifting promotional spend toward higher-margin products lifts margin CLV without requiring more customers. KPI: Gross margin % by SKU and channel, tracked quarterly.
Repeat purchase is ultimately driven by product satisfaction. Net Promoter Score (NPS) and post-purchase review rates are leading indicators of future CLV. KPI: NPS trend and 5-star review rate on Amazon and DTC channels.
Pro Tip: Run a 60-day A/B test on your onboarding sequence before investing in a full loyalty program build. Second-purchase rate improvement is the fastest signal that your retention foundation is working, and it costs almost nothing to test.
The difference between revenue and margin CLV is not academic. It directly changes how much you should spend acquiring a customer.
| Input | Value |
|---|---|
| Average Order Value (AOV) | $60 |
| Purchase Frequency | 4x per year |
| Average Customer Lifespan | 3 years |
| Revenue CLV | $720 |

Formula: $60 × 4 × 3 = $720
| Input | Value |
|---|---|
| AOV (net of returns) | $57 |
| Purchase Frequency | 4x per year |
| Average Customer Lifespan | 3 years |
| Margin CLV | $259 |
Formula: $57 × 4 × 3 × 0.38 = $259
The American Express business guide on CLV makes this point clearly: the same purchase pattern produces a dramatically smaller margin-based CLV than a revenue-based one, and that gap is exactly what gets CPG brands into trouble when they set CAC targets against the wrong number.
Revenue CLV:   =AOV * PurchaseFrequency * AvgLifespan
Margin CLV:    =AOV_Net * PurchaseFrequency * AvgLifespan * GrossMarginPct
Avg Lifespan:  =1 / AnnualChurnRate
Subscription:  =(ARPA * GrossMarginPct) / RevenueChurnRate
Set each variable as a named cell so you can run scenarios by changing a single input. A 5-percentage-point improvement in gross margin or a 10-point reduction in churn will show its full CLV impact immediately.
There is no universal benchmark, and any guide that gives you one without context is misleading you. CLV varies by business model, channel mix, product category, and how the metric is defined.
The CLV:CAC rule of thumb. A 3:1 ratio (CLV to CAC) is the most commonly cited target, per Zendesk’s CLV guidance. But that ratio only holds if CLV is calculated on a gross-profit basis. Revenue-based CLV inflates the numerator and can justify CAC levels that destroy margin.
Stat to know: Bain’s retail research found that rewards programs drove a significant increase in first-time customer acquisition, which directly improves the CLV:CAC ratio by lowering effective CAC while raising future purchase probability.
Before comparing to any published benchmark, check:
The most useful benchmark is your own prior cohort. If CLV for customers acquired in Q1 2025 is 15% higher than those acquired in Q1 2024, you are moving in the right direction regardless of what an industry report says.
For CPG brands, revenue-based CLV is not just imprecise. It can actively mislead channel investment decisions. Here is why.
Amazon FBA fees, Walmart WFS fees, retail slotting allowances, and 3PL storage costs all reduce the actual margin contribution of a sale. A $60 order on Amazon might net $22 in gross profit after FBA fees, COGS, and advertising. The same $60 order on DTC might net $34. The revenue CLV looks identical across channels. The margin CLV is 55% higher on DTC.
Channel-level CLV checklist:
Pro Tip: Aggregate LTV is useful for investor reporting, but per-customer CLV scoring is what drives smart retention spend. Per RetentionLab’s guidance, allocating retention budgets against an averaged number will systematically over-invest in low-value customers. Score customers individually and set retention spend thresholds by CLV tier.
Two CPG-specific pitfalls Reddog sees repeatedly: brands over-investing in Amazon retention for customers who will never repurchase at a margin-positive level, and brands using aggregate LTV to justify blanket discount campaigns that cannibalize margin from their highest-value DTC customers. Both errors disappear when you work from margin CLV at the channel and customer level. For CPG-specific retention strategies that account for these channel dynamics, the approach starts with contribution margin, not top-line revenue.
CLV is only as accurate as the data feeding it. Before choosing a tool, confirm you have the right inputs.
Data checklist:
Tool categories:
Spreadsheet models (Excel, Google Sheets) work well for brands under $5M in revenue or with fewer than 10,000 customers. The formulas in the worked examples section above are sufficient for cohort-level CLV. The limit is manual data refresh and no per-customer scoring.
BI and analytics platforms (Looker, Tableau, Power BI) connect to your transaction data and automate cohort CLV reporting. These are the right choice when you need CLV by channel, SKU, or acquisition source updated weekly.
Predictive CLV platforms (tools built on BG/NBD or machine learning models) produce per-customer CLV scores and churn probabilities. They require clean customer identifiers and substantial transaction history. Worth evaluating when you cross $10M in revenue or when personalization at scale becomes a priority.
CDPs and retention platforms (Klaviyo, Attentive, Salesforce Marketing Cloud) can ingest CLV scores and trigger lifecycle flows based on customer value tier. These are the execution layer, not the calculation layer.
Build vs. buy: A spreadsheet cohort model is the right starting point for most CPG brands. Move to a dedicated analytics platform when manual refresh becomes a bottleneck or when you need channel-level CLV segmentation to inform weekly spend decisions. Understanding how to calculate customer retention rate is a prerequisite for any CLV model, since churn rate is the most sensitive input in the lifespan calculation.
Margin-aware CLV, calculated at the channel and customer level, is the single most reliable metric for setting acquisition budgets, retention spend, and channel investment priorities in CPG and retail.
| Point | Details |
|---|---|
| Use margin CLV for budgeting | Revenue CLV overstates value; always apply gross margin % before setting CAC limits. |
| Churn rate drives lifespan | A 10-point churn reduction extends average customer lifespan more than any AOV tactic. |
| CLV:CAC target is 3:1 | This ratio only holds when CLV is gross-profit based, not revenue based. |
| Channel fees distort CPG CLV | FBA, WFS, and 3PL costs must be subtracted to get accurate margin CLV by channel. |
| Reddog’s approach | Reddog builds contribution-margin CLV models for CPG brands to identify where margin leaks and where retention spend actually pays off. |
The most persistent mistake we see CPG founders make is treating CLV as a finance metric rather than an operating tool. They calculate it once for a board deck, file it away, and go back to optimizing ROAS. That is exactly backwards.
At Reddog, we apply CLV thinking at the channel and customer level from the first engagement. For CPG brands in the $500K–$20M range, the gap between revenue CLV and margin CLV is almost always larger than founders expect, often by 40–60%, once you account for Amazon FBA fees, retail deductions, and returns. That gap is not just a math problem. It is a strategic one: brands that budget CAC against revenue CLV consistently over-invest in low-margin acquisition channels and under-fund the retention programs that would actually move the needle.
The other pattern we see: brands that invest in customer loyalty programs without first fixing their onboarding sequence. Loyalty rewards work best when the customer already has a habit. If second-purchase rate is below 30%, fix onboarding before building a points program. The sequence matters as much as the tactic.
CLV is data, but it is also a lens. When you look at every channel decision, every promotional offer, and every retention investment through the lens of margin CLV, the right moves become much clearer. That clarity is what we help CPG brands build.
Knowing your CLV formula is one thing. Knowing what it means for your specific channel mix, margin structure, and acquisition spend is another. For CPG founders and operators navigating Amazon, Walmart, DTC, and wholesale simultaneously, the numbers rarely tell a clean story without the right framework behind them.
Reddog works with CPG brands in the $500K–$20M range to build contribution-margin CLV models that connect directly to channel economics, inventory velocity, and growth planning. If you want a clear picture of where your margin is going and which customers are actually worth acquiring, we can help you build that.
Book a free 30-minute strategy call with the Reddog team. We will review your current CLV inputs, identify the biggest margin leaks in your channel mix, and give you a practical framework for setting acquisition and retention budgets that hold up under real operating conditions. No pressure, no pitch deck. Just a focused working session on the numbers that matter.
These sources informed the formulas, benchmarks, and sector guidance throughout this article.
Leave a comment: