
Published: March 2020 | Last Updated:July 2026
© Copyright 2026, Reddog Consulting Group.

TL;DR:
- Clickstream analysis provides SKU-level insights into shopper behavior to identify margin leaks in CPG brands.
- Real-time processing enables quick detection of issues like checkout friction and SKU misrouting, improving margins and growth.
Clickstream analysis is the practice of collecting and analyzing the sequence of user events — clicks, page views, searches, add-to-carts, and scrolls — to understand shopper intent and optimize conversion. For CPG founders, that translates directly to one thing: finding where margin leaks and fixing them before they compound. Whether you’re running sponsored placements on Amazon, managing a Walmart WFS catalog, or scaling DTC, clickstream data tells you exactly where shoppers stall, which SKUs bleed return rates, and whether your retail media spend is actually moving product. Reddog uses this lens on every engagement because top-line growth without margin clarity is just expensive noise.
Every meaningful shopper interaction fires an event. A well-instrumented CPG storefront or marketplace listing captures the following at minimum:
| Event Type | Key Fields to Capture |
|---|---|
| Page view | URL, referrer, timestamp, session ID, device |
| Product view | SKU, price, category, campaign source |
| Search query | Query string, results count, position clicked |
| Add-to-cart | SKU, quantity, price, coupon code |
| Cart remove | SKU, quantity, removal trigger |
| Begin checkout | Cart value, item count, shipping method shown |
| Payment attempt | Status (success/fail), gateway, order total |
| Promotion view | Promo ID, SKU, placement, impression source |
| Session start/end | Duration, scroll depth, page count |
Each event should carry a consistent JSON structure: a hashed user identifier, a session ID, a precise UTC timestamp, the product SKU, and campaign/source metadata. The most common instrumentation failure is a missing or inconsistent SKU key — without it, you cannot tie behavior to margin at the product level.
Pro Tip: Set a schema validation rule at the collector layer that rejects any event missing a SKU or session ID. Catching bad data at ingestion costs nothing; cleaning it downstream costs days.
A well-structured event schema is the foundation of the entire analysis stack. Get the taxonomy right before you pick a vendor.
Standard sales reporting tells you what sold. Clickstream tells you why it didn’t. For CPG brands operating across Amazon, Walmart, and DTC simultaneously, the gap between those two questions is where margin hides.
Three specific levers matter most. First, checkout friction: a spike in begin-checkout events that don’t reach payment attempt usually signals a shipping cost surprise or a coupon field that breaks on mobile. Second, SKU misrouting: shoppers landing on the wrong variant (wrong size, wrong flavor) inflate return rates and erode contribution margin on otherwise healthy SKUs. Third, retail media attribution gaps. RMN-native metrics — clicks and impressions — don’t show you the path after the click. Clickstream fills that gap, revealing whether sponsored traffic actually converts or just inflates your ad spend.
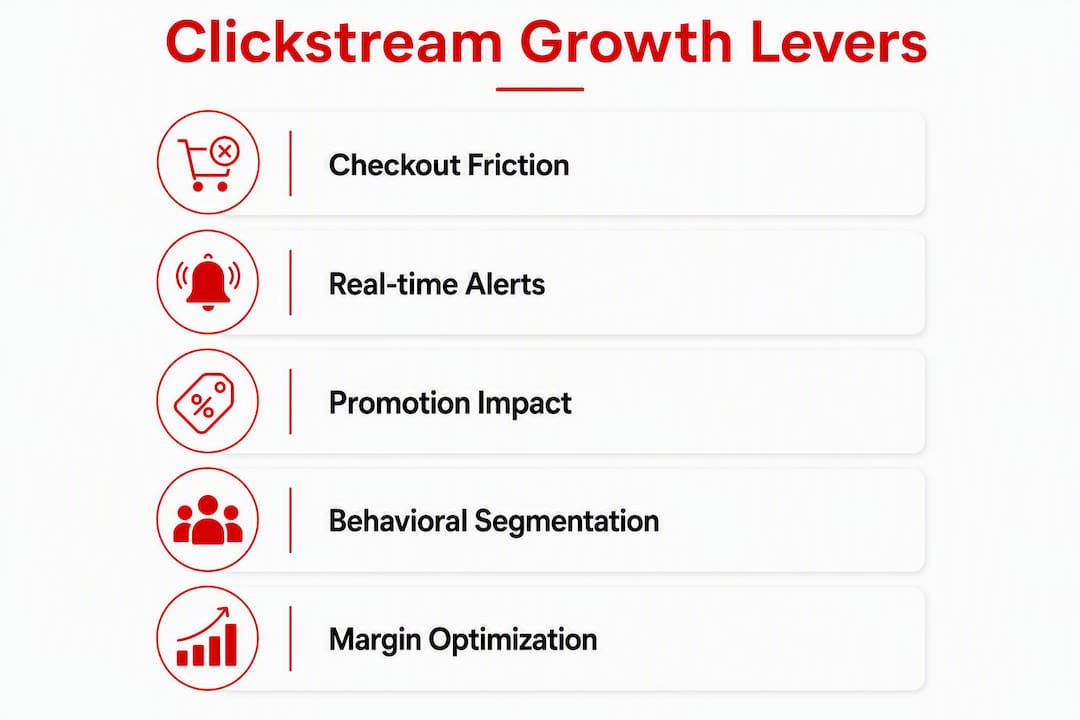
Real-time processing is the operational advantage that separates clickstream from standard reporting. Streaming SQL yields seconds-level data freshness versus 30 minutes to 4 hours for warehouse ETL and 24–48 hours for standard analytics dashboards. During a flash sale or similar event, that difference determines whether you catch a payment gateway failure quickly or discover it much later after losing revenue.
Pro Tip: Set a real-time alert on payment attempt failure rate. A threshold breach above 2% during a live promotion is almost always a gateway or feed issue, not a demand problem.
These two tools answer different questions. Use both.
| Dimension | Clickstream (raw events) | Google Analytics (aggregated) |
|---|---|---|
| Data freshness | Seconds | Hours to days |
| Raw event access | Full, queryable | Sampled, aggregated |
| Custom funnel flexibility | Unlimited | Template-constrained |
| Session reconstruction | Yes, with full path | Partial |
| Primary use | Live operations, anomaly detection | Acquisition benchmarking |
| Cost at scale | Storage + compute | Free tier, then per-hit |
Clickstream complements GA rather than replacing it. GA handles acquisition attribution and channel benchmarking well. Clickstream handles real-time merchandising decisions, custom funnel definitions, and SKU-level behavior that GA’s data model was never designed for.
Pro Tip: Run GA for your weekly acquisition review and clickstream for your daily ops standup. They answer different questions on different timelines.
Getting clickstream right requires discipline at each stage of the pipeline. Work through these steps in order:
Common pitfalls: timestamp drift between client and server (always use server-side timestamps as the canonical record), incomplete referral capture on marketplace deep links, and enrichment jobs that run hours after ingestion and break real-time views.
Pro Tip: Instrument your checkout funnel first. It’s the highest-value segment and the fastest path to a measurable margin improvement.
The fastest wins for CPG brands come from four areas:
Cart abandonment recovery. A real-time trigger fires when a session ends with items in cart and no payment attempt. Pair that with an email or push sequence via your omnichannel marketing workflow for same-session recovery.

Live promo effectiveness. Measure add-to-cart rate per SKU before and during a promotion. A promo that drives traffic but doesn’t move the add-to-cart needle is a margin drain, not a growth lever.
Anomaly detection. Real-time clickstream catches payment gateway outages, feed errors, and traffic spikes within seconds. Standard dashboards surface these hours later.
Behavioral segmentation. AI-driven persona synthesis from clickstream data lets you define narrow cohorts — High-Intent Researchers who view a product multiple times before buying, Price-Sensitive Repeaters who only convert with a coupon, and Voucher Hunters who inflate promo redemption without adding long-term value. Each cohort gets a different intervention, not the same blast. Reddog’s data-driven marketing work shows this segmentation approach consistently outperforms broad audience targeting.
Pro Tip: Prioritize fixes that reduce return drivers and shipping surprises over vanity conversion metrics. A 0.5% improvement in contribution margin per order compounds faster than a 2% lift in raw conversion rate.
The vendor landscape breaks into three layers. Match your selection to your data ownership requirements and team capacity.
Event collectors and CDPs:
Product analytics:
Selection criteria: data ownership model, real-time capability, integration with Amazon and Walmart APIs, cost structure (per-event vs. storage-based), and time-to-first-signal. For most CPG brands in the $500K–$20M range, a Segment or RudderStack collector feeding a cloud warehouse covers 80% of use cases without heavy engineering. Pair with omnichannel platform guidance to map the full stack.
| KPI | What It Measures | Baseline Target |
|---|---|---|
| Funnel conversion rate | % of sessions reaching purchase | Establish by SKU, not sitewide |
| SKU-level add-to-cart rate | Demand signal per product | Compare pre/post promo |
| Average order value | Revenue efficiency per transaction | Track by cohort |
| Contribution margin impact | Net margin after COGS, fees, returns | Primary success metric |
| Return rate by SKU | Margin leak indicator | Flag SKUs above category average |
| Time-to-detect outages | Operational resilience | Target under 5 minutes |
Experiment design follows a simple sequence: state a hypothesis tied to a specific event (e.g., “removing the coupon field from mobile checkout will reduce abandonment by X%”), instrument the required events, run a two-week holdout, measure the delta in contribution margin, and attribute causally before scaling the fix. Analytics-driven experiments consistently outperform intuition-based changes when the measurement window is long enough to filter noise.
A common mistake: focusing on click counts rather than quality-of-attention metrics like engagement duration and checkout completion rate. Long sessions from low-spend segments often indicate friction, not interest.
Reddog’s diagnostic approach starts with the checkout funnel, not the homepage. On a recent engagement with a growth-stage CPG brand scaling across Amazon and DTC, the starting problem was a return rate on a core SKU running higher than typical for the category, with no obvious product defect.
The events we captured: product view, add-to-cart, begin-checkout, payment attempt, and post-purchase return initiation. Analysis showed a consistent drop between begin-checkout and payment attempt on mobile, concentrated among shoppers arriving from a specific sponsored placement. The shipping cost shown at checkout was higher than the ad copy implied.
The fix was a pricing and messaging alignment, not a product change. Contribution margin on that SKU improved within the first full measurement window.
Clickstream doesn’t just show you what happened. It shows you exactly where the money left the funnel and why — which is the only starting point that leads to a fix worth making.
Reddog handles strategy, instrumentation oversight, and KPI design. The brand’s internal team or a CDP vendor implements the technical fixes. The analytics-to-growth connection is what makes the difference between a data project and a margin improvement.
First experiment template: Hypothesis — “Adding a shipping cost callout on the product page will reduce checkout abandonment.” Required events: product view, begin-checkout, payment attempt. Sample size: enough sessions to detect a 10% relative change (your analytics tool’s power calculator will give you the exact number). Measurement window: 14 days. Expected signal: a measurable shift in begin-checkout-to-payment-attempt rate.
Roles to involve: growth lead (hypothesis and KPI ownership), analytics engineer (instrumentation), and ops (margin calculation). Time to first signal: hours for instrumentation, 3–5 days for statistically meaningful data on a mid-volume SKU.
Pro Tip: Don’t instrument everything at once. Start with the checkout funnel, get clean data, prove one win, then expand the taxonomy.
Clickstream analysis gives CPG brands the event-level visibility to find margin leaks, run controlled experiments, and make channel decisions based on what shoppers actually do, not what aggregate reports suggest.
| Point | Details |
|---|---|
| Instrument SKU-level events first | Product view and add-to-cart events are the minimum viable taxonomy for CPG margin analysis. |
| Real-time beats batch for operations | Streaming SQL delivers seconds-level freshness versus 24–48 hours for standard dashboards, critical during promotions. |
| Measure contribution margin, not just conversion | A conversion lift that increases returns or ad spend without improving net margin is not a real win. |
| Start with Segment or RudderStack | For most CPG brands in the $500K–$20M range, a managed collector feeding a cloud warehouse covers the core use cases. |
| Reddog’s diagnostic approach | Reddog applies clickstream instrumentation and KPI design to find margin leaks and prioritize fixes across Amazon, Walmart, and DTC channels. |
Most CPG founders who come to us have the same problem: they have data, but not the right data at the right granularity. They can see total conversion rate. They cannot see which SKU, which placement, and which device combination is bleeding margin.
Our honest advice: keep your event taxonomy minimal and SKU-centric for the first 90 days. The temptation to instrument everything produces noisy, expensive data that nobody acts on. One clean funnel with five events and a real margin question attached to it is worth more than a 200-event schema with no owner.
Invest in real-time alerting for promotional events before you invest in AI personalization. The operational protection alone pays for the instrumentation. Personalization comes second, after you’ve closed the obvious leaks.
On resourcing: most brands in the $500K–$20M range don’t need a full-time data engineer to start. A managed CDP like Segment or RudderStack, a growth lead who owns the KPI framework, and a clear business question will get you to first signal faster than a six-month data platform build. When the questions get more complex, that’s when you bring in deeper engineering capacity.
CPG brands that understand their funnel at the SKU level make better channel decisions, protect margin during promotions, and scale with fewer costly surprises. That’s the practical payoff of getting clickstream right.
Reddog works with CPG founders and operators in the $500K–$20M range who need structured growth planning, marketplace optimization, and the kind of margin clarity that comes from knowing exactly where revenue is leaking. If you’re ready to move from aggregate reporting to event-level insight, the next step is a focused conversation.
Book a free 30-minute strategy call with the Reddog team. Bring your P&L by channel, your SKU-level sales data, and any recent promo performance you want to pressure-test. We’ll identify the highest-leverage clickstream experiments for your specific channel mix and give you a prioritized starting point you can act on this quarter.
Leave a comment: