
Published: March 2020 | Last Updated:August 2026
© Copyright 2026, Reddog Consulting Group.

Attribution modeling assigns credit for conversions across the marketing touchpoints that influenced a customer’s decision to buy. In plain terms, it answers the question: which channels and interactions deserve credit when a sale happens? Tools like GA4, HubSpot, and Adjust all implement attribution in some form, but the model you choose shapes the answer you get. Attribution shows you which touchpoints were present in the path to conversion. It does not prove that any single touchpoint caused the sale. When that causal question matters, especially for budget decisions with real dollar consequences, you need incrementality testing or Marketing Mix Modeling alongside your attribution data.
Attribution modeling assigns credit to marketing touchpoints, but it explains presence in the conversion path, not causation. For CPG and retail brands especially, pairing attribution with incrementality testing or MMM is what separates confident budget decisions from expensive guesses.
| Point | Details |
|---|---|
| Attribution shows presence, not cause | Attribution identifies which touchpoints appeared in the path; only incrementality testing reveals causal lift. |
| Model choice depends on your cycle and data | Match the model to your sales cycle length, channel mix, and monthly conversion volume before choosing. |
| Data-driven requires volume | GA4’s data-driven model needs roughly 400 monthly conversions to activate; below that, use a rule-based multi-touch model. |
| CPG needs more than attribution | Retail purchases happen off-site; supplement attribution with incrementality tests or MMM for material budget decisions. |
| Reddog for CPG measurement strategy | Reddog helps CPG brands align attribution, contribution margin, and channel economics across omnichannel retail. |
Every time a customer converts, they have typically interacted with your brand more than once. Attribution modeling is the set of rules that decides how much credit each of those interactions receives. According to HubSpot, models fall into two broad categories: single-touch (100% of credit goes to one touchpoint) and multi-touch (credit is split fractionally across the path).
The core elements you need to understand before choosing a model:
The flow from raw data to a report looks like this:
Single-touch models are fast to implement and easy to explain to stakeholders. Multi-touch models are more realistic, but require cleaner data and more interpretive judgment.
Campaign Manager’s documentation covers the standard model set clearly, including concrete examples of credit allocation. Here is a working catalog of each model, who it favors, and where it breaks down.
First-touch: 100% of credit goes to the first interaction. Useful for measuring awareness campaigns and top-of-funnel channel performance. Weakness: ignores everything that closed the deal.
Last-touch: 100% of credit goes to the final interaction before conversion. The default in many legacy platforms. Useful when your goal is to measure closing channels. Weakness: systematically undervalues awareness and nurture.
Last non-direct: Same as last-touch but excludes direct traffic. Prevents branded search or direct visits from absorbing credit that a prior channel earned. A practical improvement over pure last-touch for most teams.
Linear: Credit is split equally across all touchpoints. Useful when you genuinely cannot rank the importance of interactions. Weakness: treats a brand awareness display impression the same as a high-intent paid search click.
Time-decay: Touchpoints closer to conversion receive more credit. Campaign Manager uses a 7-day half-life by default, meaning a touchpoint 7 days before conversion gets half the credit of one that happened the day before. Useful for short sales cycles where recency matters. Weakness: penalizes top-of-funnel channels that seeded demand weeks earlier.
Position-based (U-shaped): 40% to the first touch, 40% to the last touch, and 20% distributed across the middle. Useful for teams that want to value both discovery and closing without abandoning the middle entirely.
W-shaped: Splits credit across three key moments: first touch, lead creation, and opportunity creation, typically 30% each with the remaining 10% spread across other touches. Useful for B2B and SaaS teams with defined pipeline stages.
Data-driven / algorithmic: Uses machine learning to assign fractional credit based on the actual statistical contribution of each touchpoint in your historical data. GA4’s data-driven model is the most accessible implementation for most marketers. Useful when you have sufficient conversion volume and want the model to reflect your actual customer behavior rather than a rule you invented.
Pro Tip: Data-driven attribution in GA4 typically requires a minimum of 400 conversions and 4,000 ad interactions within a 30-day window to produce reliable results. If your account doesn’t hit those thresholds, GA4 defaults to last-click. Check your model assignment in the Attribution settings panel before assuming you’re running data-driven.
A few concrete examples to make the differences visible:
A user sees a Facebook ad, reads your blog via organic search, clicks a retargeting ad, then converts via a branded paid search click. Under first-touch, Facebook gets everything. Under last-touch, branded paid search gets everything. Three models, three completely different budget implications from the same customer journey.
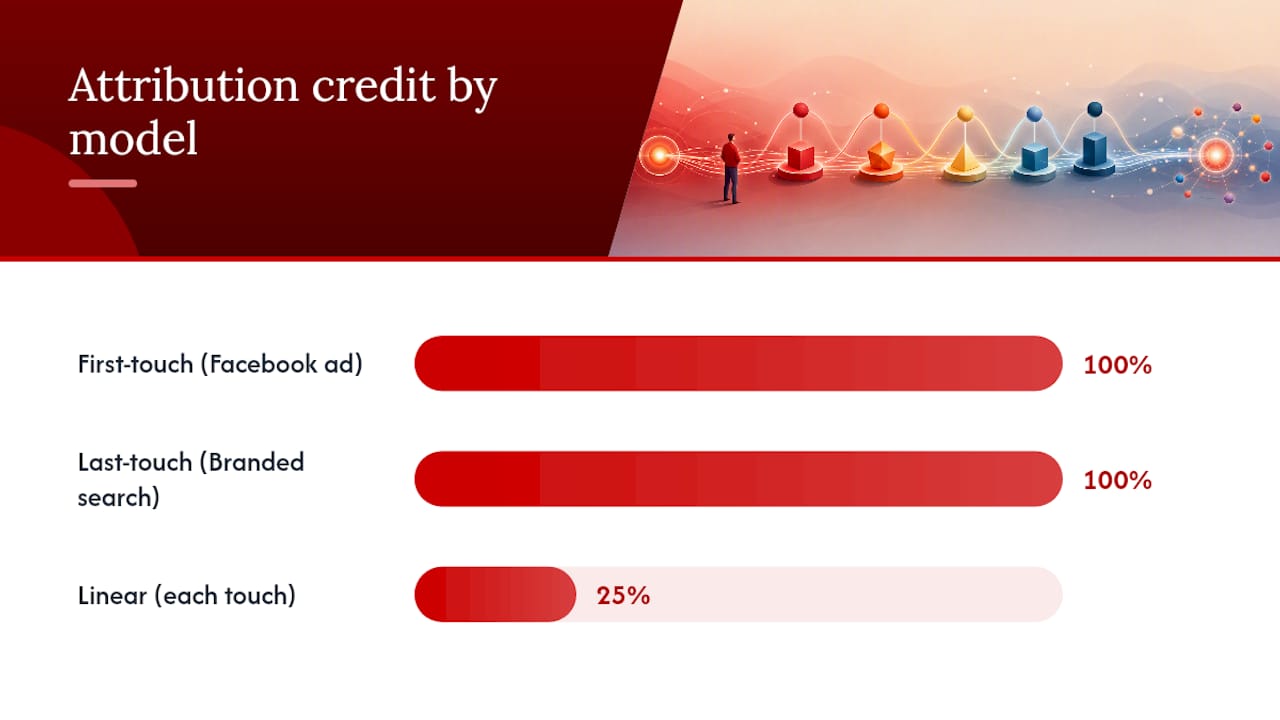
Consider this four-step path to conversion, with a $100 order value:
Here is how each model allocates that $100:
The same data, the same customer, and the same $100 sale produce four different stories about which channel drove growth. That is not a flaw in the models. It is a reminder that each model answers a slightly different question, and choosing the wrong one for your decision leads to misallocated budget.
Amplitude’s attribution framework guide makes the point plainly: there is no universal best model. The right choice depends on your sales cycle, channel mix, conversion volume, and the specific decision you are trying to make.
Work through these criteria before committing to a model:
Quick picks by team profile:
Small DTC teams with short purchase cycles and limited channel mix should start with U-shaped or last non-direct. It balances discovery and closing without requiring a data science team to interpret.
Growing B2B or SaaS teams with multi-week sales cycles and defined pipeline stages will get more from W-shaped, since it explicitly values lead creation and opportunity creation as distinct milestones.
Enterprise CPG brands with complex omnichannel paths, retail media, and trade promotion should treat attribution as one input among several. Pair it with incrementality testing and MMM for budget decisions above a material threshold.
Pro Tip: Start with U-shaped if you’re unsure. It’s the most defensible rule-based model for most growth-stage teams because it rewards both acquisition and conversion without requiring algorithmic prerequisites. Upgrade to data-driven once you consistently exceed 400 monthly conversions in a single property.
Attribution is only as good as the data feeding it, and several structural problems can make your reports confidently wrong.
Common red flags to watch for:
Quick mitigation steps: align conversion definitions across every team before you build reports, implement server-side tagging to reduce cookie loss, maintain a single customer ID across platforms where technically feasible, and run periodic holdout tests to pressure-check your attributed numbers against actual lift.
For CPG brands selling through retail, attribution modeling hits a structural wall. Purchases happen at Target, Walmart, or a regional grocery chain, not on your website. There is no checkout pixel. Forcing last-click attribution onto a retail-driven business produces channel valuations that are directionally misleading.

IPN’s CPG Measurement Gap report documents this clearly: a meaningful share of CPG marketers still rely on directional assumptions rather than precise attribution, driven by disconnected data systems and misaligned KPIs across teams. Organizational fragmentation, not just technical limitations, is often the real blocker.
The measurement gap shows up in three specific ways for CPG:
When to run incrementality tests: Use A/B holdouts or store-level geo tests when you need to know whether a specific campaign actually lifted sales, not just whether it was present in the conversion path. Circana’s analysis shows that incremental ROAS (iROAS) can differ materially from attributed ROAS, and iROAS is the more reliable metric for strategic budget decisions.
When to use MMM or Commercial Analytics: When you need to model all commercial drivers together, including trade, pricing, distribution, and retail media, Analytic Partners recommends modeling them as a system rather than measuring each channel in isolation. This approach estimates the counterfactual: what would have sold without the spend.
A three-step decision flow for CPG measurement:
For grocery CPG specifically, a three-layer signal approach combining social signals, retail-level data (Instacart cart adds, regional velocity), and share-of-voice can produce operationally useful directional signals even where closed-loop purchase data is unavailable. Understanding omnichannel attribution becomes critical at this stage.
Pro Tip: For CPG brands, real-time cart-add velocity and regional sell-through data are often more useful for in-flight campaign decisions than waiting for syndicated panel data to refresh. Build a signal layer that includes retail operational data, not just ad platform metrics.
Getting attribution right is a sequenced process; for agency-focused measurement strategies and practical analytics tactics, see Why Measure SEO Performance for Agencies. Rushing to a sophisticated model before the data layer is clean produces confident-looking reports built on bad inputs.
Step-by-step implementation:
Timeline estimates:
Cost considerations by scope:
Governance matters as much as tooling. Assign a single owner for measurement definitions, version your model changes so historical comparisons remain valid, and document every change in a shared log. For a deeper look at revenue attribution governance, the technical prerequisites and ownership structures are worth reviewing before you scale.
Understanding what each tool does, and what it doesn’t, prevents the most common vendor misconceptions.
GA4 (Google Analytics 4): GA4’s data-driven attribution model uses machine learning to assign fractional credit across Google’s own channels. It is the most accessible algorithmic model for most digital marketers and integrates directly with Google Ads bidding. Its primary limitation is that it operates within Google’s ecosystem. Cross-channel paths that include Meta, email, or offline touchpoints require additional integration work. GA4 also requires sufficient conversion volume for data-driven to activate; below the threshold, it defaults to last-click.
Adjust: Adjust is a mobile measurement partner (MMP) focused on app attribution. It tracks installs, in-app events, and re-engagement across mobile channels, and its glossary documentation clarifies that mobile attribution often defaults to last-touch given the constraints of mobile tracking. Adjust is the right tool when your conversion funnel runs through a mobile app. It is not a substitute for web or omnichannel attribution.
HubSpot: HubSpot’s attribution reporting covers the full set of rule-based models (first-touch, last-touch, linear, time-decay, U-shaped, W-shaped) and applies them to contacts and deals within its CRM. It is particularly useful for B2B teams because it ties attribution to pipeline stages and revenue, not just web sessions. Its limitation is that it only sees touchpoints that HubSpot itself tracks, so channels outside the HubSpot ecosystem require manual integration.
The critical distinction across all three: these platforms report channel credit based on observed touchpoints. None of them run causal incrementality tests or MMM. They tell you which channels were present in the path. They do not tell you which channels would have been missed if you had cut the spend. For that question, you need a separate measurement layer. Pairing attribution data with cross-channel marketing strategy helps you interpret what the numbers actually mean for budget decisions.
Most teams start with last-touch because it’s the default. It’s fast, it’s simple, and it gives a clean answer. The problem is that clean answer is usually wrong for any brand running more than two or three channels.
The typical evolution looks like this: last-touch for the first year, then U-shaped or linear once someone notices that awareness channels are being defunded, then data-driven or a hybrid stack once conversion volume justifies it. The teams that skip steps, jumping straight to algorithmic models without clean data infrastructure, end up with sophisticated-looking outputs built on incomplete paths and inconsistent event naming.
What we see consistently at Reddog is that early-stage teams benefit most from getting the data layer right before upgrading the model. A well-tagged U-shaped model beats a poorly-tagged data-driven model every time. For enterprise and CPG teams, the bigger risk is the opposite: staying too long with a single attribution model and treating attributed ROAS as a proxy for true business impact. When a channel’s attributed ROAS looks strong but incrementality tests show minimal lift, you are optimizing for a metric that doesn’t reflect reality. That gap between attributed and incremental performance is where budget gets wasted at scale. Understanding why ROI measurement matters in a contribution-margin context is the lens that keeps attribution honest.
Attribution modeling is one piece of a larger measurement system, and for CPG brands navigating Amazon, Walmart, DTC, and retail simultaneously, getting that system right is where margin is won or lost.

Reddog works with CPG founders and operators to wire measurement strategy across channels, align attribution with contribution-margin economics, and identify where platform-reported numbers diverge from actual business performance. Our work covers omnichannel attribution setup, incrementality testing design, MMM integration, and channel economics analysis, built for brands in the $500K–$20M revenue range that need structured clarity, not generic dashboards.
If you want a practical review of your current measurement setup, including how your attribution model maps to contribution margin, channel economics, and inventory velocity, book a free 30-minute strategy call with the Reddog team. No pitch, just a focused working session on what your numbers are actually telling you.
For model-by-model definitions, start with Campaign Manager’s documentation, which includes concrete credit-allocation examples for every standard model.
Leave a comment: