
Published: March 2020 | Last Updated:August 2026
© Copyright 2026, Reddog Consulting Group.

For CPG founders, the types of sales funnels that actually matter are distribution channels, and each one produces a fundamentally different per-unit P&L. The nine channels relevant to growth-stage brands are: DTC (Shopify/own storefront), Amazon FBA and Seller-Fulfilled, Walmart Marketplace/WFS, wholesale to retailers, distributors, club stores, grocery/foodservice, subscription/replenishment, and other marketplaces (Instacart, Target+, specialty). The single most important tradeoff across all of them is contribution margin versus cash timing and inventory velocity. A channel that looks attractive on revenue can quietly destroy working capital if payment terms are 60 days and turns are slow.
Quick tradeoff snapshot:
| Channel | Typical contribution margin midpoint | Cash timing | Inventory velocity |
|---|---|---|---|
| DTC | ~35% | Immediate | Moderate |
| Retail/wholesale | ~30% | Net 30–60 | Slow to moderate |
| Amazon FBA | ~18% | Net 14 | Fast |
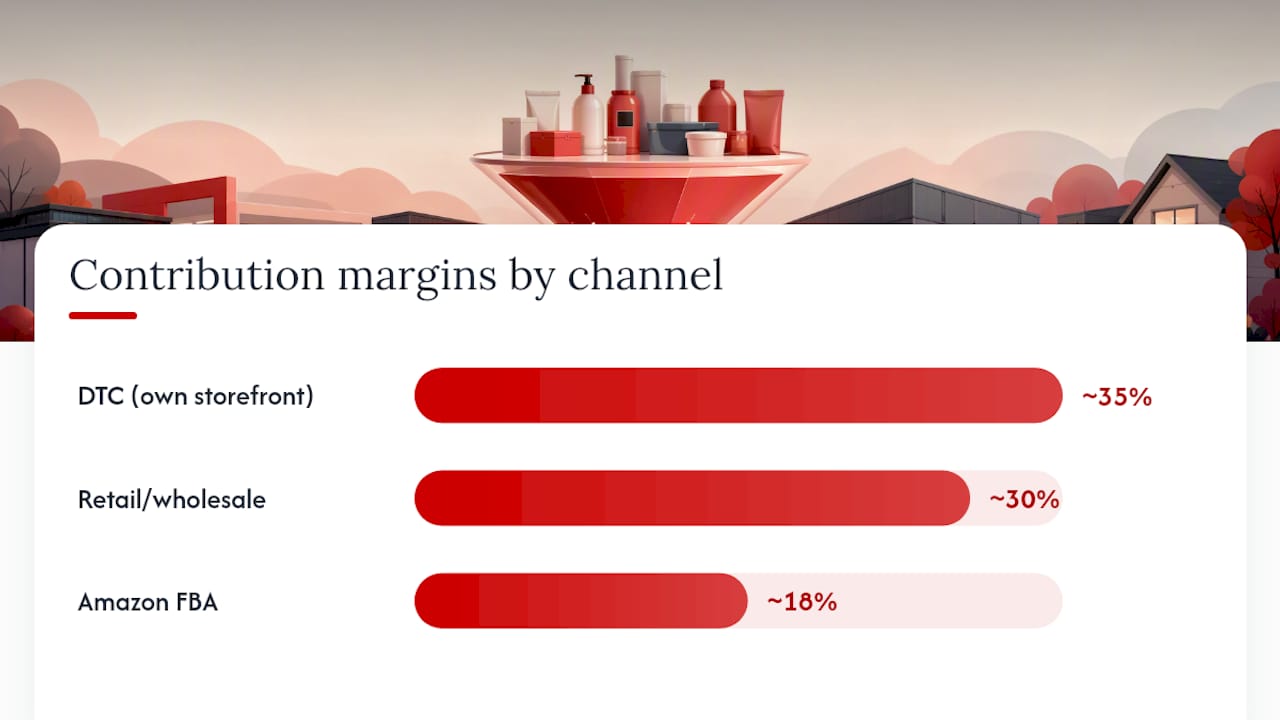
Model these three first. They represent the widest margin spread and the most common sequencing decisions for brands in the $500K–$20M range. Before adding any channel, stress-test CAC on DTC, trade spend on retail, and the full Amazon fee stack.
The channel that generates the most revenue is rarely the one that generates the most contribution dollars. Model per-SKU, per-channel, and per-scenario before committing to any new distribution path.
| Point | Details |
|---|---|
| DTC margin leads, but CAC is the risk | At ~35% contribution midpoint, DTC wins on margin only when blended CAC stays below 20%–25% of revenue. |
| Retail trade spend is a direct revenue cut | Trade spend of 15%–25% of gross wholesale revenue must be modeled before signing any retail agreement. |
| Amazon FBA margin is structurally lower | The full fee stack pushes all-in channel cost to 30%–45% before ads, leaving mid-teens contribution in many categories. |
| Sequence channels by contribution dollars | Use the four-column P&L model to confirm total contribution dollars rise before launching any new channel. |
| Reddog models channel economics per SKU | Reddog’s contribution-margin-first framework helps brands in the $500K–$20M range identify margin leaks and prioritize channels by real profitability. |
Every channel has a structural cost architecture that determines how much of your shelf price you actually keep. Eightx’s CPG channel-margin analysis shows that on a representative SKU with 32% COGS, midpoint contribution margins land near 35% DTC, 30% retail, and 18% Amazon once channel-specific costs are removed.
DTC (Shopify/own storefront). You keep the full shelf price, but you pay for every customer. Blended marketing for mature DTC brands often runs between one-fifth and one-third of revenue, with fully loaded Meta CAC often around two hundred dollars per customer. Contribution margin is highest here, but only if CAC is controlled. Customer ownership and repeat-rate data are yours entirely, which makes DTC the best channel for CLTV modeling. Explore digital sales funnel examples that support DTC acquisition before scaling spend.
Wholesale to retailers (big-box/regional chains). Retailers typically take 25%–30% of shelf price, and trade spend commonly consumes 15%–25% of gross wholesale revenue, leaving a much smaller net for the brand. Payment terms run Net 30–60. Inventory velocity is slower; you ship to a DC and wait for sell-through before replenishment orders arrive.

Distributor terms are often Net 45–60, and deductions arrive weeks after shipment.
Mid- to low-teens contribution margins are common in many categories. Cash timing is Net 14, which is a genuine working-capital advantage. Velocity is high if your listing converts. See marketplace strategies for Amazon growth for channel ramp planning.
Amazon Seller-Fulfilled. Removes FBA storage fees and gives you more control over packaging, but shifts fulfillment cost and complexity to your 3PL. Contribution margin improves modestly if your per-unit fulfillment cost beats FBA rates.
WFS fulfillment rates are competitive, but the customer base skews value-oriented, which creates pricing pressure. Margin compression is real if you match Amazon pricing and absorb WFS fees.
Club stores (Costco/Sam’s). Require large pack formats, low per-unit cost, and often a slotting or promotional commitment. Contribution margin can be attractive on volume, but inventory risk is high: a single failed sell-through leaves you with a large unsaleable pack configuration.
Grocery/foodservice. Slotting fees, promotional calendars, and mandatory resets make this the highest-friction channel to enter. Velocity depends entirely on placement and velocity data from the retailer’s POS system.
Subscription/replenishment. Repeat rate and CLTV are the defining metrics. CAC is front-loaded, but contribution margin on repeat orders is the highest of any channel because you pay acquisition cost once. Model the payback period carefully.
Other marketplaces (Instacart, Target+, specialty). Fees and margin structures vary widely. Instacart’s CPG ad model layers media cost on top of retailer margin. Target+ is invite-only with strict compliance requirements. Treat these as supplemental until core channels are profitable.
Pro Tip: Pack-size optimization is the most underused margin lever across channels. Running that same pack through Amazon FBA can materially improve contribution margin if the listing converts at volume.
The formula is straightforward. Work from consumer price down:
Phoenix Strategy Group recommends treating trade spend, chargebacks, returns, and allowances as direct reductions to revenue rather than burying them in SG&A. That single discipline prevents the most common margin-modeling mistake in CPG.
The revenue looks similar across channels. The contribution dollars are not.
Profasee’s four-column P&L model adds an important discipline: build pre-expansion baseline, post-expansion baseline, new channel, and total columns. Accept a new channel only if total contribution dollars rise meaningfully within a six-month projection, not just if the new channel looks profitable in isolation.
Sensitivity checklist. Stress-test these variables before committing:
CFO Pro Analytics finds that SKU-level profitability frequently varies 20%–30% across a brand’s portfolio once channel mix and promotional intensity are included. Build your model per-SKU and per-channel, not at the brand level.
The sequencing logic is straightforward for most growth-stage brands:
Threshold gates before launching a channel:
Those two numbers confirm that demand is real and that customers return without heavy re-acquisition spend.*
Operational gaps cost more than slow sales. Before committing to a channel, confirm:
Typical launch timelines:
| Channel | Vendor onboarding | First order to shelf | First replenishment |
|---|---|---|---|
| Amazon FBA | 1–2 weeks | 2–4 weeks | 2–4 weeks |
| Walmart WFS | 2–4 weeks | 4–6 weeks | 4–6 weeks |
| Regional retail | 4–8 weeks | 8 weeks | 12–20 weeks |
| National distributor | 8 weeks | 16 weeks | 20 weeks |
Payment terms create a working-capital gap that catches many founders off guard. A Net 60 retailer on a $50,000 first order means you fund COGS, freight, and trade spend for two months before a dollar arrives. Model that gap explicitly before signing a purchase order.
Packaging is the fastest margin-recovery lever most brands ignore. A simple case-pack reconfiguration that reduces dimensional weight by one tier can recover $0.30–$0.50 per unit in FBA fees and outbound freight simultaneously, with no change to the product itself.
| KPI | Channel | Benchmark range | Cadence |
|---|---|---|---|
| Contribution margin % | All | 20%–35% | Monthly |
| Gross margin % | All | 45%–60% | Monthly |
| Inventory turns | All | 4–8x annually | Monthly |
| Days of inventory | All | 45–60 days | Weekly |
| DSO / payables lag | Retail/distributor | 30–60 days | Monthly |
| TACoS | Amazon/Walmart | 8%–15% | Weekly |
| ACoS | Amazon/Walmart | 15%–30% | Weekly |
| Blended CAC | DTC | Category-specific | Weekly |
| Repeat rate | DTC/subscription | 25%–30% | Monthly |
| On-shelf rate | Retail/grocery | 90% | Monthly |
Monitor sell-through velocity daily during promotional periods. TACoS and ACoS need weekly attention because ad spend compounds quickly. Contribution margin by channel is a monthly discipline: pull it, compare it to the prior period, and identify which channel moved and why.
At Reddog, every channel model starts with the same input set:
We treat trade spend, chargebacks, and allowances as revenue reductions, not SG&A, following the Phoenix Strategy Group framework. When a client’s actual inputs differ from our priors, the model updates immediately. The priors exist to give founders a starting point, not a final answer.
Changing CAC by 5 percentage points on a DTC channel typically moves contribution margin by 4–5 points. Changing trade spend by 5 points on a retail channel moves it by a similar amount. Those two variables are the ones to stress-test first in any scenario plan.
Most CPG founders chase revenue. The brands that build durable businesses chase contribution dollars per channel. Revenue is easy to grow by adding channels. Contribution dollars are harder, because every new channel brings a new cost structure, a new cash-timing gap, and a new operational burden.
At Reddog, we see the same pattern repeatedly: a brand adds retail because a buyer called, absorbs the trade spend and slotting cost, and then discovers six months later that total contribution dollars are lower than they were before the expansion. The channel was not wrong. The sequencing and the economics were not modeled before the commitment was made.
Judge every channel on what it adds to total contribution dollars, not what it adds to the top line.
Reddog works with CPG brands in the $500K–$20M range that need a clear picture of what each channel actually contributes to profit. If you are evaluating a new channel, trying to understand where margin is leaking, or building a growth plan that holds up under real retail economics, a focused 30-minute review is a practical starting point.
Book a free 30-minute strategy review with the Reddog team. Come with one SKU’s P&L or a single-channel model, and we will work through the contribution-margin math together. No pitch, no obligation. Just a clear-eyed look at your channel economics.
Leave a comment: