Published: March 2020 | Last Updated:June 2026
© Copyright 2026, Reddog Consulting Group.

TL;DR:
- Marketplace data helps brands make proactive pricing, inventory, and fulfillment decisions to protect margins and improve growth. Operating intelligence combines demand and supply signals to identify early marketplace issues before revenue declines. Effective data governance and disciplined workflows enable brands to turn insights into actionable strategies for continued success.
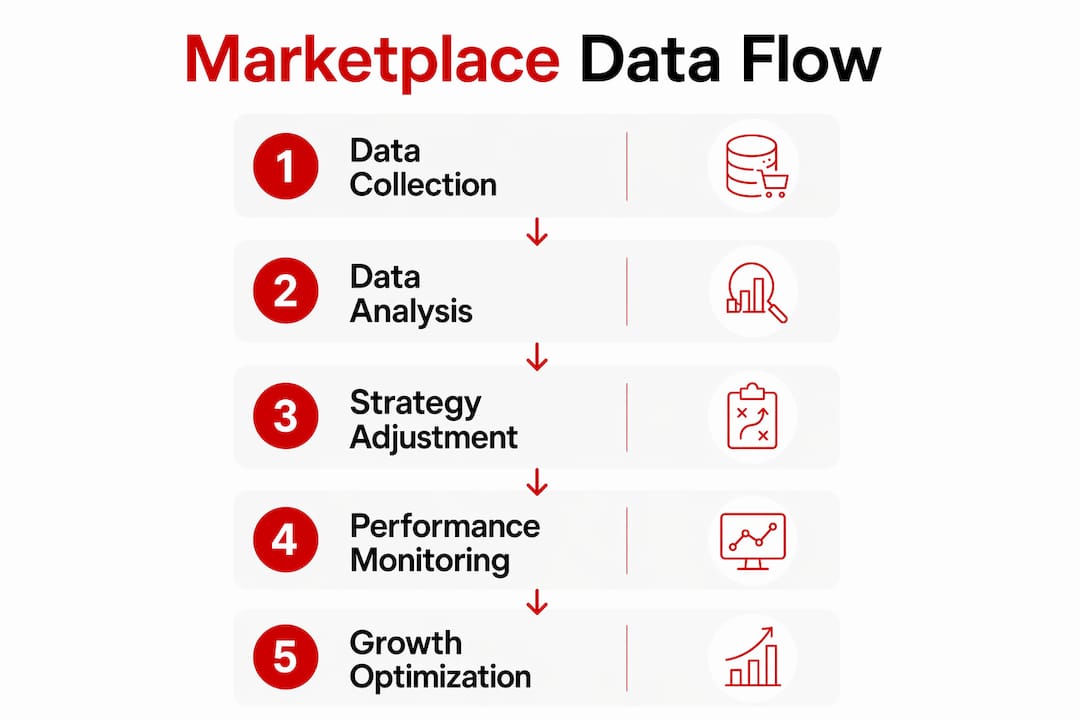
Marketplace data is the aggregated stream of transactional, pricing, inventory, and customer feedback information generated across eCommerce platforms like Amazon, Walmart, and eBay. The role of marketplace data goes far beyond reporting what already happened. It tells you what to charge, when to restock, where your margin is leaking, and which competitors are eating your share. Tools like Jungle Scout, Helium 10, and third-party analytics providers like WebDataInsights have made this data accessible to brands of every size. The brands that treat this data as a core business input, not a reporting afterthought, are the ones that grow profitably.
Pricing on Amazon or Walmart is not a set-it-and-forget-it decision. Competitor prices shift daily, sometimes hourly, and brands that rely on weekly manual checks are always reacting too late. Retailers using live data infrastructure can respond to market shifts within hours instead of weeks, preventing margin erosion that compounds quietly over time.
The difference between reactive and proactive pricing is significant. Reactive pricing means you drop your price after a competitor already captured the Buy Box. Proactive pricing means you monitor supply and demand signals continuously and move first. That shift requires real-time data feeds, not monthly reports.
Third-party analytics access matters here more than most brands realize. Platforms that restrict data access see worse seller pricing decisions and lower commission revenue overall. Open data access creates a feedback loop where sellers price more accurately, which improves platform health, which attracts more buyers.
Margin optimization goes beyond demand signals alone. Supply-side data, including commodity price indexes and supplier lead times, belongs in your pricing model too. Monitoring supplier lead times and tariff changes alongside demand signals lets you time procurement to protect margins before cost increases hit your P&L.
Key inputs for a proactive pricing model include:
Pro Tip: Use Keepa to track Amazon price history and spot pricing patterns by ASIN before you set or adjust your own price. Historical price curves reveal seasonal floors and ceilings that no competitor dashboard shows you in real time.
Fulfillment performance is one of the most underused signals in marketplace data analysis. Most brands track sales volume and conversion rate. Far fewer track delivery performance by seller, by region, or by fulfillment method, and that gap costs them reviews and repeat purchases.

The numbers are stark. Late deliveries cause a 34% drop in customer satisfaction scores compared to on-time deliveries. In the Olist Brazilian e-commerce dataset, review scores fell from an average of 4.29 for on-time orders to 2.58 for late ones. A drop that severe does not just hurt your star rating. It suppresses your organic ranking, reduces your conversion rate, and signals to the marketplace algorithm that your listing is a worse bet than a competitor’s.
| Delivery outcome | Average review score | Impact on repeat purchase |
|---|---|---|
| On-time delivery | 4.29 | High |
| Late delivery | 2.58 | Low |
The operational implication is direct. Delivery data needs to be tracked separately from sales data. Blending them into a single dashboard hides the signal. A seller doing high volume with poor delivery performance looks fine in aggregate until the review score collapses and the algorithm deprioritizes the listing.
Fulfillment bottlenecks show up in the data before they show up in your reviews. Spikes in estimated delivery time, increases in carrier exception rates, and rising customer contact rates are all leading indicators. Brands using marketplace growth analytics to track these metrics separately from sales volume catch problems weeks earlier than brands that only check their star rating.
Pro Tip: Track delivery and fulfillment metrics separately per seller or per fulfillment method, whether Amazon FBA, Walmart WFS, or a third-party logistics provider. Scale and quality trade-offs are invisible when you blend all fulfillment data into one number.
Operating intelligence is the practice of integrating supply-side and demand-side marketplace data into a single system that surfaces early warnings, not just performance summaries. Most brand dashboards show completed transactions. Operating intelligence systems track what happens before the transaction, and that distinction changes what you can act on.
Capturing pre-transaction signals such as abandoned searches and failed matches provides early warning for marketplace liquidity issues months ahead of revenue drops. A standard dashboard showing declining sales tells you the problem has already arrived. A system tracking failed search matches tells you the problem is forming, while you still have time to respond.
Liquidity metrics matter more than most brands expect. Marketplace liquidity rate and time-to-match are leading indicators of marketplace health and future revenue changes. Rising time-to-match signals infrastructure or supply quality issues before they appear in your revenue line.
Supply-side health deserves its own tracking layer. High supplier churn predicts buyer loss even when buyer retention looks stable. Two-sided marketplaces need to monitor both sides independently. A brand that only watches its own sell-through rate misses the upstream signal that a key supplier is degrading, which will compress its assortment and hurt its listing quality within weeks.
The signals that belong in an operating intelligence system include:
Data governance is what separates a useful operating intelligence system from an expensive dashboard. Disconnected AI initiatives without data governance create complexity and lost monetization opportunity. Clean, governed data is the prerequisite for any dynamic pricing or AI-driven decision system to function reliably.
Marketplace data analysis produces value only when it connects to a decision. The brands that get the most from their data have clear workflows that move from signal to action without a week of internal debate.
A practical approach to building that workflow looks like this:
Data-enabled services reduce friction and create compound value by leveling the playing field for smaller sellers. Platforms like Faire have demonstrated that giving smaller brands access to the same data infrastructure as large sellers improves overall marketplace health, not just individual seller performance. That principle applies to how you build your own internal data stack. Better data access at the brand level produces better decisions across pricing, inventory, and promotions.
For brands that want a structured view of how data connects to channel economics, Reddog’s guide on marketplace management best practices covers the operational frameworks that make data workflows repeatable.
Marketplace data is most valuable when it connects directly to a pricing, fulfillment, or assortment decision, not when it sits in a report that no one acts on.
| Point | Details |
|---|---|
| Pricing requires live data | Real-time competitor signals prevent margin erosion that weekly manual checks always miss. |
| Delivery data predicts review scores | Late deliveries drop average review scores from 4.29 to 2.58, suppressing rank and conversion. |
| Pre-transaction signals matter | Abandoned searches and failed matches warn of liquidity problems months before revenue drops. |
| Governance enables action | Clean, governed data is the prerequisite for dynamic pricing and AI-driven decisions to work. |
| Supply-side tracking is non-negotiable | High supplier churn predicts buyer loss even when your own sell-through rate looks stable. |
Working with CPG brands across Amazon, Walmart, and wholesale channels, the pattern I see most often is not a lack of data. It is a lack of connection between the data brands already have and the decisions they need to make.
Most brands have access to Seller Central reports, third-party analytics from Jungle Scout or Helium 10, and some version of a fulfillment dashboard. What they are missing is a governing logic that ties those signals together into a weekly decision rhythm. The data sits in three tabs of a spreadsheet, and the pricing call gets made based on gut feel anyway.
The brands I see pulling ahead are not necessarily using more sophisticated tools. They are using the tools they already have with more discipline. They have a person who owns Buy Box win rate. They review fulfillment performance separately from sales performance. They track supplier lead times alongside demand signals before they set a promotional price.
Scale alone no longer drives marketplace growth. Effective data orchestration and governance are the actual differentiators now. The brands that treat data quality as a revenue strategy, not an IT task, are the ones that protect margin when the market shifts. That is the edge worth building in 2026.
— Reddog
Reddog works with CPG brands in the $500K to $20M revenue range that need more than a data export. We help you connect marketplace data insights to contribution margin, channel economics, and inventory decisions that actually move the needle.
If you are selling on Amazon or Walmart and your pricing, fulfillment, or assortment decisions are not grounded in live data, there is margin leaking somewhere. Reddog’s CPG retail growth consulting is built around finding it. Book a free 30-minute strategy call to review your channel economics, inventory velocity, or growth planning. No pitch. Just a focused look at where your data is and where it needs to be.
Marketplace data is the aggregated transactional, pricing, inventory, and customer feedback information generated across eCommerce platforms like Amazon, Walmart, and eBay. Brands use it to inform pricing, fulfillment, and assortment decisions.
Live marketplace data lets sellers monitor competitor prices and supply signals in real time, enabling proactive price adjustments that protect margin instead of reactive cuts that erode it.
Late deliveries drop average customer review scores from 4.29 to 2.58, a 34% decline that suppresses organic ranking and reduces conversion rate across the affected listings.
A dashboard reports completed transactions. Operating intelligence tracks pre-transaction signals like abandoned searches and failed matches, which surface marketplace health problems months before they appear in revenue data.
Jungle Scout and Helium 10 provide competitive intelligence on Amazon, including keyword rank, estimated sales volume, and competitor pricing. Keepa tracks historical Amazon price data by ASIN for pattern analysis.
Leave a comment: