
Published: March 2020 | Last Updated:July 2026
© Copyright 2026, Reddog Consulting Group.

TL;DR:
- Data transforms raw observations into evidence that guides better business decisions and boosts profitability.
- Organizational culture and clear KPIs are more critical than technology for creating a data-driven decision-making environment.
Data is the foundation of every sound business decision, converting raw observations into evidence that leaders can act on with confidence. The role of data in decision making is to replace guesswork with measurable insight, giving organizations a clear picture of what is working, what is not, and where opportunity exists. 85% of organizations report improved profitability within six months of adopting business analytics. That figure signals one thing clearly: data is not a support function. It is a growth driver. Reddog works with CPG brands every day that face this exact reality, where the difference between a profitable channel and a margin leak often comes down to whether the right data is being read at all.
Data analysis is the practice of examining raw information to find patterns, draw conclusions, and guide action. The standard industry term for applying this practice to business choices is evidence-based decision making, though most practitioners use the shorthand “data-driven decision making” interchangeably. Both terms describe the same shift: moving from decisions anchored in intuition to decisions anchored in verified evidence.

Three types of analysis drive this shift. Descriptive analytics tells you what happened, such as which SKUs sold out in Q3. Predictive analytics tells you what is likely to happen next, using historical patterns to forecast demand or flag churn risk. Prescriptive analytics goes further and recommends a specific action, such as adjusting reorder points before a stockout occurs. Each layer adds decision quality that gut instinct alone cannot match.
Advanced analytics adoption has risen to 57% across organizations, up from 40% just a few years ago. That growth reflects a market-wide recognition that speed and accuracy in decisions are competitive advantages, not operational luxuries.
Pro Tip: Before investing in predictive or prescriptive tools, make sure your descriptive data is clean and consistent. Forecasting on bad historical data produces confident wrong answers.
The transition from intuition to evidence does not happen overnight. Leaders who have spent years trusting their instincts often resist probabilistic outputs that feel uncertain. The practical fix is to start small: pick one decision type, apply data to it consistently for 90 days, and measure the outcome against the prior approach. The comparison does the convincing.
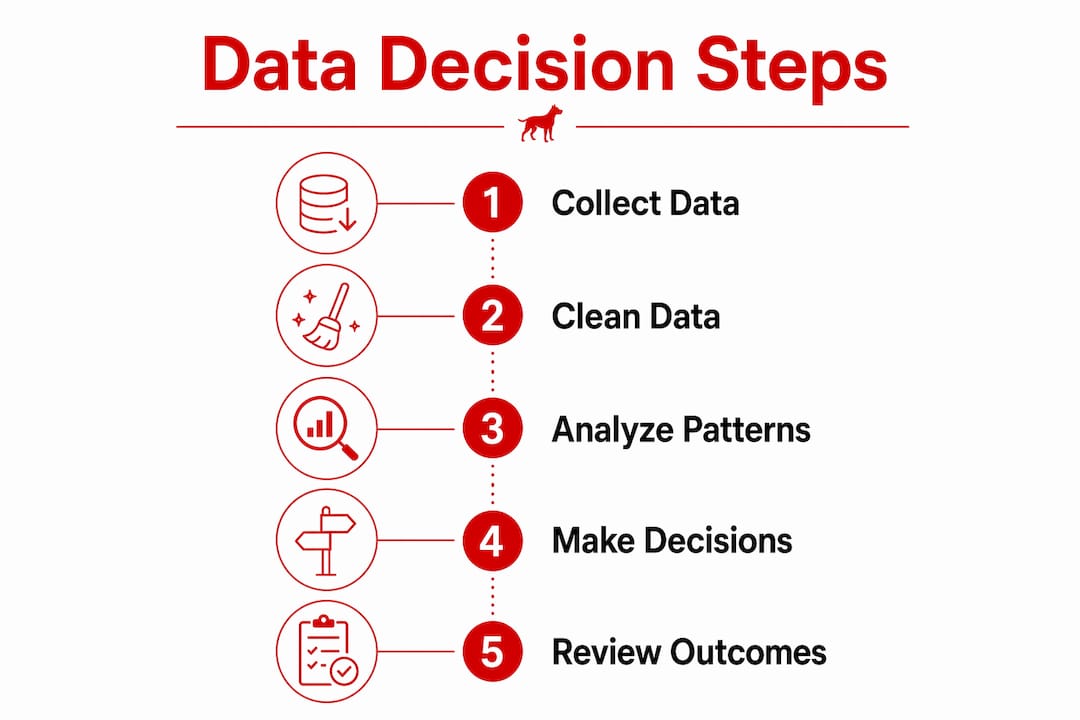
The biggest obstacle to data-driven decision making is not technology. Data culture and organizational behavior are the biggest barriers to data maturity, outranking tool limitations and budget constraints. Culture shapes whether people trust data, share it, and act on it consistently.
70–74% of organizations still face data silos that block progress. A data silo occurs when one team holds information that another team needs but cannot access. In a CPG brand, this looks like the sales team tracking retail velocity in one spreadsheet while the ops team manages inventory in a separate system, and neither talks to the other until a stockout happens. 73% of organizations report significant skills gaps that prevent them from extracting value from the data they already own. Owning data and knowing how to use it are two very different capabilities.
Common barriers leaders encounter include:
Misaligned incentives undermine data-driven progress more than any technical barrier. When employees are not rewarded for using data and are not held accountable when they ignore it, the culture defaults to instinct. Fixing this requires leadership to explicitly reward data-supported decisions and treat operational errors flagged by data as genuine failures worth addressing.
Pro Tip: Run a data-driven marketing audit across your channels before launching any new analytics program. Knowing where your current data is broken saves months of chasing false signals.
Data efforts that are not tied to specific business outcomes produce dashboards that nobody reads. The fix is to define your key performance indicators before you build any reporting infrastructure. Measurement frameworks aligned with KPIs help justify ongoing data investment and demonstrate business impact. Without that alignment, analytics teams spend their time answering questions nobody asked.
Tools alone do not create data-driven cultures. Decision frameworks must come before technology adoption. That means defining what a good decision looks like, what data is required to make it, and who is accountable for the outcome, before selecting a platform or building a report. Without those definitions, analytics merely visualize noise.
The table below shows how alignment changes the outcome of a data initiative:
| Scenario | Data approach | Business outcome |
|---|---|---|
| No defined KPIs | Broad data collection with no filter | Dashboards built, decisions unchanged |
| KPIs defined, no governance | Metrics tracked inconsistently | Partial insight, low trust in outputs |
| KPIs defined, governance in place | Focused data collection tied to outcomes | Decisions improve, ROI measurable |
| KPIs, governance, and leadership buy-in | Data embedded in planning cycles | Culture shifts, sustained growth |
Leadership buy-in is the variable that separates the third row from the fourth. When executives reference data in meetings, ask for evidence before approving spend, and hold teams accountable to metrics, the rest of the organization follows. Connecting analytics to strategic KPIs is the structural work that makes that accountability possible.
Self-service analytics reduces the bottleneck that forms when business teams depend on centralized data teams for every report. When a brand manager can pull their own channel performance data without filing a request, decisions happen faster and more frequently. That speed compounds over time into a genuine organizational advantage.
Data-driven decisions enable businesses to move from reactive crisis handling to proactive growth strategies. The shift shows up differently by industry, but the underlying mechanism is the same: data surfaces a signal before the problem becomes expensive.
Real-world applications where data changes outcomes:
Predictive insights help spot churn, anticipate volatility, and convert customers into long-term advocates. The brands that act on those signals early consistently outperform those that wait for the problem to show up in their P&L. Using data for growth insights requires building the habit of checking signals before making channel or pricing decisions, not after.
The role of analytics in business growth extends beyond cost reduction. Analytics drives business growth by identifying which channels, customers, and products generate the most profit per dollar invested, then directing resources accordingly.
Data-driven decision making produces measurable business results only when analytics are tied to specific KPIs, supported by leadership, and embedded in a culture that rewards evidence over instinct.
| Point | Details |
|---|---|
| Data replaces guesswork | Evidence-based decisions consistently outperform intuition-based ones across profitability metrics. |
| Culture beats technology | Organizational behavior and incentive alignment matter more than the tools your team uses. |
| Align data to KPIs first | Define what success looks like before building any dashboard or analytics program. |
| Self-service speeds decisions | Business units that access their own data make faster, more frequent evidence-based choices. |
| Proactive beats reactive | Predictive analytics lets you act on signals before problems show up in your financials. |
The brands I see struggle most with data are not the ones with bad tools. They are the ones that bought good tools and then handed them to an analyst team while the rest of the organization kept making decisions the old way. Technology does not change behavior. Accountability does.
The pattern repeats constantly: a leadership team invests in a business intelligence platform, the data team builds beautiful dashboards, and six months later the dashboards are ignored because nobody defined what decision each report was supposed to improve. Without metrics linked to outcomes, analytics visualize noise. The fix is not a better tool. It is a clearer question.
The other mistake I see is treating data errors as embarrassments rather than signals. When your data flags an operational problem, that is the system working. Organizations that punish the messenger, or quietly ignore the flag, destroy the trust that makes data culture function. Treat every flagged error as a process improvement opportunity, and your team will start trusting the data instead of working around it.
The brands that get this right share one trait: their leaders ask for data before approving decisions, not after. That single behavior, practiced consistently at the top, filters down faster than any training program.
— Reddog
Reddog works with CPG brands in the $500K–$20M revenue range that need more than a dashboard. They need to know which channels are actually contributing to profit, where margin is leaking, and what the data says about their next move.
A free 30-minute strategy call with Reddog covers the metrics that matter most to your business: contribution margin by channel, inventory velocity, Amazon FBA or Walmart WFS cost structures, and where your current data is leaving money on the table. The session is practical, not a pitch. You leave with a clearer picture of where your numbers stand and what to do next. Book your free strategy call and bring your current channel data. The conversation starts there.
Data provides the evidence that replaces assumption in business decisions. It surfaces patterns, measures outcomes, and reduces the uncertainty that leads to costly mistakes.
Descriptive, predictive, and prescriptive analytics each add a layer of insight that improves decision accuracy. Organizations using advanced analytics report measurable gains in profitability within months of adoption.
Cultural resistance, data silos, and skills gaps are the top barriers. Between 70–74% of organizations report data silos as a significant obstacle, and 73% cite skills shortages as a limiting factor.
Define your KPIs before building any reporting infrastructure. Measurement frameworks that connect analytics outputs to specific business outcomes are what separate useful data programs from expensive dashboards.
Tools without decision frameworks produce reports that nobody uses. Data initiatives fail when organizations adopt technology before defining what decisions the data is supposed to improve and who is accountable for acting on it.
Leave a comment: