Published: March 2020 | Last Updated:May 2026
© Copyright 2026, Reddog Consulting Group.

TL;DR:
- Poor retail operations cause significant revenue losses for CPG brands, especially due to out-of-stocks.
- Focusing on simple, measurable KPIs and adopting proven frameworks like ABC analysis and Kanban improves inventory management.
- Consistent execution and team accountability are crucial for sustained operational success and profitability.
Poor retail operations are quietly bleeding CPG brands dry. Out-of-stocks cost the industry roughly $130 billion every year, and every 1% increase in out-of-stock rates cuts annual revenue by 3 to 6%. For a brand doing $5 million in sales, that math gets painful fast. The good news is that most operational losses are fixable with the right diagnosis, the right tools, and a structured approach to execution. This guide walks you through exactly that: a practical roadmap for identifying where you’re leaking margin, which frameworks actually work for CPG brands at your scale, and how to implement changes that stick.
| Point | Details |
|---|---|
| Out-of-stocks are costly | Each percentage point of out-of-stock hurts revenue and should be tracked closely. |
| Choose the right tools | Starting with proven frameworks like Lean Six Sigma enables practical, measurable improvement. |
| Implementation drives ROI | Success comes from disciplined execution and ongoing measurement of improvements. |
| Simplicity beats complexity | Focus improvement on a few core habits and metrics for lasting impact. |
Once you recognize how much bad operations cost, the next step is to get a clear view of where you stand today. Most CPG founders in the $500K to $20M range are running hard and rarely stop to audit what’s actually working. That’s where the damage hides.
The four most common operational leaks are out-of-stocks, overstocking, poor inventory accuracy, and process bottlenecks. Out-of-stocks are the most immediately visible because they show up as missed sales. Overstocking is sneakier. It ties up cash, inflates 3PL storage costs, and often leads to markdowns that destroy margin. Poor inventory accuracy compounds both problems, because if your system says you have 500 units and you actually have 300, your reorder triggers are wrong before you even start. Process bottlenecks, whether in receiving, labeling, or order fulfillment, slow velocity and create cascading delays across channels.
“Every 1% increase in out-of-stock rates reduces annual revenue by 3 to 6%. For CPG brands operating at scale, this is not a rounding error. It’s a structural profit problem.”
To get a fast baseline, pull these key performance indicators and measure them honestly:
| KPI | What it reveals | Red flag threshold |
|---|---|---|
| Out-of-stock rate | Lost sales and shelf gaps | Above 5% |
| Inventory accuracy | System vs. physical count alignment | Below 95% |
| Stock turn rate | How fast inventory converts to revenue | Below category benchmark |
| Fill rate | Orders fulfilled on time and in full | Below 95% |
| Days of inventory on hand | Cash tied up in unsold product | Above 60 days for most CPG |
| Shrinkage rate | Loss from damage, theft, or expiry | Above 1% |
Start with your worst two metrics. Don’t try to fix everything at once. Brands that spread attention across six KPIs simultaneously usually improve none of them. Focus matters.
Top 4 red-flag signs of process breakdown:
Work through your data with a simple spreadsheet before buying any new software. Good inventory turnover improvement starts with honest numbers, not dashboards that make bad data look polished. If you’re seeing recurring stockouts on specific SKUs, the root issue is almost always upstream: inaccurate forecasting, supplier lead time variability, or a reorder point that was never calibrated correctly. Strong inventory management solutions exist to solve exactly these problems, but they only work if you feed them accurate inputs.
Focusing on preventing stockouts is not just about customer satisfaction. It directly protects your retail relationships. Buyers at regional grocery chains and national distributors track fill rates, and consistent misses put your shelf placement at risk.
With issues identified, it’s time to pick the right improvement approach with proven tools tailored for CPG operations. The mistake most founders make here is jumping to the most complex framework they’ve heard of, usually because a consultant or podcast pitched it hard. Complexity is the enemy of execution for brands under $20M.
Lean Six Sigma tools like ABC analysis, Kanban, 5S, and DMAIC are well validated for retail and inventory environments, but each serves a different purpose. Here’s how to think about them:
| Framework | Core purpose | Best for |
|---|---|---|
| ABC analysis | Categorize SKUs by revenue contribution | Prioritizing reorder focus |
| Kanban | Visual inventory replenishment signals | Warehouse flow and reorder triggers |
| 5S | Workplace organization (Sort, Set, Shine, Standardize, Sustain) | Receiving and fulfillment efficiency |
| DMAIC | Structured problem-solving cycle | Complex, recurring process failures |
ABC analysis is where most CPG brands should start. It’s fast, it uses data you already have, and the insights are immediately actionable. Categorize your SKUs into A (top 80% of revenue), B (next 15%), and C (bottom 5%). You’ll almost certainly find that you’re spending disproportionate time and storage space on C-class products that barely move. That realization alone can free up significant cash and operational bandwidth.
Kanban is the natural next step after ABC. Once you know which SKUs matter most, set visual reorder triggers for your A items so replenishment happens automatically before you hit a stockout. This is especially powerful for multi-channel brands managing stock across Amazon FBA, Walmart WFS, and wholesale simultaneously.
Three questions to ask before adopting any new framework:
Pro Tip: Start with ABC analysis before anything else. It takes less than a day to run with existing sales data, and it immediately tells you where to focus. Most CPG brands have at least 20 to 30% of their SKU catalog generating under 2% of revenue. That discovery alone changes how you allocate inventory investment.
Your operational excellence strategies should match your current stage. A $1M brand does not need a full DMAIC project team. It needs clean ABC segmentation and a functioning Kanban trigger on its top 10 SKUs. Pair that with a solid inventory forecasting guide and you’ll have the foundation for predictable fulfillment. From there, building stronger customer engagement becomes possible because you’re no longer fighting fires on availability.
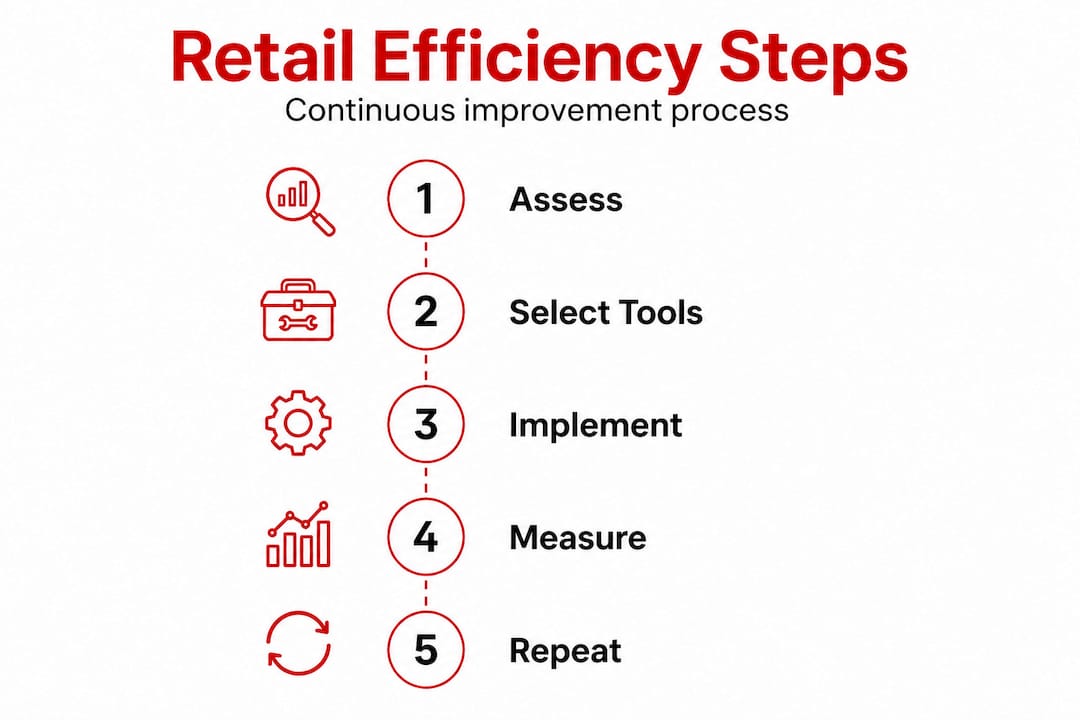
Choosing tools is only half the battle. You’ll gain the most by applying them with proven, achievable steps that account for the real constraints your team is operating under.
The DMAIC model, which stands for Define, Measure, Analyze, Improve, and Control, gives you a structured execution sequence that prevents the most common failure mode: jumping straight to solutions before understanding the actual problem.
Define the specific operational problem you’re solving. Be narrow. “Improve operations” is not a definition. “Reduce out-of-stock frequency on our top 5 SKUs from 12% to below 5% in 60 days” is a definition. Specific targets create accountability and make progress visible.
Measure your current state with real data. Pull 90 days of inventory records, sales velocity by SKU, fill rate reports from your 3PL or warehouse, and any retailer compliance scorecards you have access to. Don’t skip this step. Gut instinct is not a baseline.
Analyze the data to find root causes, not symptoms. If you’re seeing stockouts on a specific SKU, trace backward. Is the lead time from your supplier inconsistent? Is your reorder point based on outdated velocity data? Is Amazon FBA receiving lag eating into your available inventory window?
Improve by implementing the targeted fix. This might mean adjusting reorder points, renegotiating supplier lead times, creating a buffer stock policy for A-class SKUs, or reorganizing warehouse receiving workflows using 5S principles. For multi-channel inventory management, this often means creating channel-specific allocation rules so one channel doesn’t cannibalize another during high-demand periods.
Control the improvement by building systems that sustain it. Set up recurring KPI reviews. Assign ownership for each metric. Create written standard operating procedures so the fix doesn’t disappear when a team member changes.
For brands managing Amazon FBA alongside wholesale and DTC, supply chain optimization at the implementation stage means accounting for the lead time differences across each channel. Amazon FBA check-in times can run 7 to 14 days. Wholesale purchase orders often have 30 to 60-day lead requirements. Your inventory planning has to account for all of these windows simultaneously, not channel by channel in isolation.

Pro Tip: Phase your rollout by channel impact. Start with the channel generating your highest margin contribution, not your highest revenue. Fixing a margin-negative Amazon channel first is less valuable than locking in a healthy wholesale account that actually builds the business. Use retail strategy best practices to sequence your improvements by return on effort.
The Lean Six Sigma framework is not a one-time project. It’s a cycle. After your first DMAIC pass, you’ll identify new improvement opportunities. The goal is to build the habit of structured problem-solving into your operational rhythm. Even running customer engagement without a big budget becomes easier when your operations are predictable, because your team has capacity to think beyond firefighting.
Ongoing measurement and adjustment ensure gains stick and help you spot new opportunities or problems before they grow into expensive failures.
Four metrics should sit at the center of your ongoing review: inventory accuracy, fill rate, stock turn, and out-of-stock frequency. These four tell you whether your operations are actually improving or just temporarily better after a burst of attention.
How to run effective post-implementation reviews:
The two most common mistakes CPG operators make after implementing improvements are tracking the wrong KPIs and taking no action after audits. Tracking revenue alone tells you almost nothing about operational health. A brand can grow revenue while its operational metrics deteriorate, which sets up a painful correction when the wheels come off. And audits that sit in a spreadsheet without triggering action are expensive theater.
“Every 1% increase in out-of-stocks reduces revenue by 3 to 6%. Brands that improve operations but fail to sustain the discipline are not solving the problem. They’re delaying it.”
Your operational excellence approaches need to be embedded into weekly team rhythms, not treated as quarterly projects. Set a standing 30-minute weekly review of your top operational KPIs. That one habit, consistently applied, does more for sustained improvement than any software platform or framework rollout. Strong customer retention in retail is downstream of operational reliability. When you’re in stock, shipping on time, and filling orders completely, customer loyalty follows naturally.
Most retail operations guides focus on tools. This one does too, because tools matter. But here’s what experienced operators learn the hard way: the tool is rarely the problem. Execution discipline and team buy-in are the problem.
We’ve worked with CPG founders who could explain DMAIC in detail and had invested in sophisticated inventory software, but still had persistent stockout problems. The reason was almost always the same. The process was designed well but owned by no one. Nobody was accountable for the weekly inventory review. The reorder triggers existed but weren’t being checked. The tool was fine. The habit was absent.
The most operationally strong CPG brands we’ve encountered, at every revenue level, share one trait: they are relentlessly simple. They run tight SKU catalogs. They have clear ownership for every critical metric. They follow through on audits. They don’t chase the next framework until the current one is actually embedded. That’s it.
Most ambitious brands fail at operations not because they’re lazy or unaware, but because they over-engineer. They implement five frameworks simultaneously, create complex dashboards, hire for process before fixing the root cause, and lose momentum inside three months. Complexity feels like progress. It rarely is.
The challenge we’d give you is this: pick one core operational discipline, specifically out-of-stock rate, fill rate, or inventory accuracy, and focus on it exclusively for 90 days. Measure it weekly. Own it personally. Improve it by 30% before adding another initiative. That single focus, applied consistently, will outperform any multi-framework rollout that lacks commitment. Following proven retail best practices doesn’t require complexity. It requires consistency.
If you’ve read this guide and recognize your brand in more than a few of these patterns, you’re not alone. Most CPG brands in the $500K to $20M range are dealing with the same operational gaps, and the cost of fixing them with trial and error is high.
At RedDog Group, we work directly with CPG founders and operators to identify margin leaks, build structured operational improvement plans, and execute against them across Amazon, Walmart, wholesale, and DTC. We don’t sell generic frameworks. We analyze your actual data, your channel economics, and your team’s capacity, then build a plan that matches your stage and goals. If you’re ready to move from reactive firefighting to margin-first operational discipline, our retail growth experts are ready to help you build the path forward.
Focus on out-of-stock rates, inventory accuracy, stock turn, and fill rates. Every 1% increase in OOS reduces annual revenue by 3 to 6%, making availability your highest-leverage metric.
ABC analysis, Kanban, and DMAIC are the most immediately useful for CPG inventory and process improvement, as supported by Lean Six Sigma retail research. Start with ABC analysis because it requires only data you already have.
Every 1% increase in out-of-stocks drives a 3 to 6% annual revenue loss, and the industry collectively loses $130 billion per year to this single problem.
Review operational KPIs at least quarterly across all channels, and move to monthly reviews for fast-moving SKUs or high-velocity channels where conditions shift quickly and gaps compound fast.
Leave a comment: