Published: March 2020 | Last Updated:May 2026
© Copyright 2026, Reddog Consulting Group.

TL;DR:
- Your product detail page is a critical revenue architecture, not just a brochure, influencing conversion and trust.
- Effective optimization requires structured, data-driven content improvements, parity across channels, and operational discipline to sustain growth.
Your product detail page (PDP) is not a brochure. Most CPG (consumer packaged goods) founders treat it like one, spending thousands on ads to drive traffic to pages that quietly bleed conversion. The stakes are real: 67% of sites lacked buyer-generated visuals, directly undermining purchase confidence at the moment that matters most. This guide cuts through the surface-level advice and gives you a structured, numbers-driven approach to PDP optimization that drives profitable multichannel growth across Amazon, Walmart, your DTC site, and beyond.
| Point | Details |
|---|---|
| PDPs drive profit growth | Optimized product detail pages are crucial for converting multichannel shoppers and building trust, not just for D2C but across all retail platforms. |
| Go beyond design tweaks | True optimization requires structured information, attribute completeness, and channel data parity, not just better page visuals. |
| Metrics link to revenue | Track conversion, add-to-cart, return reasons, and feed accuracy to connect PDP work to real-world business outcomes. |
| Experiment and iterate | Prioritize frequent audits, measure, and run A/B tests to validate ongoing changes—especially around recommendations and new PDP features. |
| Avoid attribution traps | Distinguish between PDP impact and other variables like ad spend or feed issues so you act on the right levers for growth. |
Most brands think about conversion rate optimization (CRO) in terms of landing pages or ad creative. But for CPG brands selling across multiple channels, the PDP is where purchase decisions actually get made or abandoned. It is the last mile before money changes hands.
“The PDP is a primary conversion checkpoint and trust/decision surface for shoppers across D2C and marketplaces.” This is not a UI preference. It is a revenue architecture decision.
When you invest in ways to increase ecommerce sales across your channels, PDP quality is the multiplier on every dollar you spend driving traffic. A weak PDP creates a leaky bucket. You fill it with ad spend, it drains through poor conversion, and your contribution margin suffers.
Here is what a well-optimized PDP actually influences:
For CPG operators, the PDP also has a trust dimension that shelf products don’t always demand. Shoppers can’t touch, smell, or taste your product online. Every content element, from ingredient callouts to size comparisons to lifestyle imagery, does the sensory work that a physical shelf does in a store. Multichannel listing optimization that treats each channel’s PDP as a trust-building surface consistently outperforms brands that simply repurpose a single set of assets everywhere.
When most people hear “PDP optimization,” they picture swapping out a hero image or testing button colors. That mindset is expensive. Real optimization is a content, data, and logic exercise first. Design is the last mile of that process.
Structuring information and surfacing decision fields above the fold is critical for both shoppers and ranking algorithms. This means every PDP should have, at minimum, these elements immediately visible without scrolling: a clear product name with variant identification, price including any volume discount logic, inventory status and shipping promise, a review score and count, and a primary trust visual showing the product clearly in context.
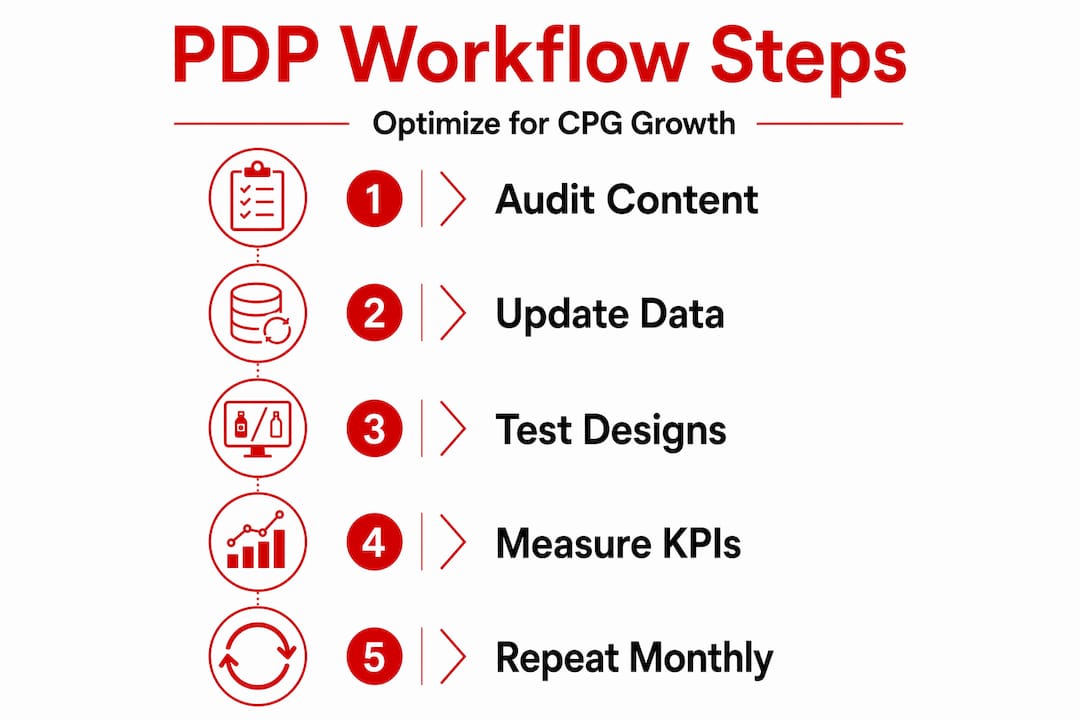
A practical workflow for PDP optimization moves through four stages: audit, prioritize, iterate, and measure. Here is what that looks like operationally for a CPG brand:
| PDP element | Priority for CPG | Common failure mode |
|---|---|---|
| Hero image | Critical | Low resolution, no context |
| Bullet points | Critical | Generic, no benefit language |
| Ingredient/nutrition facts | High | Outdated or incomplete |
| Mobile load speed | High | Oversized image files |
| Review count and rating | High | Too few reviews, no response |
| Variant selector logic | Medium | Confusing or broken |
| Enhanced/A-plus content | Medium | Generic brand template |
Mobile performance is not optional. The majority of CPG shopping discovery happens on mobile devices, and a PDP that takes more than three seconds to load on a phone is losing real buyers. Compress image files, minimize JavaScript dependencies on your DTC site, and regularly audit your pages using mobile-first testing tools.
Pro Tip: Use your return reason data as a diagnostic tool. If “doesn’t match description” or “not as pictured” shows up consistently in returns for a specific SKU, that is a direct signal that your PDP is creating false expectations. Fix the content, not the product.
Website optimization best practices for multichannel CPG brands always start with content accuracy before testing creative variations. Getting the basics right compounds faster than any clever CRO tactic. Pair that with disciplined ecommerce site optimization practices and you have a foundation that supports everything else.
Here is where most growing CPG brands lose ground without realizing it. You have a great PDP on your DTC site. But your Amazon listing has a different product title, a missing size spec, and an image from two years ago. Your Walmart page is missing the allergen disclosure. This is data parity failure, and it silently costs you conversion, ranking, and sometimes retail compliance.
Product attribute and content parity across your storefront and marketplaces directly affects visibility and conversion. When your feed data and your live page disagree, ranking algorithms distrust your listing. Shoppers who see different information at different touchpoints lose confidence. And in some regulated categories, inconsistencies can trigger compliance reviews.
The solution is a source-of-truth system. For brands at the $1M-plus revenue level, a Product Information Management (PIM) tool creates a single database that pushes clean data to every channel. For earlier-stage brands, even a well-maintained master spreadsheet with a validation step before each feed upload is better than nothing.
Pro Tip: Build a “compliance threshold” rule for your team. If any critical field (price, weight, allergen, net content) mismatches between your master record and a live channel page, that SKU goes into an immediate review queue. Don’t wait for customer complaints.
Common data parity traps to avoid:
| Channel | Critical parity fields | Common gap |
|---|---|---|
| Amazon | Title, bullets, images, A-plus | Backend keywords, variation structure |
| Walmart | Item attributes, spec sheet, main image | Lifestyle images, taxonomy mapping |
| DTC (Shopify/WooCommerce) | Meta description, schema markup | Alt text, structured data |
| Instacart | Net weight, UPC, allergen flags | Updated pack size |
Knowing what to fix is one thing. Building a repeatable system to keep fixing it as you scale is another. For CPG operators running 20, 50, or 100-plus SKUs across three or more channels, PDP quality can erode fast if there is no operational rhythm behind it.

PDP optimization must be measured with a metrics stack that links page behavior to revenue and operational cost drivers. Vanity metrics like page views don’t tell you if the page is working. Here is a practical decision-to-metric map:
| PDP action | Primary KPI | Secondary KPI |
|---|---|---|
| Refresh hero image | Add-to-cart rate | Conversion rate |
| Rewrite bullet points | Conversion rate | Return rate |
| Add enhanced content | Time on page | Repeat purchase rate |
| Fix mobile speed | Bounce rate | Session duration |
| Correct data feed | Feed acceptance rate | Search ranking |
| Add size comparison | Return rate | Review sentiment |
PDP optimization and digital shelf performance tie together for true channel growth. A PDP that converts well lowers your effective cost per acquisition for paid retail media campaigns. Sponsored product ads on Amazon and Walmart rely on the landing PDP to close the deal. When you improve PDP quality, your ad dollars stretch further.
Here is the operational loop that works for growth-stage CPG teams:
For conversion rate optimization for CPG, segmenting by channel and device is where you find real leverage. A PDP that converts at 4% on desktop but 1.8% on mobile has a mobile-specific content or speed problem. Your CPG optimization checklist should include device-level reporting as a standard diagnostic.
Advanced PDP work introduces some non-obvious traps that can distort your results or misfire commercially.
The first is misattributing ad underperformance to the wrong layer. If your sponsored product campaigns on Amazon are generating clicks but low conversion, the instinct is to blame the PDP. Sometimes that is right. But before you tear apart a listing, verify that your ad targeting is reaching in-market shoppers, not broad audiences clicking out of curiosity. Poor ad-to-PDP alignment is as often an audience problem as a content problem.
The second trap involves recommendation modules requiring experiment validation to avoid basket cannibalization. A “similar products” recommendation widget on your DTC site sounds like a good idea for boosting average order value (AOV). But if it pulls shoppers away from adding the item they landed on, you’ve traded a sure conversion for a browse session that might not close. Test “similar” versus “complementary” logic separately, and monitor both AOV and overall conversion rate during the experiment.
The most dangerous CRO mistake is optimizing a component in isolation without watching what it does to the whole funnel. You can win the add-to-cart battle and lose the checkout war.
Google Performance Max needs sufficient conversion volume and data feed accuracy to produce valid optimization signals. If your DTC PDP feed has errors or you are running PMax on a SKU with fewer than 30 conversions per month, the algorithm has no reliable pattern to optimize against. Fix the feed and hit the volume threshold before scaling spend.
Watch for these diagnostic red flags:
Building an ecommerce tech stack that surfaces these signals in real time is what separates brands that catch these issues in days versus months.
Here is the uncomfortable truth we see repeatedly with growth-stage CPG brands: the conventional CRO playbook, urgency banners, color-tested buy buttons, countdown timers, addresses maybe 10% of the actual opportunity. The other 90% lives in product data completeness, content parity, and the organizational discipline to maintain both as you scale.
Some content providers underweight data and attribute parity, focusing overly on call-to-action and urgency tactics. That approach generates short-term conversion bumps that fade when novelty wears off. The brands we see building durable multichannel advantages are doing something different. They treat PDP quality as infrastructure, not a campaign. They have someone accountable for data integrity across every channel feed. They review parity monthly instead of annually.
The integration point that most founders miss is the connection between PDP quality and retail media efficiency. When your PDP converts well, your sponsored placement costs go down because your click-to-purchase rate improves your algorithmic standing. That’s a compounding flywheel. But it requires that your digital shelf, your content marketing workflow, and your PDP optimization efforts are all coordinated. Siloed execution kills the flywheel.
Treat PDP optimization as an organizational muscle. Build the workflows. Assign the metrics. Review them in leadership meetings alongside revenue and margin numbers, because that is exactly what they are: margin drivers.
PDP optimization done right is not a one-time project. It is a repeatable, measurable growth system that compounds over time across every channel where your products live.
If you are ready to move from reactive listing maintenance to a structured, margin-focused PDP strategy, RedDog Group can help. We work with CPG brands in the $500K to $20M range to audit, prioritize, and optimize product listings across Amazon, Walmart, DTC, and retail channels. Our approach is built on contribution-margin economics, not vanity metrics. Whether you need a full Amazon growth consulting engagement or end-to-end CPG retail growth support across all your channels, we offer clear-eyed strategy and hands-on execution built specifically for scaling CPG operators.
Tracking conversion rate, add-to-cart rate, and return reasons guides PDP iteration for CPG teams. Also watch feed rejection rates by category, which signal upstream data quality issues before they hurt live performance.
Review PDP completeness and parity monthly for top SKUs and immediately after any catalog change, reformulation, or major promotional event. Ongoing monitoring of PDP content and compliance across feeds and storefronts is required to maintain channel standing.
Gaps in product attribute and content parity reduce search rankings, hurt conversion rates, and can trigger compliance reviews or buy-box loss on major marketplaces.
Validate “similar” versus “complementary” cross-sell modules in controlled experiments that monitor both AOV and overall conversion rate together, not just one in isolation.
Yes. PDP improvements tie into digital shelf performance and retail media effectiveness by improving the conversion signals that ad algorithms use for placement optimization, but only when conversion volume is sufficient to generate meaningful data.
Leave a comment: