Published: March 2020 | Last Updated:April 2026
© Copyright 2026, Reddog Consulting Group.

TL;DR:
- Focus on optimizing the top 20% of SKUs to drive 80% of growth and margins.
- Implement regular data-driven reviews weekly or biweekly to maintain optimization momentum.
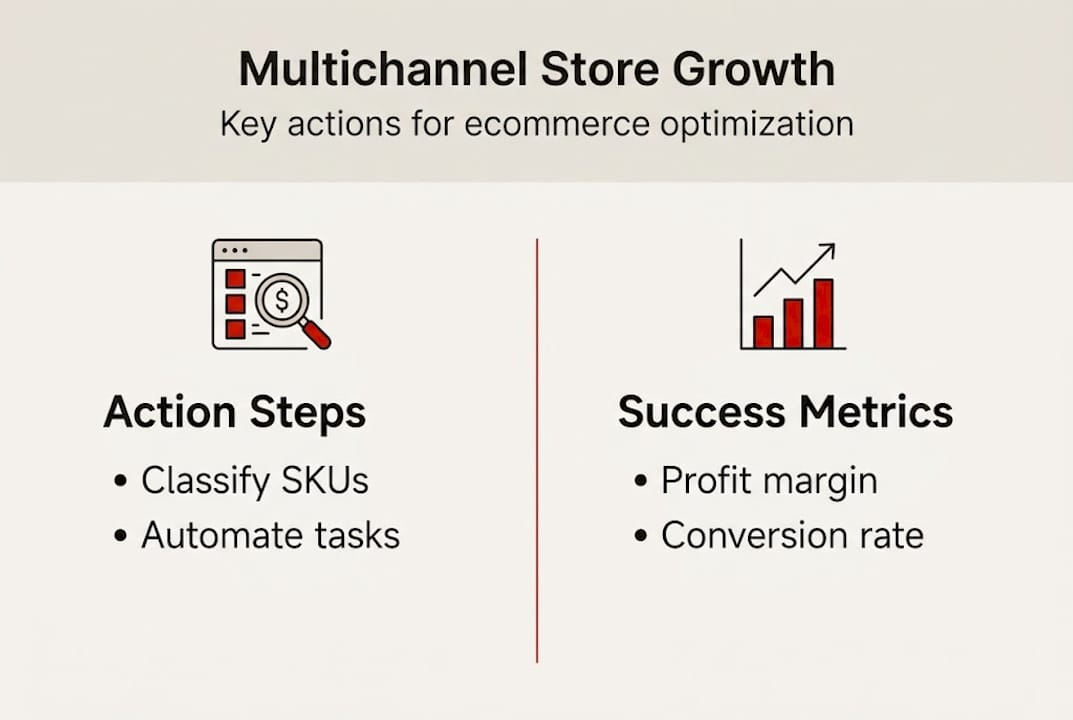
- Classify SKUs into A, B, and C to focus resources on the most profitable products.
Growing online sales is exciting until you realize your margins aren’t keeping pace. Many CPG founders watch revenue climb while contribution margin stays flat or shrinks, squeezed by rising ad costs, bloated SKU catalogs, and pricing that was never built for multichannel reality. The good news is that targeted, repeatable optimization can change that picture faster than most operators expect. This guide walks you through a four-stage framework: assess your current state, build the right processes, execute SKU and pricing tactics, and verify what’s actually working. Each stage is practical and built for brands in the $500K to $20M range navigating real retail complexity.
| Point | Details |
|---|---|
| Focus on winners | Direct your efforts and resources toward your top-performing SKUs for outsized margin growth. |
| Leverage automation | Implement tools and set scheduled reviews to optimize pricing and inventory efficiently. |
| Iterate consistently | Optimization thrives on weekly adjustments, quick lessons, and repeated refinement to stay ahead in competitive markets. |
| Cull distractions | Regularly cut underperforming SKUs to boost overall profitability, not just topline revenue. |
Before you can fix anything, you need to know what’s broken and what’s quietly working. Most CPG operators are surprised to find that a handful of SKUs carry the entire margin load while a long tail of products erodes cash flow and operational bandwidth. Getting clear on your baseline is the first and most important step.
Start by pulling three core profit metrics for every SKU across every channel:
Once you have those numbers, segment your SKUs into three classes:
| SKU class | Criteria | Action |
|---|---|---|
| A-class | Top 20% of revenue and margin | Protect, invest, optimize pricing |
| B-class | Middle performers with growth potential | Test pricing, improve listing quality |
| C-class | Low margin, low velocity, high complexity | Evaluate for culling or reformulation |
Here’s a sample snapshot of what this might look like for a mid-size CPG digital store:
| SKU | Monthly revenue | Contribution margin | Conversion rate | Class |
|---|---|---|---|---|
| SKU-01 | $18,400 | 42% | 4.8% | A |
| SKU-02 | $9,200 | 31% | 3.1% | B |
| SKU-03 | $3,100 | 8% | 1.9% | C |
| SKU-04 | $21,000 | 45% | 5.2% | A |
| SKU-05 | $1,800 | 6% | 1.2% | C |
The pattern is almost always the same. Your A-class SKUs are doing the heavy lifting. As ecommerce strategy research confirms, optimizing your top 20% of SKUs drives 80% of growth, outperforming long-tail bets every time. Your SKU rationalization guide can help you structure this analysis with more precision.
Pro Tip: Don’t let the excitement of new product launches distract you from weekly optimization of your existing winners. Chasing long-tail SKU expansion before your core catalog is dialed in is one of the fastest ways to bleed margin without realizing it.
Once you’ve mapped your profit drivers and drains, it’s time to lay the groundwork for repeatable improvements. Having the right data is only useful if you have a system to act on it consistently. Most growth-stage CPG brands underinvest here and end up doing one-off analysis that never compounds into real results.
A weekly or biweekly performance review is the backbone of any serious optimization effort. Block two hours every week to review your A-class SKU metrics, flag any pricing anomalies, and check inventory velocity. Biweekly reviews work for B-class SKUs where changes move more slowly. C-class products deserve a monthly audit focused on the exit decision.
Here’s how a manual workflow compares to an automated one:
| Task | Manual workflow | Automated workflow |
|---|---|---|
| Pricing updates | Spreadsheet review, manual changes | Rules-based repricing tool updates in real time |
| Inventory alerts | Weekly check, risk of stockout | Threshold alerts trigger reorder automatically |
| Performance reporting | Pulled ad hoc, inconsistent | Dashboard refreshes daily, trend lines visible |
| Margin tracking | Calculated per SKU manually | Integrated with COGS data, updated continuously |
For most brands in the $1M to $10M range, a hybrid approach works best. Use automation for pricing and inventory alerts, and reserve human judgment for strategic decisions like whether to cut a SKU or test a new price point.
Core team roles to assign, even on a small team:
SKU profitability analysis works best when it’s a scheduled habit, not a reactive scramble. Pairing your review cadence with strong supply chain optimization practices and solid merchandising best practices gives you a complete operational picture rather than isolated data points.
If you’re running lean with limited team resources, prioritize automating inventory alerts first. A stockout on an A-class SKU during a peak sales window costs far more than any tool subscription.

With resources in place, you’re ready to act on your priorities and maximize returns from your core SKUs. This is where strategy turns into dollars, and the steps below are designed to be repeatable, not one-time fixes.
As ecommerce strategy analysis makes clear:
“Optimizing your top 20% of SKUs through weekly pricing and operations tweaks on performers consistently outperforms long-tail bets.”
This is worth repeating because most brands do the opposite. They spread effort across 40 SKUs when five of them are generating 75% of margin. Focusing your CPG site profitability efforts on those five first is the highest-leverage move available to you. Pair that with proven sales optimization tactics and you’ll compound gains faster than any new product launch could.
Pro Tip: When testing price changes, change one variable at a time. If you adjust price and update the listing simultaneously, you won’t know which change drove the result. Test small, measure clean, and cull losers fast.
Optimization is an ongoing process. Here’s how you know your approach is working and when to adjust course. The most common mistake brands make after implementing changes is either overreacting to a single bad week or ignoring a sustained downward trend because the change felt right strategically.
The KPIs to monitor after any optimization cycle:
Here’s a sample before-and-after table based on a four-week optimization cycle for a CPG brand:
| Metric | Before optimization | After 4 weeks | Change |
|---|---|---|---|
| Contribution margin (avg) | 28% | 36% | +8 pts |
| AOV | $34.20 | $41.80 | +22% |
| Conversion rate (A-class) | 3.4% | 4.9% | +44% |
| C-class SKU count | 14 | 6 | -57% |
| Weekly revenue | $41,000 | $47,500 | +16% |
These numbers aren’t hypothetical benchmarks pulled from a generic study. They reflect what disciplined, focused optimization actually produces when you stop spreading effort thin.
Common pitfalls to avoid during the verification phase:
Your ecommerce growth strategy should treat verification as the start of the next cycle, not the end of the current one. Pair your results review with a structured growth workflow to keep the momentum compounding.
Here’s what most optimization content won’t tell you: the brands that consistently win on margin are not the ones with the most sophisticated tools or the largest SKU catalogs. They’re the ones who are ruthlessly boring in the best possible way. They do the same focused analysis every week. They cut products that don’t earn their place. They resist the pull of shiny new tactics.
The myth of infinite SKU expansion is one of the most expensive beliefs in CPG. Every new SKU adds complexity to your supply chain, fragments your marketing spend, and dilutes the attention your best products deserve. Scaling omnichannel success requires the discipline to say no to good ideas so your great ones get the resources they need.
Shiny-object syndrome is real in this industry. A new platform, a new ad format, a new product line. Each one feels like the answer. But the operators who build durable margin do it through disciplined repetition, not by chasing the next growth hack. The framework in this guide is not exciting. It’s effective. And in CPG, effective beats exciting every time.
Putting this framework into practice takes more than a checklist. It takes structured thinking, clean data, and the ability to make hard calls on SKUs and pricing without second-guessing every move.
RedDog Group works directly with CPG brands across Amazon, Walmart, DTC, and wholesale channels to build exactly this kind of margin-first operational clarity. If you’re ready to stop guessing and start optimizing with a proven partner, explore our omnichannel growth support resources or get started with our CPG retail growth offer. We help growth-stage brands identify where margin is leaking and build the systems to stop it, channel by channel.
Focus on conversion rate, average order value, and SKU-level profitability for the biggest impact. Optimizing your top SKUs consistently delivers more margin lift than expanding into new product lines.
Weekly or biweekly reviews are ideal for quickly spotting trends and maximizing growth opportunities. Weekly ops tweaks on your top performers outperform quarterly planning cycles by a wide margin.
SKU classification reveals which products drive profits and which drain resources, allowing you to focus on what matters most. Culling C-class drainers frees up cash, attention, and supply chain capacity for your real winners.
Automated tools streamline analytics, pricing changes, and inventory management so you can react faster than manual methods allow. For small teams, automating inventory alerts and repricing rules delivers the highest return on investment.
Done right, focusing on your best sellers and trimming poor performers usually increases margins and frees up growth capital. Classifying and culling SKUs is one of the safest, highest-impact moves a growth-stage CPG brand can make.
Leave a comment: