Published: March 2020 | Last Updated:November 2025
© Copyright 2026, Reddog Consulting Group.

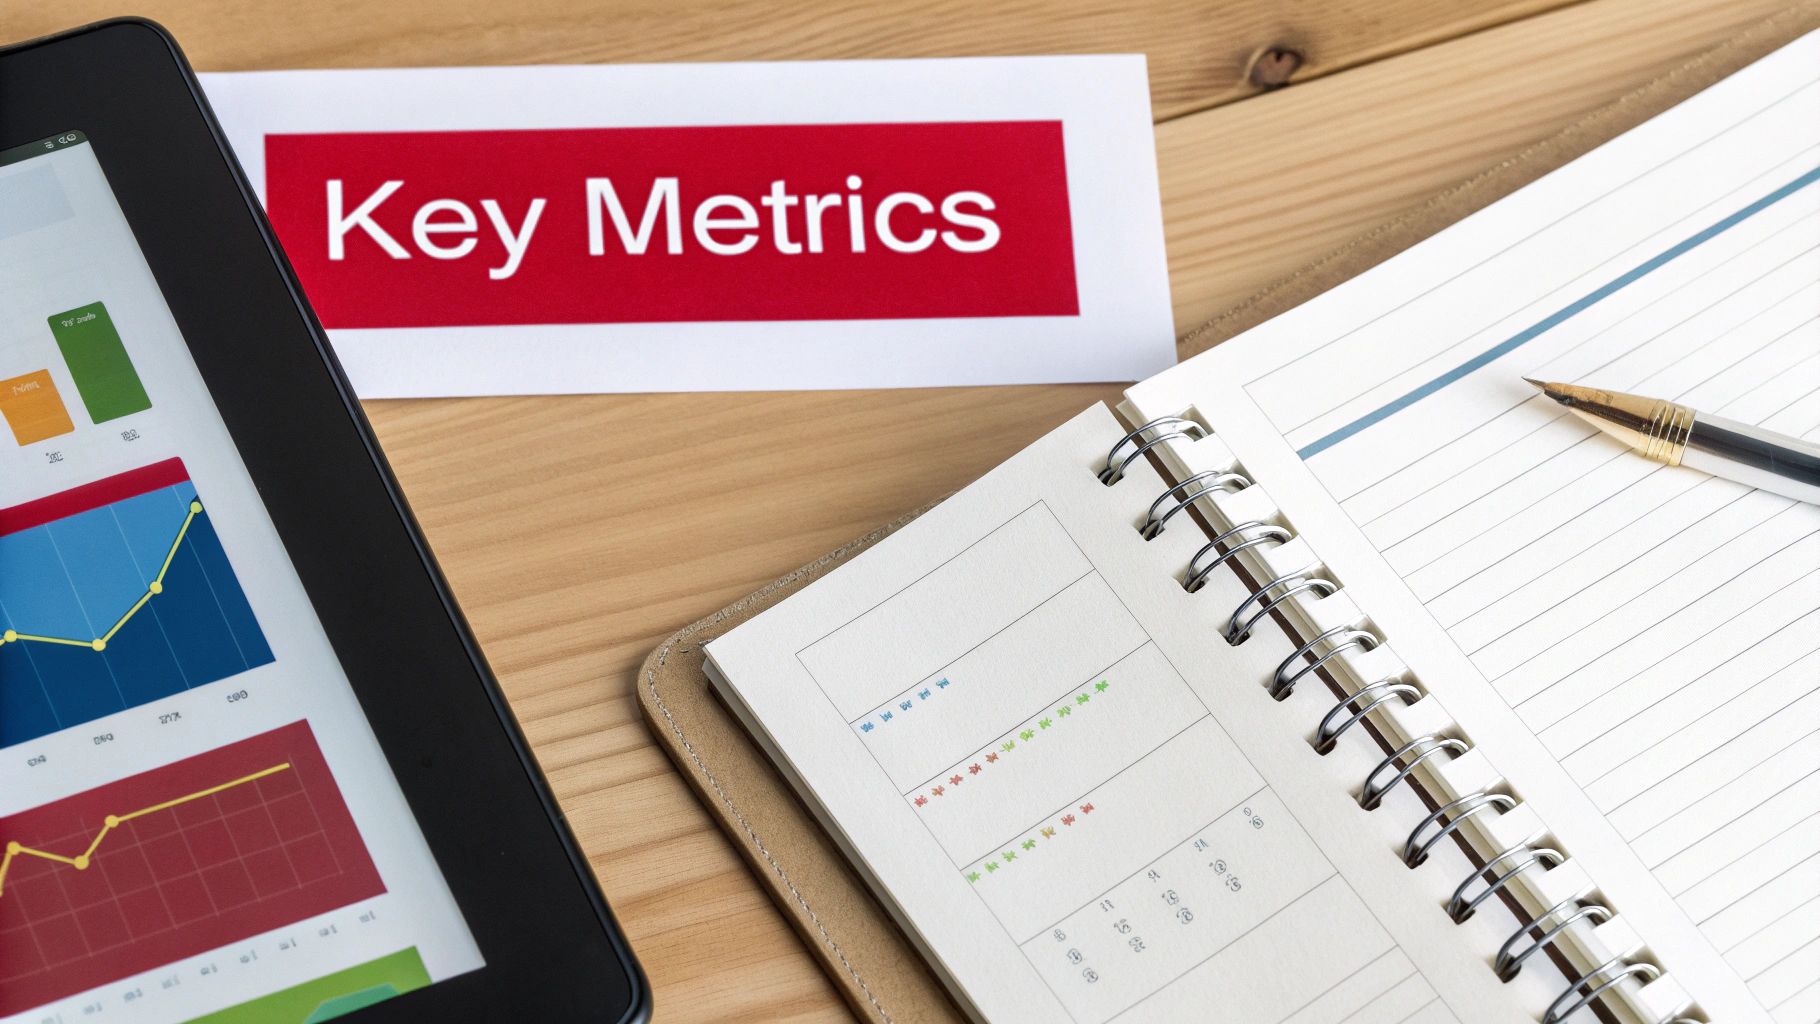
Your sales conversion rate is one of the most vital signs of your business's health. In plain language, it's the percentage of visitors who take the action you want them to—usually, making a purchase. It’s the ultimate measure of how effectively your entire omnichannel experience turns casual interest into measurable revenue.

Let’s move past the textbook definition. Picture your business as a physical store. If 100 people walk through your doors but only two buy something, your store has a 2% conversion rate. This number isn't just a metric; it's a direct report card on your operational efficiency.
A low rate signals friction somewhere in the customer journey, while a high rate proves you’re connecting with your audience. It’s a reflection of everything from your website design and product descriptions to your checkout flow and in-store layout.
Improving your sales conversion rate is about generating more revenue from the traffic you already have. Instead of simply pouring more budget into ads to attract new visitors, you focus on better serving the people who are already engaged. This is the heart of sustainable growth and the first step in our Foundation → Optimization → Amplification framework.
A higher conversion rate means every dollar you spend on marketing goes further, boosting your return on investment and fueling scalable growth across every channel, both online and off.
This single metric provides critical feedback on your operations. It helps you pinpoint exactly where customers might be dropping off, allowing you to make targeted, high-impact improvements. You might discover a clunky online checkout is killing sales or that confusing in-store signage is frustrating shoppers. To really dig in, it helps to understand what is conversion rate and why it matters.
In today's integrated retail landscape, tracking this metric across every customer touchpoint is non-negotiable. A healthy sales conversion rate isn’t just about one channel hitting its numbers. It’s about creating a fluid experience where a customer can discover a product on Instagram, research it on your website, and pick it up in-store without a single hiccup.
By mastering this fundamental metric, you unlock the ability to:
Ultimately, your sales conversion rate is the starting point for building a stronger, more profitable brand. It’s the foundational number that, once improved, creates a positive ripple effect across your entire business.
Figuring out your sales conversion rate is surprisingly simple, yet it’s the key to unlocking a deeper understanding of your business performance. The formula is straightforward and serves as the perfect starting point for meaningful analysis.
The basic calculation looks like this:
(Total Number of Sales / Total Number of Visitors) x 100 = Sales Conversion Rate (%)
For example, if your eCommerce store had 10,000 visitors last month and completed 200 sales, your sales conversion rate would be 2%. The math isn’t the hard part—the real work lies in defining your terms and ensuring your data is clean and consistent.
The accuracy of your conversion rate hinges on how consistently you define "sales" and "visitors" across every channel.
The key is consistency. Whatever you decide "visitor" means for a specific channel, stick with it. Mixing definitions will only produce messy data and lead you to the wrong conclusions.
For instance, comparing your website's conversion rate (based on user sessions) directly against an email campaign's rate (based on clicks) isn't an apples-to-apples comparison without acknowledging the different denominators.
To make this clearer, let's look at how the conversion rate formula applies across different channels.
This table demonstrates how to apply the sales conversion rate formula to different business channels, clarifying the key variables in each scenario.
| Channel | Conversion Action (The Sale) | Visitor/Lead Source | Example Calculation |
|---|---|---|---|
| eCommerce Website | Completed checkout | Unique website visitor | (500 Sales / 25,000 Visitors) x 100 = 2% |
| Amazon Storefront | Order confirmation | Unique visitor to product detail page | (150 Sales / 5,000 Visitors) x 100 = 3% |
| B2B Sales Funnel | Signed contract | Marketing Qualified Lead (MQL) | (10 Closed Deals / 100 MQLs) x 100 = 10% |
| Brick-and-Mortar Store | In-store purchase | Person walking through the door | (200 Purchases / 1,000 People) x 100 = 20% |
As you can see, the core logic remains the same, but the specific definitions of "sale" and "visitor" adapt to fit the context of each channel.
While the final sale is what pays the bills, the customer journey is filled with smaller, crucial steps that signal intent. These are called micro-conversions.
Tracking them gives you a much richer story of where your sales process is working and where it’s breaking down.
Examples of valuable micro-conversions include:
Imagine you see a low macro-conversion rate (sales) but a high micro-conversion rate for "adds to cart." This tells you something specific: customers want your products, but an obstacle at checkout—like unexpected shipping fees or a clunky payment form—is preventing the sale. This insight allows you to focus your efforts exactly where they’ll have the biggest impact.
So, you’ve calculated your sales conversion rate. The next question is always, "Is this number good?"
The honest answer? It depends. A "good" conversion rate isn't a universal number. It's a moving target that varies by industry, channel, customer location, and even average product price.
Comparing a boutique clothing brand’s rate to a big-box electronics store is like comparing a sprinter to a marathon runner—both are running, but the context and goals are completely different. The real win is understanding the right benchmarks for your specific playing field.
This visual shows how the basic pieces of the puzzle fit together.

It’s a simple formula: traffic comes in, sales go out, and what’s left in the middle is your conversion rate.
For most direct-to-consumer (DTC) brands, improving conversion rates is a game of inches. Knowing a healthy baseline helps you set realistic growth targets.
The global average eCommerce conversion rate typically hovers between 2% and 4%. However, this figure is influenced by sector, region, and device.
For instance, the Food & Beverage industry often sees higher rates, around 4.9%, due to repeat purchases and lower average order values. Conversely, high-consideration items like Luxury & Jewelry are closer to 0.95%. This makes sense—people take longer to commit to a diamond ring than a bag of coffee.
Geography matters, too. The US averages a 2.6% conversion rate, while desktop computers still convert slightly better at 3.2% compared to mobile’s 2.9%. Many shoppers still prefer a larger screen to finalize their purchase. You can explore more detailed conversion rate data to see how you stack up.
The goal isn’t to hit some magic industry average. It’s to establish your own baseline and then systematically work to improve it, month over month. This is the Foundation of a strong growth strategy.
When you move from your own website to a massive marketplace like Amazon or Walmart, the conversion dynamic shifts dramatically. The numbers here are often much higher, and it's crucial to understand why.
Shoppers on marketplaces arrive with high purchase intent. They aren’t there to browse your "About Us" page; they are ready to buy. Now.
This difference highlights a key omnichannel principle: your website is for building a relationship and telling your brand story. Marketplaces are pure transaction channels built for speed. Both are essential, but they must be measured against their own unique benchmarks.
In today's integrated retail world, your physical stores are a critical piece of the conversion puzzle. Measuring the sales conversion rate for a physical location is more straightforward but just as important. All you need is a simple door counter to track how many people walk in versus how many make a purchase.
A "good" conversion rate in a physical store can range from 20% to 40% or even higher, depending on the store type and location. A corner convenience store will naturally convert better than a high-end furniture showroom where browsing is common.
The key is to treat in-store performance as another vital data point. A poor conversion rate might point to issues with store layout, staffing, or merchandising—all fixable problems that can deliver an immediate revenue lift. Winning brands optimize every touchpoint, both online and off.

Knowing your numbers is the first step, but real growth comes from turning those insights into a repeatable plan. You need a structured approach to improving the small details that add up to a better sales conversion rate. At RedDog, we guide brands through a three-stage journey: Foundation → Optimization → Amplification.
This framework is a system for building a high-converting, resilient business. Think of it as patching the leaks in your bucket before you spend more money trying to fill it. Let's break it down.
Before diving into advanced tactics, you must get the basics right. The foundation stage is about creating a trustworthy, seamless, and intuitive shopping experience. These are the non-negotiables every customer expects.
Your foundation is the bedrock of your conversion rate. Without a solid, user-friendly experience, any efforts in the next two stages will be far less effective.
For a deeper look at these critical first steps, our guide on how to improve eCommerce conversion rates provides a guide to measurable growth.
With a solid foundation in place, it’s time to fine-tune the experience based on how real customers behave. Optimization is all about data-driven testing and making small, intelligent improvements over time.
This is where you move from building the store to strategically arranging the aisles for more sales. Key actions in this stage include:
This stage is a continuous cycle: test, learn, implement. Each small win, like a 0.5% increase in add-to-cart rates, compounds over time.
Once your store is well-built and running smoothly, it’s time to amplify your efforts by driving high-quality traffic. The amplification stage is about attracting the right shoppers—those most likely to convert because you've created an experience tailored to them.
This isn't about casting a wide net; it's about targeted outreach to bring the right people to your optimized site.
Amplification strategies that boost your sales conversion rate include:
This structured approach transforms conversion rate optimization from a complex challenge into a clear, repeatable roadmap for growth. For more hands-on ideas, explore these 10 practical ways to improve ecommerce conversion rates.
You can't improve what you don't measure. Focusing only on your overall sales conversion rate is like looking at a game's final score—it tells you who won, but not how. To build a data-driven growth strategy, you need to track the key performance indicators (KPIs) that tell the story behind that number.
These supporting metrics are your diagnostic tools. They help you pinpoint where the customer journey is working and where it’s breaking down. For example, a high cart abandonment rate might signal a broken checkout process, while a low average order value suggests missed upselling opportunities.
Think of your main conversion rate as the destination. These other metrics are the signposts that tell you if you’re on the right path. Tracking them provides the context needed to make smart, impactful decisions.
Cart Abandonment Rate: The percentage of shoppers who add products to their cart but leave before completing the purchase. A high rate—the average is around 70%—often points to friction like unexpected shipping costs or a complicated form.
Average Order Value (AOV): AOV measures the average amount spent per order. Increasing your AOV is one of the fastest ways to grow revenue without acquiring new customers.
Bounce Rate: The percentage of visitors who land on a page and leave without taking any other action. A high bounce rate on a product page could mean your ad copy doesn't align with the page content, or the page design isn't compelling.
By monitoring these KPIs together, you move from knowing what is happening to understanding why. This shift is fundamental to building a data-driven culture where decisions are backed by clear insights, not guesswork.
To track these metrics effectively across all channels, you need the right tools. A solid toolkit doesn’t need to be complex or expensive; it just needs to deliver clear, actionable data that connects the dots between your online and offline performance.
A practical toolkit should include foundational analytics platforms and specialized optimization software. To learn more, check out our complete guide to the role of analytics in business growth.
Here’s a look at the essential categories of tools:
1. Analytics Platforms
These are the cornerstones of your measurement strategy, giving you a high-level view of traffic, user behavior, and sales.
2. User Behavior Tools
These tools help you see how users actually interact with your site, turning abstract data into concrete observations.
3. A/B Testing Software
These platforms let you test changes to your site and measure their impact directly, removing guesswork from optimization.
Boosting your sales conversion rate isn’t a one-time fix. It’s an ongoing process—a commitment to understanding your customers on a deeper level and continually improving their experience. Lasting brand growth comes from a continuous cycle of measuring, testing, and refining every touchpoint.
It all starts with getting the fundamentals right: accurate calculations to know where you stand and smart benchmarking to set realistic goals across every channel, from your website and Amazon storefront to your physical store.
This is where a structured framework like Foundation → Optimization → Amplification becomes your roadmap. You begin by solidifying the user experience, then systematically test and improve it, and finally, drive high-intent traffic to a funnel you know works. Each stage builds on the last, creating a powerful, measurable engine for growth.
The real goal isn’t just to secure one-time buyers. It’s to create such a seamless and trustworthy experience that you turn casual visitors into loyal customers who keep coming back.
As you refine your approach, you’ll see how small, data-driven tweaks can compound over time. A smart omnichannel guide to personalized marketing explained can lift conversions by making customers feel understood.
This dedication separates good brands from great ones. It transforms your conversion rate from a simple number on a dashboard into a direct reflection of how well you connect with your customers.
Ready to turn your traffic into real, repeatable revenue? At RedDog Group, we specialize in building the systems that drive sustainable omnichannel growth.
Understanding your sales conversion rate is less about finding a single magic number and more about consistently asking the right questions. Here are a few common ones that arise as brands get serious about mastering this metric.
While they sound similar, these two metrics track different parts of the customer journey. Think of it as a relay race: lead conversion is the first leg, and sales conversion is the final sprint to the finish line.
A lead conversion rate measures how effectively you turn a curious visitor (like someone who fills out a form) into a qualified lead. It's a top-of-funnel metric that indicates if your initial marketing hook is working.
A sales conversion rate measures how well you turn that qualified lead—or any visitor—into a paying customer. This is a bottom-of-funnel metric focused purely on closing the deal and generating revenue.
You need both. A high lead conversion rate is great, but if those leads never buy, you don’t have a sustainable business.
Patience is crucial when running an A/B test. Ending a test too early can lead to decisions based on random chance rather than true customer behavior. There are two main factors to consider.
First, you need to reach statistical significance. This is a technical way of saying you're confident the results aren't a fluke. Most A/B testing tools will indicate this for you, typically at a 95% confidence level.
Second, you should let the test run for at least one full business cycle—usually one to two weeks. This helps smooth out daily fluctuations in traffic. After all, how people shop on a Monday morning differs from a Saturday night.
A classic mistake is stopping the test the second one version pulls ahead. Let it run its course. You need enough data from a wide range of visitors to know the results are real and repeatable.
With more than half of all eCommerce traffic coming from phones, optimizing the mobile experience is no longer optional. Mobile conversion rates often lag behind desktop, but you can close that gap by focusing on speed and simplicity.
Here are a few practical takeaways that make a huge difference:
The goal is to remove every point of friction and make it effortless for customers to complete their purchase.
At RedDog Group, we specialize in building the systems that drive sustainable omnichannel growth. Ready to turn your traffic into real, repeatable revenue?
Leave a comment: