
Published: March 2020 | Last Updated:July 2026
© Copyright 2026, Reddog Consulting Group.

TL;DR:
- Effective inventory management tracks stock from procurement to sale to increase efficiency and reduce costs. It relies on accurate data, proper categorization, demand forecasting, and regular cycle counts, especially for high-value items. Consistent practices and KPI monitoring prevent stockouts, excess inventory, and margin leaks across multiple channels.
Inventory management is the systematic process of overseeing stock from procurement to sale to maximize efficiency and minimize costs. Knowing how to do inventory management well separates brands that scale profitably from those that bleed cash into dead stock and missed orders. The core cycle covers five stages: stock assessment, ABC categorization, demand forecasting, reorder point setting, and rolling cycle counts. Each stage builds on the last, and skipping any one of them creates gaps that compound over time. This guide walks you through each step with the KPIs, tools, and pitfalls that matter most in 2026.
Effective inventory control starts before you touch a single SKU. You need a single source of truth for your product data. Every SKU must have a consistent naming convention, unit of measure, and cost attached to it. Without that foundation, every report you run is suspect.

The right software category depends on your volume and complexity. Small operations often start with a basic warehouse management system (WMS) or an entry-level inventory module inside an ERP platform. Brands scaling across multiple channels need a system that syncs in real time across Amazon, Walmart, DTC, and wholesale. Barcode scanning and RFID tagging reduce manual entry errors at receiving and picking, which is where most data breaks down.
Clear role definitions matter as much as software. Someone must own receiving accuracy. Someone else must own cycle count scheduling. Without named accountability, tasks fall through the cracks and your inventory data drifts from reality within weeks.
Pro Tip: Before selecting any software, map your current process on paper first. A tool built on a broken process just automates the mess.
Supplier data quality is the final prerequisite most teams overlook. Clean lead times, accurate pack sizes, and reliable advance ship notices (ASNs) feed your forecasting model. If your supplier sends inconsistent data, your reorder points will be wrong from the start.
Here is a quick reference for the core tools by function:
| Function | Tool category | Primary benefit |
|---|---|---|
| SKU data management | ERP or PIM system | Single source of truth for product records |
| Receiving and picking | Barcode scanner or RFID | Reduces manual entry errors at the dock |
| Demand forecasting | WMS or forecasting module | Data-driven replenishment signals |
| KPI reporting | BI dashboard or built-in analytics | Real-time visibility into inventory health |
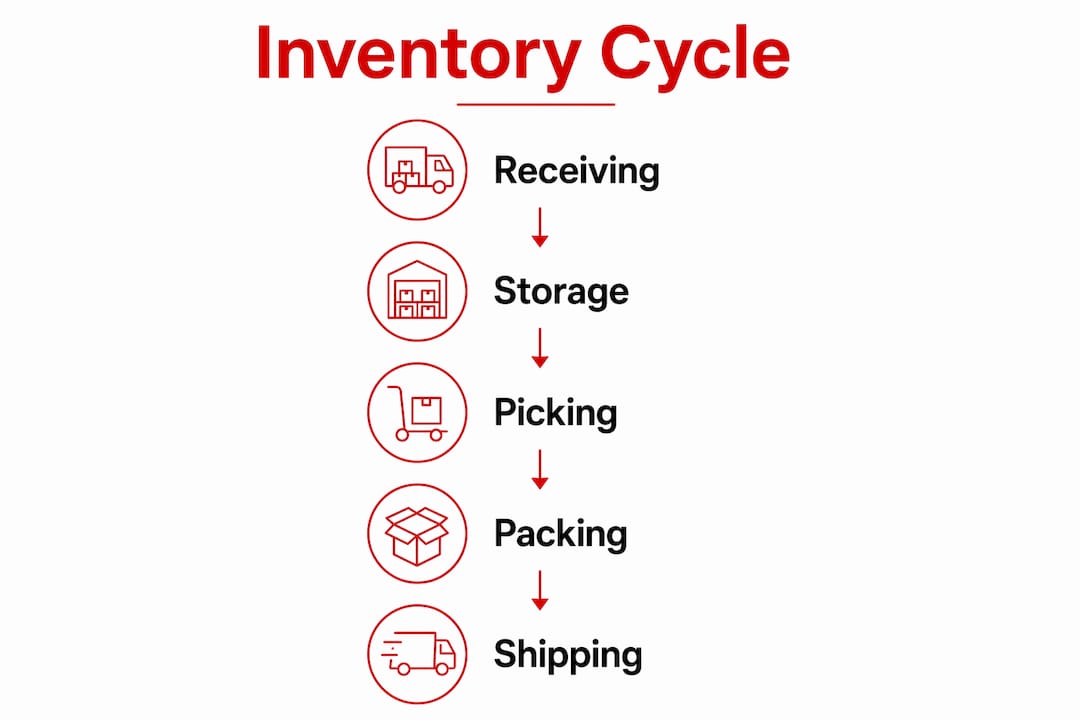
The cycle has five steps. Each one feeds the next, and the whole system runs on data accuracy.
Stock assessment. Start with a full count of what you actually have on hand. Compare it to what your system says you have. The gap between those two numbers is your starting inventory accuracy rate. Most operations find it lower than expected. This baseline tells you where your biggest data problems live before you build any process on top of them.
ABC/XYZ categorization. Sort your SKUs by revenue contribution and demand variability. ABC analysis groups items by value: A items drive the most revenue, B items are mid-tier, and C items contribute the least. XYZ analysis layers in demand predictability: X items sell consistently, Y items show seasonal patterns, and Z items are erratic. An AX item (high value, predictable demand) deserves tighter controls and more frequent counts than a CZ item. ABC analysis is one of the most reliable ways to focus your team’s attention where it generates the most return.
Demand forecasting. Good forecasting separates recurring sales patterns from noise. Optimized forecasting reduces both stockouts and excess inventory by treating each channel’s demand signal separately rather than pooling everything together. A promotion on Amazon does not look like organic DTC velocity, and blending them produces a forecast that fits neither. Always build in manual overrides for known events: trade promotions, seasonal peaks, and new retailer launches.
Reorder point setting with safety stock. A reorder point is the inventory level that triggers a purchase order. Automated reorder points account for lead time and demand variability, which removes the guesswork from replenishment decisions. Safety stock is the buffer you hold above the reorder point to absorb supplier delays or demand spikes. Calculate it using your lead time range and your average daily sales rate. Brands that skip safety stock are likely to experience stockouts during their best sales periods.
Rolling cycle counts. Annual physical inventory counts are disruptive and produce a snapshot that is already outdated by the time you finish. Rolling cycle counts targeting high-risk or fast-moving inventory maintain record accuracy above 98–99% without shutting down operations. Schedule A items for weekly counts, B items monthly, and C items quarterly. This rhythm catches errors before they compound.
Pro Tip: Run your first cycle count on your top 20 A items only. Fix those discrepancies before expanding the program. Small wins build the habit.
Receiving deserves its own discipline within this cycle. Every inbound shipment should be checked against the purchase order at the dock before it enters your system. Dock-side inspection and immediate logging of discrepancies improve your Available-to-Promise accuracy, which directly affects your ability to fulfill orders without cancellations.
Tracking the right metrics tells you whether your inventory process is working or just busy. Four categories cover everything that matters.
A five-minute KPI dashboard gives operational teams a daily read on inventory health without requiring a data analyst. The goal is to surface problems fast, not to produce reports.
KPIs are diagnostic tools, not scorecards. Use metrics to refine your forecasting models and safety stock sizes. Penalizing planners for variance destroys the honest reporting you need to improve.
Monthly forecast reviews for your top inventory tiers keep your models current. A KPI that never changes is a KPI nobody is acting on.
Most inventory problems trace back to a small number of recurring mistakes. Knowing them in advance saves you months of troubleshooting.
Pro Tip: Build a simple exception log. Every time your team makes a manual inventory adjustment, they record why. Review it monthly. Patterns in that log reveal your biggest process gaps.
Inventory management is a strategic lever that frees up cash flow by balancing stock levels with demand and supplier lead times. Brands that treat it as a back-office task consistently underperform on working capital efficiency.
Effective inventory control requires a structured cycle, accurate data, and consistent KPI monitoring to protect both margin and cash flow.
| Point | Details |
|---|---|
| Start with data accuracy | Audit your SKU records and on-hand counts before building any process on top of them. |
| Use ABC/XYZ categorization | Segment inventory by value and demand variability to focus controls where they matter most. |
| Forecast by channel | Separate demand signals by sales channel to avoid blended forecasts that fit no channel well. |
| Monitor four KPI categories | Track Service, Velocity, Quality, and Capital metrics on a single dashboard reviewed daily. |
| Define SOPs for exceptions | Document processes for partial shipments, returns, and substitutions to prevent hidden margin leaks. |
At Reddog, we work with CPG brands across Amazon, Walmart, DTC, and wholesale. The pattern we see most often is not a technology problem. It is a discipline problem.
Brands invest in a WMS or an ERP, then skip the foundational work: clean SKU data, named role accountability, and a receiving process with teeth. The software becomes a more expensive version of the spreadsheet it replaced. The inventory numbers still drift. The stockouts still happen. The carrying costs still climb.
The brands that get this right treat inventory management as a rhythm, not a project. They run cycle counts on a fixed schedule. They review their top KPIs every Monday morning. They hold a monthly forecast review for their A items and adjust safety stock when lead times shift. That rhythm is not complicated. It is just consistent.
The other insight worth naming: multichannel brands almost always underestimate how differently each channel consumes inventory. Amazon FBA velocity looks nothing like a Walmart WFS replenishment order, and neither looks like a regional distributor pull. Pooling those signals into one forecast is one of the fastest ways to end up simultaneously overstocked in one channel and out of stock in another. Segment your demand data before you build any model. The multichannel inventory approach is not optional for brands selling across more than two channels.
Inventory management done well is a cash flow strategy. Done poorly, it is a slow margin drain that shows up in your P&L as “cost of goods” and “storage fees” without anyone connecting the dots.
— Reddog
Inventory problems rarely announce themselves clearly. They show up as margin compression, surprise stockouts, or storage fees that keep climbing without explanation.
Reddog works with CPG brands in the $500K–$20M revenue range to identify exactly where inventory is costing them money and why. If you are unsure whether your reorder points are calibrated correctly, your channel forecasts are segmented properly, or your carrying costs are in line with your category benchmarks, a focused conversation can surface the answer fast. Book a free 30-minute strategy call through our CPG retail growth offer page. The session covers contribution margin, inventory velocity, and channel economics with no sales pressure and no generic advice.
Inventory management is the process of tracking and controlling stock from procurement through sale to balance availability with cost. It includes forecasting demand, setting reorder points, and maintaining accurate records through cycle counts.
Accurate inventory tracking requires barcode scanning or RFID at receiving, a single system of record for all SKUs, and rolling cycle counts that target high-velocity items weekly. Dock-side verification of every inbound shipment is the single highest-impact step most operations skip.
Segment demand data by channel before building any forecast. Amazon velocity, wholesale replenishment, and DTC orders follow different patterns, and blending them produces a forecast that fits none of them accurately. Review the omnichannel inventory practices Reddog recommends for brands selling across multiple platforms.
A healthy inventory turnover rate depends on your category and channel mix. Fast-moving consumer goods typically target higher turnover than specialty or seasonal products. The more useful metric is Days on Hand: if your DOH exceeds your supplier lead time by more than your safety stock buffer, you are holding excess capital in stock.
A items (your highest-value, fastest-moving SKUs) should be counted weekly. B items work well on a monthly schedule, and C items quarterly. This rolling approach maintains record accuracy above 98–99% without the disruption of an annual physical count.
Leave a comment: