Published: March 2020 | Last Updated:June 2026
© Copyright 2026, Reddog Consulting Group.

TL;DR:
- An ecommerce operations audit systematically evaluates technical, financial, inventory, and cross-channel processes to identify hidden margin leaks. Most successful audits are recurring, prioritize revenue impact, and involve cross-departmental alignment using clear KPIs and ownership. Regular, data-driven reviews improve profitability by addressing root causes instead of just symptoms.
An ecommerce operations audit is a systematic review of your online store’s processes, technology, and financial performance that identifies where efficiency breaks down and where margin leaks hide. Most operators running stores on Shopify, Amazon, or Walmart know their top-line revenue. Far fewer know their actual contribution margin by SKU and channel. That gap is exactly what a structured ecommerce operational review closes. Traditional auditing methods fall short for ecommerce because the business generates continuous, multi-system data that static reports simply cannot capture. The goal of this guide is to give you a practical, step-by-step framework for auditing your operations in 2026.
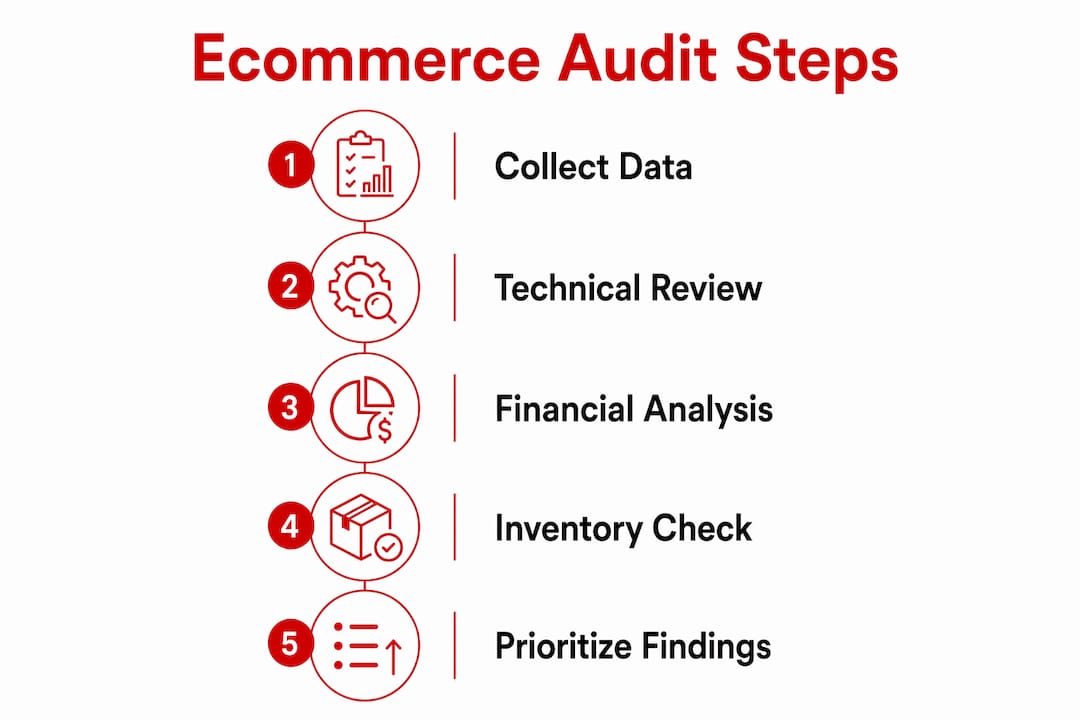
Before you can prioritize fixes, you need to know what data to collect. A complete ecommerce audit checklist covers five distinct areas, and skipping any one of them produces a blind spot that will cost you later.
| Audit Area | Key Data Sources |
|---|---|
| Technical infrastructure | Site speed, Core Web Vitals, crawl errors, API logs |
| Financial performance | Order-level P&L, refund rates, payment fees, channel costs |
| Inventory accuracy | Stock counts, WMS records, fulfillment error logs |
| Customer experience | Conversion rates, checkout success rates, cart abandonment |
| Cross-channel data | Amazon Seller Central, Walmart Seller Center, DTC analytics |
Technical infrastructure covers your platform (Shopify, Magento, WooCommerce), integrations, and SEO health. Audit logs provide immutable records of system events including price changes, cart abandonment triggers, and payment failures. Think of them as the CCTV footage for your store. When a checkout failure spikes on a Friday night, your analytics dashboard shows you the symptom. Your audit logs show you the cause.
Financial data must go deeper than your accounting software’s summary reports. You need order-level exports that include SKU, sales channel, cost of goods sold, fulfillment costs, payment processing fees, and any platform fees. Without this granularity, you are making channel decisions based on incomplete information.
Inventory systems require a cross-check between your warehouse management system (WMS), your ERP, and your actual physical counts. Discrepancies here directly cause stockouts, overselling, and customer service tickets. Continuous monitoring and automation reduce manual errors and speed up detection of inventory mismatches before they become customer-facing problems.
Collecting data is the easy part. Deciding what to fix first is where most operators stall. The most effective approach is a “dollars-recoverable” filter that ranks every finding by three factors: potential revenue impact, resource capacity required, and risk of doing nothing.
Here is how to apply it in practice:
One documented case reduced quote turnaround time from three to five days down to a few hours by automating approval workflows and integrating ERP and CPQ checks. The fix was not technically complex. It was simply invisible until the audit surfaced it.
Pro Tip: When you present your prioritized roadmap to leadership, lead with the dollar figure attached to each finding. “This checkout error costs us an estimated $8,000 per month” gets faster approval than “we found a UX issue.”
Technical performance directly affects both search rankings and conversion rates, which makes it one of the highest-leverage areas in any ecommerce operational review. The standard recommendation is to conduct full technical audits every quarter and immediately after any major site update, platform migration, or new integration launch.
The metrics that matter most in a technical audit are:
Performance thresholds should be set against your own historical data, not generic industry benchmarks. A threshold that is acceptable for a low-traffic catalog store is unacceptable for a high-volume CPG brand running promotional events. Tools like Google Search Console, Screaming Frog, and Datadog each serve different parts of this audit. For a deeper look at ecommerce SEO best practices that connect technical health to organic growth, Reddog has a dedicated resource worth reviewing.
This is the section most operators skip, and it is where the most money is hiding. Aggregated P&L reports hide the details that actually drive strategy. A product line can look profitable in your accounting software while losing money on Amazon after FBA fees, return processing, and storage costs are factored in at the SKU level.

The fix is to build a flat data table. Pull every order from a defined period (90 days is a practical starting point) and include these columns: order ID, SKU, sales channel, gross revenue, COGS, fulfillment cost, payment processing fee, platform fee, and refund amount. When you sort this table by contribution margin rather than gross revenue, the ranking of your best and worst performers almost always changes.
Operational KPIs to track alongside the financial data include:
Pro Tip: If you sell on both Amazon and your DTC site, run the contribution margin calculation separately for each channel. The same product can have a 40% margin on your website and a 12% margin on Amazon after fees. Knowing this changes your advertising spend decisions immediately.
Integrated ERP systems like NetSuite or Cin7 make this analysis faster by centralizing order, inventory, and cost data. Without integration, you are manually reconciling spreadsheets, which introduces errors and delays the decisions that protect your margin. For a structured growth planning framework that connects financial audit findings to channel strategy, Reddog’s ecommerce growth resource covers the full picture.
Technical fixes fail when the process around them does not change. Manual handoffs and unclear responsibilities between Sales, IT, Operations, and Marketing cause 70 to 80% of ecommerce operational inefficiencies. That figure is higher than most operators expect, and it means that software upgrades alone will not solve most of what your audit uncovers.
A RACI matrix (Responsible, Accountable, Consulted, Informed) is the most direct tool for exposing these gaps. Map every key process in your audit, from new product listing creation to return processing, and assign a RACI role to each team. Gaps in the “Accountable” column are where things fall through.
Cross-functional auditing identifies root causes in process and communication gaps, not just system flaws. Structured interviews with team members who execute the processes daily surface issues that no dashboard will show you. Ask the person who processes returns what breaks most often. Ask the warehouse team what the most common picking error is. These conversations take two hours and routinely reveal the highest-value fixes in the entire audit.
Shared cross-departmental KPIs like order accuracy rate, quote turnaround time, and self-service adoption rate keep teams aligned after the audit ends. Audit roadmaps with shared acceptance criteria and biweekly progress reviews sustain momentum far better than a one-time presentation to leadership. For guidance on building multichannel KPI frameworks that hold up across departments, Reddog’s 2026 resource is a practical starting point.
A complete ecommerce operations audit requires order-level financial data, technical performance metrics, inventory accuracy checks, and cross-functional process alignment to surface the margin leaks that aggregate reports miss.
| Point | Details |
|---|---|
| Start with order-level data | Build flat tables by SKU and channel to find true contribution margins. |
| Use a dollars-recoverable filter | Rank every audit finding by revenue impact before assigning resources. |
| Run technical audits quarterly | Check Core Web Vitals, TTFB, and checkout success rates after every major update. |
| Map RACI gaps across teams | 70 to 80% of inefficiencies come from process and communication gaps, not software. |
| Set KPI thresholds from your own history | Generic benchmarks mislead. Use your historical data as the baseline. |
After working with CPG brands across Amazon, Walmart, and DTC channels, the pattern Reddog sees most often is this: operators run an audit, produce a long list of findings, and then fix the three easiest items before momentum stalls. The audit becomes a document rather than a decision.
The brands that get real results from an ecommerce operational review treat it as a recurring practice, not a one-time project. Quarterly cycles with a consistent structure build institutional knowledge over time. You stop rediscovering the same problems and start tracking whether your fixes actually held.
The other mistake is dashboard fatigue. Tiering your metrics into Tier 1 (business sustainability) and Tier 2 (channel optimization) keeps your team focused on the three to five numbers that actually drive decisions. Adding twenty KPIs to a shared dashboard does not create clarity. It creates noise that everyone learns to ignore.
The qualitative side of an audit is underrated. Numbers tell you what is broken. Conversations with your operations team tell you why it keeps breaking. The most impactful audits Reddog has supported combined both, and the fixes that stuck were always the ones where the team understood the root cause rather than just the symptom.
— Reddog
Running a thorough ecommerce operations audit takes structure, the right data, and a clear framework for turning findings into decisions. Reddog works with CPG brands in the $500K to $20M revenue range to build audit frameworks customized to their specific platforms, channels, and business models.

The work covers order-level contribution margin analysis, technical performance benchmarking, inventory accuracy reviews, and cross-departmental alignment. Reddog’s approach is margin-first: every finding gets evaluated by what it costs you to leave it unfixed. If you want a structured review of your channel economics, inventory velocity, or fulfillment costs, the CPG retail growth offer page outlines exactly how that engagement works. Qualified founders and operators can book a free 30-minute strategy call to walk through the numbers that matter most to their business right now.
An ecommerce operations audit is a structured review of your store’s technical infrastructure, financial performance, inventory accuracy, and cross-channel processes. The goal is to identify inefficiencies and margin leaks that aggregate reports do not surface.
Full technical and operational audits should run quarterly and immediately after major site updates or platform changes. Financial contribution margin reviews are most useful on a monthly or rolling 90-day basis.
You need order-level exports by SKU and channel, platform and fulfillment fee records, inventory system logs, site performance data from tools like Google Search Console, and support ticket categorization. Aggregated reports are not sufficient.
Most audits stall because findings are not ranked by revenue impact and ownership is not assigned before the meeting ends. Without a tiered roadmap and shared KPIs across Sales, IT, and Operations, fixes address symptoms rather than root causes.
Build a flat order-level data table that includes COGS, fulfillment costs, payment fees, and refunds by SKU and channel. Sorting by contribution margin rather than gross revenue almost always reveals products or channels that appear profitable but are not.
Leave a comment: