
Published: March 2020 | Last Updated:July 2026
© Copyright 2026, Reddog Consulting Group.

TL;DR:
- Competitive benchmarking compares your company’s key metrics against competitors to identify performance gaps.
- Businesses use it to inform operational decisions like pricing and market share, with recurring cycles for accuracy.
Competitive benchmarking is defined as the systematic process of measuring your company’s key performance metrics against those of direct competitors to identify performance gaps and inform strategic decisions. The practice differs from broader competitive analysis, which maps the full competitive environment. Benchmarking is narrower and more quantitative. It focuses on specific, comparable metrics like revenue growth, market share, customer retention, and effective net pricing. Industry standards recommend at least a quarterly cadence for high-velocity markets like consumer packaged goods, and a semi-annual minimum for slower-moving categories. That frequency matters because benchmarking only drives decisions when the data reflects current market conditions, not last year’s reality.
Competitive benchmarking is a subset of the broader competitive analysis process. Competitive analysis describes the full picture of who your competitors are, what they sell, and how they position themselves. Benchmarking takes that one step further by attaching numbers to the comparison. You are not asking “what are they doing?” You are asking “how do our results compare to theirs, and by how much?”

The distinction matters for business leaders because the two tools serve different decisions. Competitive analysis informs market entry, product development, and brand positioning. Benchmarking informs operational adjustments, pricing corrections, and investment prioritization. A CPG brand deciding whether to expand into Walmart needs competitive analysis. That same brand deciding whether its promotional spend as a percentage of revenue is out of line with category norms needs benchmarking.
The metrics that benchmarking tracks fall into three broad categories. Financial metrics include revenue growth rate, gross margin, and marketing spend as a percentage of revenue. Operational metrics include inventory turnover, order fill rates, and distribution coverage. Market metrics include share of shelf, product availability, and customer ratings. Each category answers a different strategic question, so the metrics you choose must connect directly to the decision you are trying to make.
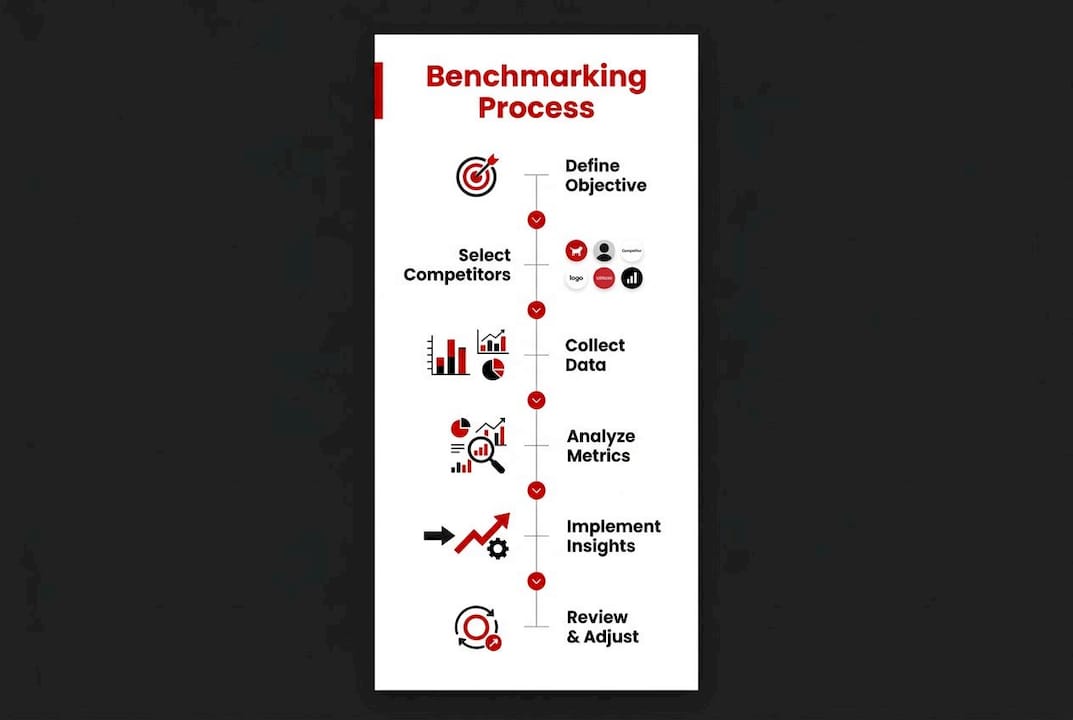
Effective benchmarking follows a six-stage lifecycle that starts with a clear business objective and ends with a specific strategic action. Skipping any stage produces data that looks useful but drives no real change.
Define the business objective. Every benchmarking exercise must link to one specific decision. Are you evaluating whether your pricing is competitive? Assessing whether your trade spend is above or below category norms? The objective determines every other choice in the process.
Identify comparable competitors. Only compare companies at a similar stage of maturity, operating in the same channels, and serving the same customer segments. Comparing a $2M regional CPG brand to a $200M national brand produces misleading conclusions.
Standardize and validate data. Standardization of time periods, geography, and currency is non-negotiable before analysis begins. A competitor’s Q4 revenue spike means nothing if your data covers Q3. Inconsistent inputs destroy the integrity of the comparison.
Analyze the gaps. Calculate the difference between your metrics and the benchmark. Rank gaps by magnitude and by strategic relevance. Not every gap requires a response.
Interpret with business logic. Data without context is dangerous. A competitor’s lower cost of goods may reflect a longer operating history, a different supply chain model, or a regulatory advantage you cannot replicate. Context explains the “why” behind the gap.
Execute and monitor. Translate the top two or three insights into specific changes. Assign owners, set timelines, and schedule the next benchmarking cycle to measure whether the gap is closing.
Pro Tip: Focus on a small, weighted set of KPIs across three or more business categories rather than tracking every available metric. A long list of metrics dilutes attention and rarely produces a clear decision.
Most benchmarking failures are not data problems. They are design problems. The exercise was set up in a way that guaranteed it would produce noise instead of signal.
Comparing non-comparable companies. Choosing too many KPIs or comparing businesses with fundamentally different models wastes analyst time and produces misleading conclusions. A DTC-only brand and a full omnichannel brand have structurally different cost profiles. Comparing their gross margins without adjustment tells you nothing useful.
Using stale data. A benchmarking report built on data that is six months old in a fast-moving category is a historical document, not a planning tool. The market has already moved.
Ignoring market context. A competitor’s strong revenue growth in a new geography may reflect a temporary promotional push, not a structural advantage. Factors like market maturity, regulatory constraints, and cost structures must be considered before drawing conclusions.
Tracking vanity metrics. Social media follower counts and press mentions feel like competitive intelligence. They rarely connect to the decisions that drive margin or market share.
Skipping data validation. Raw data from public sources, retail audits, or third-party panels contains errors. Unvalidated inputs produce false gaps that trigger unnecessary strategic responses.
Pro Tip: Embed benchmarking outputs directly into your business intelligence stack as a refreshable data layer. Static PDF reports get reviewed once and forgotten. A live dashboard gets used every week.
Benchmarking only earns its cost when the insights change something. The most effective applications connect specific metrics to specific operational decisions.
Pricing strategy. Raw list prices are often misleading. Tracking effective net pricing after promotions and rebates reveals the true competitive price position. A brand that appears price-competitive on the shelf may be running deeper discounts than its competitors to maintain that position, which compresses margin without building loyalty.
Trade spend and promotional cadence. Benchmarking your promotional frequency and depth against category norms tells you whether you are over-investing in promotions to hold share or under-investing and losing velocity. Both are expensive mistakes.
Shelf space and range rationalization. Shelf movement and facings can indicate strategy shifts months before formal announcements. A competitor quietly reducing SKU count in a category is a signal worth tracking. It may indicate margin pressure, a reformulation, or a channel exit.
Marketing and sales allocation. Normalizing marketing spend as a percentage of revenue across comparable competitors shows whether your investment level is sufficient to compete or whether you are outspending the category without a return. This is one of the clearest applications of the importance of competitive benchmarking for growth-stage brands.
Embedding benchmarking in business intelligence. The most effective brands treat benchmarking as a continuous working layer inside their analytics environment, not a quarterly report. Reddog works with CPG brands to integrate competitor data into live dashboards that support weekly pricing and inventory decisions.
The gap between brands that benchmark manually and those that use automated intelligence pipelines is widening. Manual benchmarking breaks down at scale, and AI-driven pipelines validate competitor product data with confidence scoring that prevents false-positive alerts. That means fewer wasted responses to pricing changes that were data errors, not real moves.
The table below shows how traditional benchmarking methods compare to current best practices across four dimensions.
| Dimension | Traditional approach | Current best practice |
|---|---|---|
| Data collection | Manual pulls, periodic audits | Automated scraping with AI validation |
| Refresh cadence | Quarterly or annual | Continuous or weekly |
| Metric type | Absolute figures (revenue, units) | Normalized ratios (revenue per employee, spend as % of revenue) |
| Output format | Static PDF report | Live BI dashboard with alerts |
Normalizing metrics like revenue per employee or marketing spend as a percentage of total revenue enables comparison across businesses of different sizes. This normalization removes the distortion that comes from comparing absolute numbers between a $3M brand and a $30M brand. The ratio tells you about efficiency. The absolute number tells you about scale.
Visibility metrics are also gaining weight in benchmarking frameworks. Product availability, content quality scores, review ratings, and search rank are now tracked alongside traditional financial metrics. A brand with strong margins but declining content scores on Amazon is losing ground in a way that will show up in revenue six months later. Catching that signal early is the entire point of continuous benchmarking.
Pro Tip: For digital marketing analytics, platforms like BabyLoveGrowth show how integrating benchmarking signals into automated intelligence workflows can surface competitive shifts before they affect your numbers.
Competitive benchmarking delivers value only when it is tied to a specific decision, built on standardized and validated data, and embedded in an ongoing intelligence workflow rather than treated as a one-time exercise.
| Point | Details |
|---|---|
| Define one objective first | Every benchmarking exercise must link to a single business decision to produce useful output. |
| Normalize your metrics | Use ratios like marketing spend as a percentage of revenue to compare brands of different sizes fairly. |
| Track effective net pricing | List prices mislead. Net pricing after promotions reveals true competitive position and margin pressure. |
| Embed in live BI systems | Static reports get ignored. A refreshable dashboard drives weekly decisions. |
| Validate before you analyze | Unvalidated data produces false gaps and triggers unnecessary strategic responses. |
Most brands treat benchmarking as a rearview mirror. They run an exercise after a bad quarter to explain what happened. That is the least valuable way to use it.
The brands that get real value from benchmarking use it as a forward-looking control mechanism. They are not asking “why did we lose share last quarter?” They are asking “what are our competitors doing right now that will affect our shelf position in 90 days?” That shift in framing changes everything about how you design the process and what data you collect.
At Reddog, we see this pattern repeatedly with growth-stage CPG brands. They invest in a benchmarking report, get a clear picture of where they stand, and then file it away. The insight never reaches the person making the pricing call or the buyer conversation. The fix is not a better report. It is a different workflow. Benchmarking data needs to live where decisions get made, which means inside your sales analytics, your pricing model, and your inventory planning process.
The other thing I would push back on is the obsession with competitor pricing as the primary benchmarking metric. Price is visible and easy to track, so it gets tracked. But competitive intelligence in CPG is most valuable when it captures the moves that precede a price change: a shift in promotional depth, a reduction in SKU count, a change in shelf facings. Those signals tell you what is coming. Price tells you what already happened.
Discipline in data validation is non-negotiable. I have seen brands make significant pricing decisions based on scraped data that contained errors. AI confidence scoring exists precisely to prevent that. If your benchmarking process does not include a validation step, your conclusions are only as reliable as your worst data source.
— Reddog
Benchmarking without a clear path to action is just expensive reporting. Reddog works with CPG brands in the $500K to $20M revenue range to build benchmarking frameworks that connect directly to channel economics, pricing decisions, and margin planning.
Whether you are trying to understand your true competitive price position on Amazon, assess your trade spend against category norms, or build a business intelligence foundation that supports ongoing competitive monitoring, the starting point is a clear picture of where your margins stand today. Reddog’s CPG retail growth offer is built around exactly that kind of structured, margin-first analysis. Book a free 30-minute strategy call to review your channel economics, contribution margin, and competitive positioning with a team that works exclusively in CPG retail.
Competitive benchmarking is the process of comparing your company’s performance metrics directly against those of competitors to identify gaps and inform decisions. It is more quantitative and specific than general competitive analysis.
Benchmarking twice a year is the recommended minimum, with quarterly cycles required for high-velocity categories like FMCG or CPG. More frequent cycles are needed when markets shift rapidly.
The most useful metrics depend on the decision you are trying to make, but effective net pricing, marketing spend as a percentage of revenue, and market share by channel are consistently high-value starting points.
Failing to link benchmarking to a specific business decision is the most common reason benchmarking exercises produce no results. Without a clear objective, the data has no decision to inform.
AI-driven pipelines automate data collection and apply confidence scoring to validate competitor data before it enters analysis. This prevents false alerts and keeps benchmarking inputs accurate in markets where prices and product ranges change frequently.
Leave a comment: