
Published: March 2020 | Last Updated:August 2026
© Copyright 2026, Reddog Consulting Group.

Data analytics delivers three measurable outcomes for business leaders: faster, better-informed decisions, materially lower operating costs, and sharper customer insight that drives revenue. For CPG founders and operators, that translates into fewer stockouts, stronger trade promotion ROI, and quicker product iteration. The benefits of data analytics aren’t abstract. They show up on the P&L within a single fiscal year when applied to the right use cases.
TL;DR:
- Data analytics can reduce stockout rates by about 1 percentage point and cut inventory days by roughly 2 days, saving millions annually.
- Implementing demand forecasting and trade promotion modeling often yields measurable results within 60 to 90 days, especially when core data is ready.
- Predictive supply chain analytics can lower inventory carrying costs by 15 to 25 percent once the data infrastructure is mature.
- Focusing on high-value use cases like trade promotion ROI and inventory forecasting early ensures faster ROI and avoids wasted resources on unnecessary platform buildouts.
- Leaders who prioritize analytics-driven decision-making and demonstrate commitment from the C-suite gain stronger negotiating leverage and faster competitive advantage.
Data analytics is the practice of collecting, structuring, and interpreting business data to guide decisions rather than relying on intuition or lagging reports. For CPG operators, the value isn’t in having more dashboards. It’s in connecting specific data points to specific commercial levers: margin, velocity, and time-to-decision. Here’s how each core benefit maps to something you can actually measure.
1. Informed decision-making. Instead of setting promotional calendars based on last year’s playbook, analytics lets you test pricing and promotion scenarios before you commit trade dollars. Retail trade promotions can eat up to 20% of revenue for food and beverage companies, which makes simulation, not guesswork, the difference between a promotion that builds the brand and one that just discounts it. KPI affected: gross margin.
2. Improved customer understanding and personalization. Point-of-sale data, loyalty data, and digital shelf behavior tell you which SKUs convert with which shopper segments. A regional snack brand using this data to tighten assortment by retailer banner typically sees measurable lift in sell-through per linear foot. KPI affected: conversion rate and basket size.
3. Operational efficiency and cost reduction. When you can see where inventory sits, how fast it moves, and where it’s aging, you stop paying for warehouse space you don’t need. This is where analytics pays for itself fastest for growth-stage brands carrying 3PL storage costs. KPI affected: inventory carrying cost.

4. Enhanced marketing and sales evaluation. Attribution across DTC, Amazon, and wholesale channels lets you see which marketing dollars are actually driving incremental sales versus subsidizing purchases that would have happened anyway. KPI affected: marketing ROI and customer acquisition cost.
5. Better risk management and forecasting. Demand forecasting models flag supply disruptions, seasonal swings, and channel-specific demand shifts before they become a stockout or an overstock write-off. KPI affected: forecast accuracy.
6. Faster product development and innovation. Instead of a 12 to 18 month gut-feel innovation cycle, brands using real-time sales and review data can identify flavor extensions or pack-size gaps within a single retail cycle. KPI affected: time-to-shelf.
7. Real-time and near-real-time insights. Daily or weekly visibility into sell-through, out-of-stock rate, and digital shelf position replaces the 4 to 6 week lag of traditional retailer reporting. KPI affected: response time to demand shifts.
8. Improved ROI and revenue management. Price elasticity modeling and channel-level margin analysis show you exactly where a $1 price increase helps and where it triggers volume collapse. KPI affected: net revenue realization.
9. Enhanced data quality and governance. None of the above works without clean, consistent data. A governed business glossary and automated data quality monitoring are what separate analytics that drives decisions from reports that just describe the past. KPI affected: data reliability and decision speed.
Each of these connects back to the same three commercial levers: margin, throughput, and how fast you can act on what you see.
The strongest case for analytics investment isn’t theoretical. It’s in the documented outcomes from companies that have already made the shift.
Trade promotion spend is one of the biggest, most opaque cost centers in CPG. McKinsey’s research on digital and AI transformation in consumer packaged goods found that trade promotions can consume up to 20% of a food and beverage company’s revenue. Brands that model incremental lift, accounting for baseline sales, pantry loading, and cannibalization, before committing to a promotion catch margin erosion that looks like volume growth on the surface.
The inventory case for analytics investment: A large-scale retailer case study on end-to-end inventory management found that advanced analytics reduced the stockout rate by about 1 percentage point and cut days in inventory by roughly 1.9 days, producing incremental annual revenue and tens of millions of dollars in holding-cost savings at scale.
For growth-stage CPG brands, the more relevant benchmark is carrying cost. Industry analysis on data-driven consumer packaged goods practices reports that brands implementing predictive supply-chain analytics see inventory carrying costs drop by roughly 15% to 25% once forecasting and data integration are done correctly.
A few caveats matter here. These figures come from companies with mature data infrastructure already in place, and results at $1M revenue look different than at $50M. Forecast accuracy gains and cost reductions also depend heavily on data quality going in. Garbage data produces garbage forecasts, no matter how sophisticated the model.
The biggest mistake growth-stage brands make is building data infrastructure before they know which decisions that infrastructure needs to support. Start with the business problem, not the tech stack.
Common pitfalls include overbuilding a centralized data lake before anyone has used the data for a single decision, and leaving data ownership ambiguous across sales, finance, and operations. Practitioner guidance on CPG digital transformation is blunt on this point: prioritize specific use cases like trade promotion ROI or SKU-level forecasting over building a perfect, all-encompassing platform.
Pro Tip: Build modular data products, one for trade promotion analysis, one for inventory forecasting, rather than a single monolithic dashboard. Modular products ship faster, get adopted faster, and are easier to fix when the business question changes.
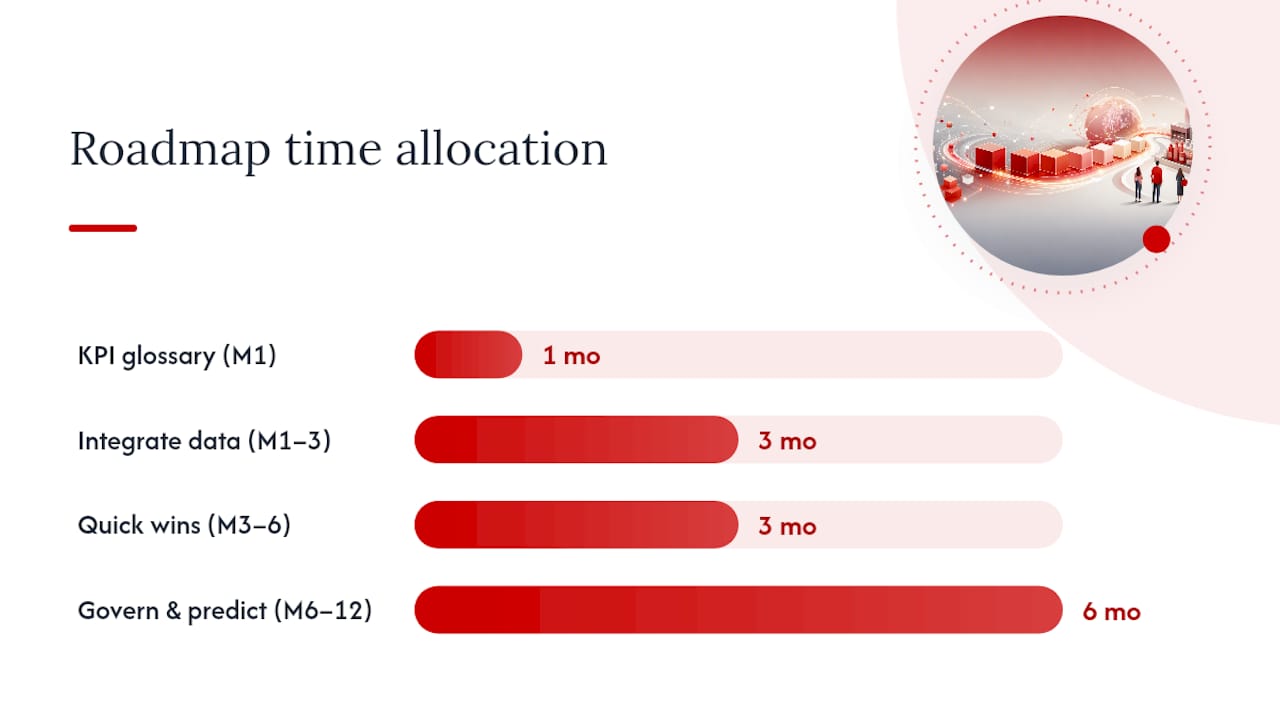
Trade promotion ROI measurement is where we see the fastest payoff. A brand running quarterly promotions across Walmart and Amazon can model incremental lift against baseline before locking in trade spend, catching promotions that drive volume without protecting margin. SKU-level forecasting is the second lever: brands with clean historical sell-through data can right-size production runs and avoid both stockouts and excess inventory sitting in a 3PL. Digital shelf monitoring, tracking share of search, content compliance, and buy box health, rounds out the picture for brands selling through marketplaces.
Leadership commitment determines whether any of this sticks. A data-driven culture led from the C-suite empowers teams to prioritize the KPIs that actually move commercial outcomes, rather than chasing every metric a dashboard makes visible.
CPG leaders should track four numbers consistently:
Timelines depend heavily on where your data currently lives. If your point-of-sale, inventory, and marketplace data already sit in usable formats, you can see results from trade promotion analysis or basic demand forecasting within 60 to 90 days. If that data is scattered across spreadsheets, retailer portals, and disconnected systems, expect 3 to 6 months of integration work before the first real insight surfaces.
Cost scales with ambition, not company size. A focused analytics engagement targeting one or two high-value use cases, trade promotion measurement or inventory forecasting, costs far less than a full data platform buildout, and it produces a return faster because it’s solving a decision you’re already making every quarter. Industry research on retail and consumer goods analytics notes that many brands still struggle with budget and integration constraints even as AI and machine learning adoption grows, which is exactly why sequencing matters more than scope.
The realistic pattern for a $500K to $20M revenue CPG brand: 60 to 90 days to first measurable insight on a narrow use case, 6 months to operationalize that insight into a repeatable process, and 12 months to see it reflected clearly in gross margin or inventory turns. Brands that try to shortcut this by building comprehensive infrastructure before proving value on a single use case tend to spend more and see results later, not sooner. The sequencing is the strategy.
The gap between CPG brands that use analytics well and those that don’t is widening, not narrowing. Retailers increasingly expect vendors to arrive with data, not just a pitch deck. A brand that can show a buyer exact sell-through velocity by region, forecasted demand by season, and a documented trade promotion ROI history has a materially stronger negotiating position than one relying on anecdote.
This shows up most clearly in retail buyer relationships. Category managers at major retailers are themselves data-driven, and they respond better to vendors who speak that language. A brand that can walk into a Walmart or Target category review with SKU-level velocity data and a clear forecast wins more shelf space than one asking for a leap of faith.
It also compounds. Brands that start tracking digital shelf performance, share of search and content quality across marketplaces, early build a data history that makes every subsequent decision faster and more accurate. Competitors starting from zero are always a step behind, not because the tools are unavailable to them, but because building a reliable historical dataset takes time no amount of budget can fully compress.
The advantage isn’t permanent for any single brand. It belongs to whoever keeps refining their models fastest, which is exactly why this is an ongoing capability to build, not a project to finish.
Analytics changes how your team spends its time, not just what decisions it makes. Operations staff who used to spend hours reconciling inventory numbers across spreadsheets and retailer portals can instead review an automated exception report and act on the handful of SKUs that actually need attention. That’s hours redirected from data wrangling to decision-making every single week.
Sales teams benefit similarly. Instead of manually pulling velocity reports before a retailer meeting, a rep with access to a live dashboard walks in prepared, and spends the prep time refining the pitch instead of assembling the data.
Workforce optimization also shows up in hiring decisions. Growth-stage brands don’t need to hire a full data science team to get these benefits. A single analyst who can build and maintain a few modular data products, paired with clean source data, often outproduces a larger team working from messy, disconnected systems. The Bureau of Labor Statistics tracks strong demand for data-focused roles, which means brands competing for that talent should be precise about what they actually need before hiring, a forecasting specialist and a trade promotion analyst are different skill sets, not interchangeable “data person” hires.
Clean, well-governed data isn’t just a commercial advantage. It reduces regulatory exposure. CPG brands face labeling requirements, ingredient disclosure rules, and retailer-specific compliance standards that vary by channel and, for brands selling internationally, by country. A governed data system with a documented audit trail makes it far easier to prove compliance when a retailer or regulator asks for documentation.
Traceability is the clearest example. If a recall becomes necessary, the speed at which you can identify affected lots, retailers, and inventory locations directly depends on the quality of your underlying data systems. A brand with real-time inventory tracking can isolate an issue to specific distribution centers in hours. A brand relying on manual reconciliation might take days, with real cost and reputational consequences attached to that delay.
Retailer compliance scorecards, covering on-time delivery, fill rate, and packaging accuracy, are themselves a form of regulatory pressure that analytics helps you manage proactively rather than reactively. Brands that monitor their own compliance metrics before a retailer flags a problem avoid the chargebacks and delisting risk that come with repeated violations. None of this requires an enterprise compliance platform. It requires the same data discipline, clean sourcing, clear ownership, consistent definitions, that drives every other benefit on this list.
Too many executives treat analytics as an IT line item instead of a leadership priority, and that’s backwards. The brands seeing real margin gains have C-suite leaders who personally champion two or three high-value use cases, usually trade promotion ROI and inventory forecasting, rather than funding a platform and hoping insights emerge. If you’re running a $500K to $20M brand, your next move should be picking one margin leak and proving the model before you build anything bigger. That’s the work we help operators prioritize every day.
— Reddog
Everything covered here, trade promotion ROI, inventory velocity, forecast accuracy, only creates value when it’s tied to your actual channel economics. That’s where a lot of CPG brands hit a wall: they have the data but not the context to know which margin leak to fix first.
Reddog offers qualified CPG founders and operators a free 30-minute strategy call built around exactly that gap. The session covers your contribution margin by channel, Amazon and Walmart marketplace economics, inventory velocity, and where your growth plan has room to move faster without adding risk. It’s a working review, not a sales pitch, focused on the specific numbers driving your business right now. If your brand is in the $500K to $20M revenue range and you want a clear-eyed read on where your margin is leaking and where the fastest wins are, book your free strategy call and bring your current channel numbers to the conversation.
Leave a comment: