Published: March 2020 | Last Updated:November 2025
© Copyright 2026, Reddog Consulting Group.

If you’re selling on Amazon, one metric is central to your advertising performance: Advertising Cost of Sales (ACoS).
In simple terms, ACoS tells you exactly how much you spend on advertising for every dollar you make in sales. Understanding this metric is the foundational first step to building a profitable, scalable ad strategy.
Think of your Amazon ad campaigns as an engine. You can pour fuel (your ad spend) into it, but if you don't know your fuel efficiency, you’re just guessing. ACoS is your miles-per-gallon. It’s the most direct measure of how efficiently your Amazon PPC ads are performing.
The formula is refreshingly simple:
ACoS = (Ad Spend ÷ Ad Revenue) x 100
For example, if you spend $30 on ads and generate $100 in sales from those ads, your ACoS is 30%. This means you spent 30 cents to make every dollar. A lower ACoS typically indicates higher ad efficiency, but the "right" ACoS always depends on your specific business goals.
At RedDog Group, every growth strategy begins with a solid Foundation, and ACoS is a non-negotiable part of it. It’s not a vanity metric on a dashboard; it’s a vital sign for your marketing investment. Without a firm handle on ACoS, you're flying blind, unable to distinguish which campaigns drive real profit and which are just burning cash.
This single metric helps you answer fundamental questions about your advertising:
Getting this right is a cornerstone of mastering PPC on Amazon.
To make ACoS truly actionable, you must know your breakeven point. Your breakeven ACoS is the highest your ACoS can be before you start losing money on a sale generated by an ad. It’s tied directly to your product's profit margin before ad spend.
Here’s the straightforward calculation:
Breakeven ACoS = Pre-Ad Profit Margin %
Let’s say your product sells for $50. After all costs—manufacturing, shipping, and Amazon fees—you’re left with $15 in profit. That’s a 30% profit margin. In this case, your breakeven ACoS is 30%. Any campaign with an ACoS below 30% is profitable. Anything above 30% means you're losing money on each sale from that ad.
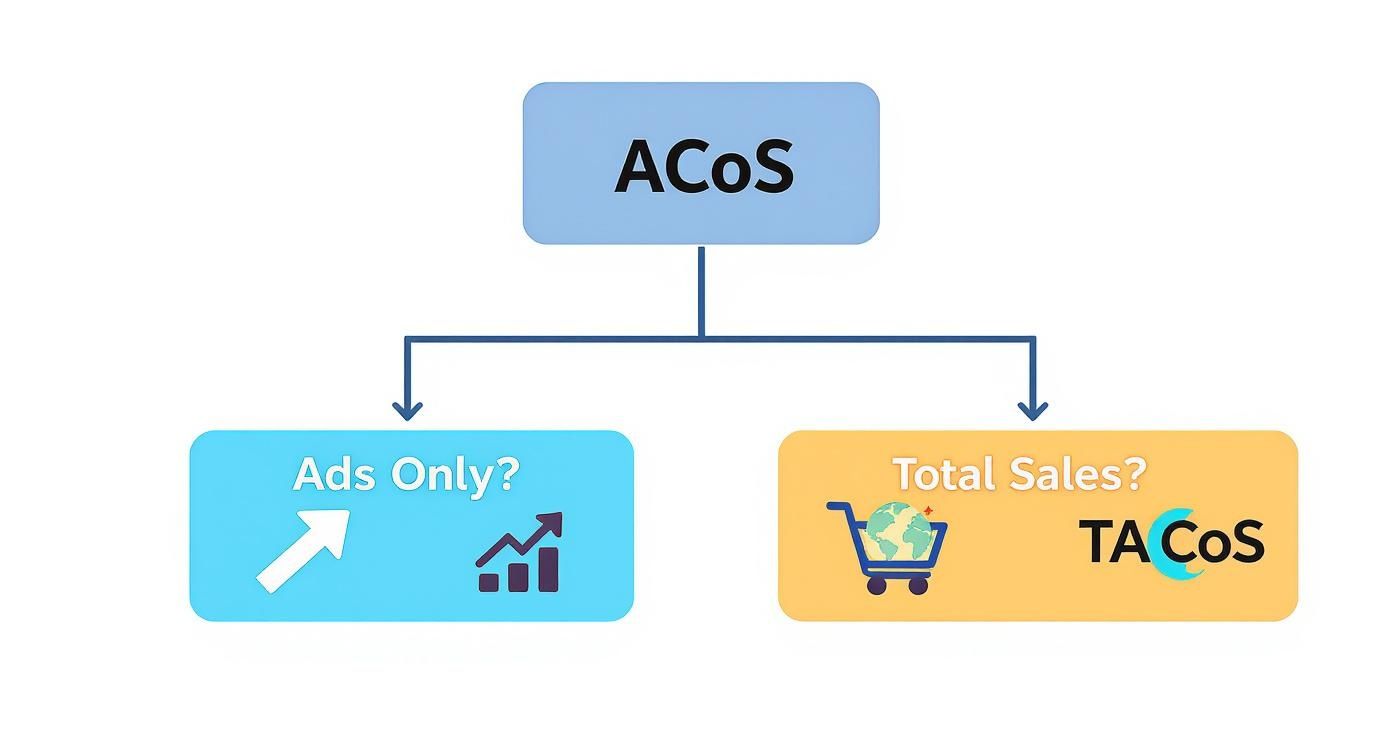
Amazon’s own visual explains this relationship perfectly.
This diagram drives home the direct link between what you spend and what you earn—the core concept of ACoS.
To help you get a quick handle on these concepts, here’s a simple table breaking down the essentials of ACoS.
| Concept | What It Means | Why It Matters |
|---|---|---|
| ACoS | The percentage of your sales revenue spent on advertising. | It's your primary gauge of ad campaign efficiency and direct profitability. |
| Formula | (Ad Spend ÷ Ad Revenue) x 100 | A simple calculation to quickly assess performance at any level. |
| Breakeven ACoS | The ACoS percentage that equals your pre-ad profit margin. | This is your profitability line in the sand; anything higher is a loss. |
Once you know this number, ACoS transforms from a simple metric into a powerful tool for managing profitability and scaling your brand on your own terms.
"What's a good ACoS?" It's one of the most common questions in eCommerce, but the honest answer is: there's no magic number. A "good" ACoS is strategic, intentional, and aligned with what you’re trying to achieve at a specific moment.
Chasing a generic industry average, like 25%, without context is like setting a course without a destination. An ACoS that’s wildly profitable for an established product could be a strategic loss for a new launch. The goal isn’t just hitting a low number; it’s hitting the right number for your objective.
This means shifting your perspective. Instead of asking what a good ACoS is, the better question is, "What is my ACoS supposed to accomplish right now?" The answer changes completely depending on where your product is in its lifecycle.
Your ACoS strategy can't be static. It needs to adapt as your product moves from launch to maturity. Each phase has a different goal, and your ACoS target is the main lever you pull to achieve it. A high ACoS isn't necessarily bad if it's a calculated investment in future growth.
For example, an aggressive 50% ACoS on a new product isn’t a sign of failure; it’s a strategic push for visibility, crucial first sales, and customer reviews. This initial investment builds the sales velocity and social proof needed for long-term organic ranking—a core part of our Foundation pillar. On the flip side, a mature, best-selling product might aim for a lean 15% ACoS to maximize profit from its strong market position.
A "good" ACoS isn't a static number. It's a flexible target that should directly reflect your current business objective, whether that's aggressive market capture, steady growth, or pure profit maximization.
This lifecycle approach helps you make smart, data-driven decisions. As a general guide, the ideal ACoS on Amazon often follows a clear path. During the critical launch phase (the first three months), an ACoS between 40–50% is standard for building momentum. As the product moves into its growth phase over the next year, that target typically dials back to 25–35%. Once a product is mature and stable, the focus shifts to efficiency, with a target ACoS of 15–25%. You can learn more about these benchmarks and find detailed insights into how ACoS and TACoS align with your strategy.
To define the right ACoS, you must look beyond the ad console and consider the bigger picture. It’s about ensuring your ad strategy works hand-in-hand with your financial and brand goals.
Here are the key factors to consider:
By weighing these factors, you stop chasing an arbitrary number and start setting a strategic ACoS that drives measurable results and supports sustainable growth.
Focusing only on ACoS is like judging a movie by a single scene. You see a snapshot of the action, but you miss the entire plot. To truly understand your advertising's impact across all channels, you need to zoom out.
That’s where a more powerful metric comes in: Total Advertising Cost of Sales (TACoS). While ACoS measures how efficiently your ads convert into ad-driven sales, TACoS measures your ad spend against your total sales—both paid and organic.
The formula for TACoS is simple, but the perspective it provides is game-changing.
TACoS = (Ad Spend ÷ Total Revenue) x 100
Why does this matter so much? Because effective advertising doesn't just generate immediate sales. It creates a powerful "halo effect" that lifts your entire brand. Your ads boost product visibility, which in turn drives more organic sales, improves search ranking, and builds brand awareness over time. TACoS is the only metric that captures this full-circle impact.
For a real-world example, let's say you spend $2,000 on ads. Those ads bring in $10,000 in sales, giving you a respectable 20% ACoS. But your total sales for that product hit $50,000. In this case, your TACoS is just 4%. This tells a much bigger story: your ads aren’t just efficient; they’re fueling your overall sales engine.
A declining TACoS over time is a fantastic sign of brand health. It means your brand is gaining organic momentum and becoming less dependent on paid ads for growth.
If you’re managing campaigns on platforms like Google or Facebook, ACoS can feel a little backward. Most other ad platforms run on Return on Ad Spend (ROAS), which measures revenue generated for every dollar spent.
The good news? ACoS and ROAS are just two sides of the same coin.
ROAS tells you how many dollars you get back for every dollar you invest in ads. It's simply the inverse of ACoS.
You can easily flip between the two. A 25% ACoS is the same as a 4x ROAS (1 ÷ 0.25 = 4). A 20% ACoS is a 5x ROAS (1 ÷ 0.20 = 5). For brands selling across multiple channels, ROAS provides a familiar benchmark that makes it easier to compare Amazon's performance against other marketing efforts.
These three metrics should never be viewed in isolation. Think of them as a diagnostic trio that gives you a complete story, from short-term ad profitability to long-term brand health. They form a complete picture of your growth engine, aligning perfectly with our Foundation → Optimization → Amplification framework.
Here's how they complement each other:
| Metric | What It Measures | What It Tells You |
|---|---|---|
| ACoS | Ad Spend vs. Ad Sales | How efficient your ads are at generating immediate sales. |
| TACoS | Ad Spend vs. Total Sales | How your ad investment is impacting overall brand growth and organic sales. |
| ROAS | Ad Revenue vs. Ad Spend | How many dollars you earn for every dollar spent on ads (a universal metric). |
By tracking all three, you move from just managing campaigns to making strategic investments. You can see not only if an individual campaign is profitable (ACoS) but if your entire advertising strategy is building a stronger, more self-sustaining brand (TACoS).
When your ACoS starts creeping up, it’s a symptom, not the disease. A rising number can be alarming, but it’s really just a signal that something in your advertising engine needs a tune-up. This is where we move into our Optimization pillar. Instead of guessing, we can systematically diagnose the root cause and apply targeted fixes.
This diagnostic approach starts by asking the right questions. A high ACoS on Amazon isn't just about overspending; it's about inefficiency somewhere in the funnel. Are you attracting the wrong audience? Paying too much for clicks? Or failing to convert shoppers once they land on your product page?
To find the answer, you need a logical starting point. The most common source of wasted ad spend is often hiding in your search term report. This is ground zero for identifying where your budget is leaking.
From there, we can work through the entire campaign structure to pinpoint the issue.
This decision tree helps visualize how to approach advertising metrics, starting with ACoS and branching out to consider the full picture with ROAS and TACoS.
This flow shows that while ACoS is a critical starting point, a full diagnosis requires looking at its relationship to total sales (TACoS) and overall return (ROAS).
Each step in this diagnostic process is designed to uncover a specific inefficiency. For example, your search term report directly reveals the quality of your traffic. If a customer searches for "men's running shoes" and your ad for women's casual sandals appears, you have an expensive mismatch.
Think of it like a leaky pipe. You don't just put a bucket under it; you find the source of the leak and patch it. Negative keywords are your patches, stopping the flow of irrelevant, costly clicks.
Similarly, your bidding strategy and match types control the cost of your traffic. Overbidding on generic, hyper-competitive keywords can deplete your budget quickly. It's also worth remembering that Amazon's ACoS benchmarks vary wildly by category. One study found the average ACoS for competitive niches to be around 35%, reflecting the higher cost of visibility, while brands with higher margins might target a 22% ACoS. You can explore more data on category-specific advertising costs.
Finally, your product listing is all about conversion. This is where your ad spend either pays off or goes to waste. A click is just an introduction; your listing has to convince the customer to buy. This is a crucial area to examine, and you can get more details in our guide on optimizing Amazon product listings for maximum growth. By systematically moving through these checkpoints, you turn the daunting task of "fixing ACoS" into a manageable process that puts you back in control.
Once you’ve diagnosed the cause of high ad spend, it’s time to act. This is our Amplification phase—where data-driven tweaks can multiply your results and create a competitive edge. Let's move beyond the basics into advanced tactics that top sellers use to shape traffic, control costs, and drive down their ACoS on Amazon.
While the average ACoS for sellers often hovers around 29.41%, top performers consistently operate with greater efficiency. They don't just set and forget their campaigns; they actively manage every variable to maximize profitability.
One of the biggest levers for better control is your campaign structure. Instead of lumping dozens of keywords into a single ad group—a common mistake—many pros rely on Single Keyword Ad Groups (SKAGs). This strategy provides unparalleled control over bids and ad copy for your most valuable keywords.
With a SKAG, you can adjust your bid with surgical precision based on that single keyword's performance. This ensures you’re never overpaying for a click and prevents your budget from being wasted by less effective keywords hiding in a larger ad group.
Negative keywords are more than just a tool to block irrelevant searches. They are a sophisticated way to direct traffic exactly where you want it. For example, by adding a term as a negative phrase match in your broad match campaign, you can push traffic for that specific term to a more targeted exact match campaign where you have tighter control.
This "traffic sculpting" technique ensures that shoppers with high buying intent land on campaigns where you can bid more aggressively and convert more effectively, preventing wider, discovery-focused campaigns from cannibalizing sales.
Think of your broad match campaign as a wide fishing net. A negative keyword acts as a filter, letting smaller fish pass while guiding the prize catches into a specialized tank where they get your full attention.
Amazon’s bidding options offer different levels of control, and picking the right one is critical for reining in ACoS. While "Dynamic bids - up and down" can be great for aggressive growth, it can also send costs soaring if a campaign isn't performing well.
Simply switching a high-ACoS campaign from "up and down" to "down only" can be one of the quickest ways to stop budget leaks and regain control.
Beyond keywords, Product Targeting (PAT) campaigns let you place your ads directly on competitors' product pages. This is a powerful way to capture market share from direct rivals or even upsell customers on complementary products.
To lower your ACoS with PAT campaigns, get strategic. Target products where you have a clear advantage—whether it's a better price, more reviews, or superior features. By zeroing in on competitors' weaker listings, you boost your odds of conversion at the moment of decision. This approach is even more powerful when integrated with your off-Amazon efforts. To learn more, check out our guide on Amazon DSP advertising strategies.
For sellers wanting to push the boundaries, leveraging Artificial Intelligence in advertising can uncover new efficiencies. These tools can automate many advanced bidding and targeting adjustments, allowing you to scale optimization efforts beyond manual capabilities.
Managing your ACoS on Amazon isn’t a one-time task. It’s a continuous cycle of measuring, analyzing, and refining. To make real, lasting progress, you need a simple but powerful framework for tracking performance.
This is what separates reactive sellers from proactive brand builders. It moves you from putting out fires to executing a scalable growth strategy. A solid reporting process helps you spot meaningful trends and make decisions based on data, not daily noise.
An effective dashboard doesn't need to be complicated. It just needs to tell the whole story of how your advertising impacts your business. Instead of viewing ACoS in a vacuum, you need a core set of Key Performance Indicators (KPIs) that provide a complete picture of ad efficiency and overall brand health.
Your weekly or monthly check-in should always include these four metrics:
This reporting framework plugs directly into our core growth methodology at RedDog. It’s designed to create a continuous feedback loop that powers sustainable, profitable expansion on and off Amazon.
By consistently monitoring these core metrics, you empower a virtuous cycle: a strong Foundation (understanding the data) leads to smarter Optimization (fixing inefficiencies), which unlocks strategic Amplification (scaling what works).
This isn't just about chasing a lower number on a screen; it's about building a resilient, data-driven operation. This framework gives you the power to turn insights into action, ensuring every dollar you invest works harder to grow your brand.
Ready to put these strategies into action? Let’s Talk Growth.
When you're running Amazon ads, a few key questions always come up. Here are plain-language answers to the most common ones we hear, so you can move forward with confidence.
Think of ACoS (Advertising Cost of Sales) and ROAS (Return on Ad Spend) as two sides of the same coin. They measure the same thing but from different perspectives.
Amazon's ad console is built around ACoS, but many brands use ROAS to maintain consistent metrics when comparing performance across platforms like Google or Facebook.
This is the million-dollar question, and the answer is: it depends entirely on your goals. There is no universal "good" number. The right ACoS is always tied to your strategy, profit margins, and your product's lifecycle stage.
A low ACoS (e.g., 15-25%) is typically the goal for established, mature products where the objective is maximizing profitability. Conversely, a high ACoS (even 40-50% or more) can be a smart strategic investment for a new product launch to drive visibility, secure initial sales and reviews, and improve organic rank.
Absolutely. While you can't automate high-level strategy, you can automate the time-consuming tasks of campaign management. This is where specialized Amazon PPC software is valuable.
Smart automation tools can handle the day-to-day work—adjusting bids in real-time, identifying and adding negative keywords, and reallocating budget to what’s working. This frees you to focus on the big picture, like the Optimization and Amplification of your campaigns, instead of drowning in manual tweaks.
It’s about working smarter, not harder, and ensuring your campaigns are continuously fine-tuned for peak performance.
At RedDog Group, we turn complex data into clear, actionable growth plans. If you're ready to build a data-driven advertising system that scales your brand profitably, let's connect.
Leave a comment: